


Abstract
CT-based attenuation correction (CTAC) of myocardial SPECT images has been becoming more popular—and the application of SPECT/CT increasing—because it prevents attenuation-induced image degradation. However, CTAC can be affected by overestimation of counts caused by metals. It is possible that pacemaker, left ventricle (LV), and implantable cardioverter-defibrillator (ICD) leads have an influence on myocardial SPECT findings. The present study investigated the impact of these leads on SPECT with CTAC. Methods: Pacemaker, LV, and ICD leads were examined using a simple phantom and a cardiac phantom. The effects of metal artifacts from leads in high-resolution mode and ultra-high-resolution mode were assessed using a simple phantom. Images and polar maps were generated from the cardiac phantom. Results: The pacemaker and LV leads essentially had no influence, whereas the ICD lead resulted in maximal (6%) overestimation in a study investigating which metals cause artifacts that affect CTAC. None of the leads seriously influenced CTAC when the cardiac phantom was used. Conclusion: Small pacemaker or ICD and LV leads will cause a slight overestimation, but CTAC should be used because it can correct attenuation of the inferior and anteroseptal walls on SPECT images.
Myocardial perfusion SPECT has become an important modality in the medical assessment of cardiac diseases (1,2). Various functional cardiac conditions can safely be assessed by selection of the optimal radiopharmaceutical. In myocardial perfusion SPECT images, blood flow in the inferior and anterior walls can appear to be reduced because of attenuation caused by the female breast, resulting in false-positive findings. CT-based attenuation correction (CTAC) can negate such effects and thus improve diagnostic accuracy (3–6), although some disadvantages such as misregistration caused by respiratory motion and overestimation of counts due to metals must be considered (7–9). Overestimation associated with pacemaker or implantable cardioverter-defibrillator (ICD) leads is clear in PET but less so in SPECT (Fig. 1) (10). The degree to which leads affect counts is unclear even when CTAC is not used, and myocardial perfusion SPECT images of individuals with intracorporeal leads cannot be correctly interpreted. The present study aimed to clarify the influence of pacemaker and ICD leads on SPECT images.

Example images with pacemaker lead in body: SPECT with CTAC (A), fused CT and SPECT with CTAC (B), and CT (C). A color version of this figure is available as a supplemental file at http://tech.snmjournals.org.
MATERIALS AND METHODS
Imaging
We used a simple phantom and a phantom that imitated the human physique to investigate the influence of leads. Three point sources were positioned at equal intervals in a straight line on the bottom of a simple phantom containing water. The point sources were rectangular (3 × 1 cm) filter papers permeated with 18.3 ± 1.5 MBq (mean administered activity) of 99mTc-pertechnetate. Point source 1 (PS1) was fixed at a location that did not overlap with a lead in any experiments. To determine the influence of the electrodes, point source 2 (PS2) was placed at the tip of a lead. To determine the influence of portions other than the tip, point source 3 (PS3) was not positioned at the tip of a lead. We investigated the effects of a left ventricular (LV) Attain StarFix OTW 4195 lead for cardiac resynchronization therapy (Medtronic Japan Co. Ltd.), a CapSureFix MRI 5086 pacemaker lead (Medtronic) for MR imaging correspondence, and a Sprint Quattro 6944 ICD lead (Medtronic). All images were acquired using a Symbia T2 scanner (Siemens Medical Solutions) with a pair of low-energy, high-resolution collimators, a dual-head γ camera, and a CT scanner. The conditions for image acquisition were changed according to the purpose of each experiment, and images were analyzed using a Syngo nuclear medicine workstation (Siemens Medical Solutions). Images were reconstructed using 3-dimensional ordered-subsets expectation maximization. Each experiment was repeated 3 times under each condition.
Influence of Leads in High-Resolution Mode
We examined the influence of leads in high-resolution mode with a matrix of 128 × 128, a zoom of 1.45, an angular step of 32, and a 30-s acquisition time per frame. Counts from a 15% energy window at 140 keV were acquired. CT images were acquired from the head to the pelvic floor at 140 kV, 80 mA, a tube rotation time of 0.8 s, a pitch of 1.2, and a slice thickness of 3 mm (2 × 1.5). Images were reconstructed using 3-dimensional ordered-subsets expectation maximization (5 iterations, 8 subsets). Figure 2 shows the configuration of the phantom and the point sources. Control experiments proceeded without leads, and the ratios of PS1, PS2, and PS3 counts with and without CTAC were calculated.
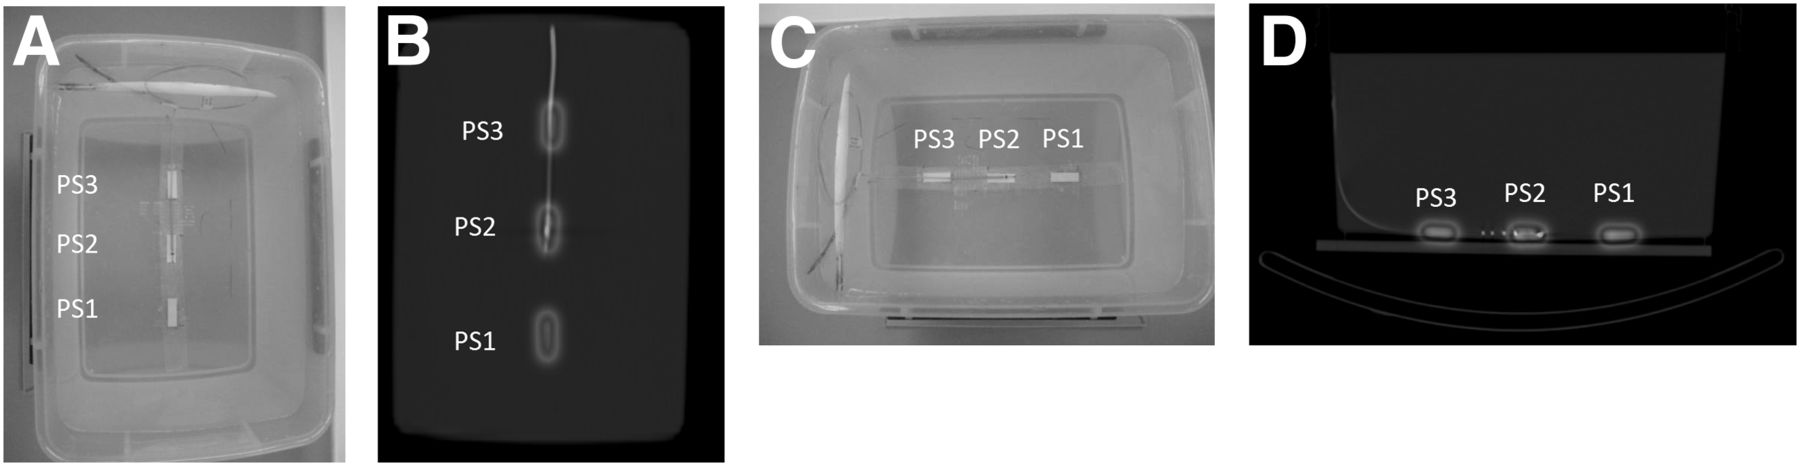
Configuration of phantom and point source: photograph showing normal resolution and high resolution (A), fused CT and SPECT images showing normal resolution and high resolution (B), photograph showing metal artifact from lead (C), and fused CT and SPECT images showing metal artifact from lead (D). A color version of this figure is available as a supplemental file at http://tech.snmjournals.org.
Influence of Leads in Ultra-High-Resolution Mode
To test the possibility that the leads might have a negligible influence in ultra-high-resolution mode because of their narrow diameter, we repeated the experiments using a matrix of 256 × 256, a zoom of 1.45, and a 90-s acquisition time per frame. Counts from a 15% energy window at 140 keV were acquired. CT images were acquired with a slice thickness of 1 mm (2 × 1.0). Figure 2 shows the configuration of the phantom and point sources. Control experiments proceeded without leads, and the ratios of PS1, PS2, and PS3 counts with and without CTAC were calculated.
Metal Artifacts Arising from Leads
Metal artifacts are generated when metal is in the plane of x-ray entrance. Therefore, leads placed in line with this plane generate considerable artifacts. Figure 2 shows the configuration of the phantom and point sources. SPECT images were acquired using a matrix of 128 × 128, a zoom of 1.45, and a 30-s acquisition time per frame. CT images were acquired with a slice thickness of 3 mm (2 × 1.5). Control experiments proceeded without leads, and the ratios of PS1, PS2, and PS3 counts with and without CTAC were calculated.
Cardiac Phantom
Leads were installed in an RH-2 thorax-heart phantom (Kyoto Scientific Instrument Co. Ltd.) (Fig. 3). The LV and pacemaker leads were installed together, and the mediastinal portion and right ventricle were filled with water.
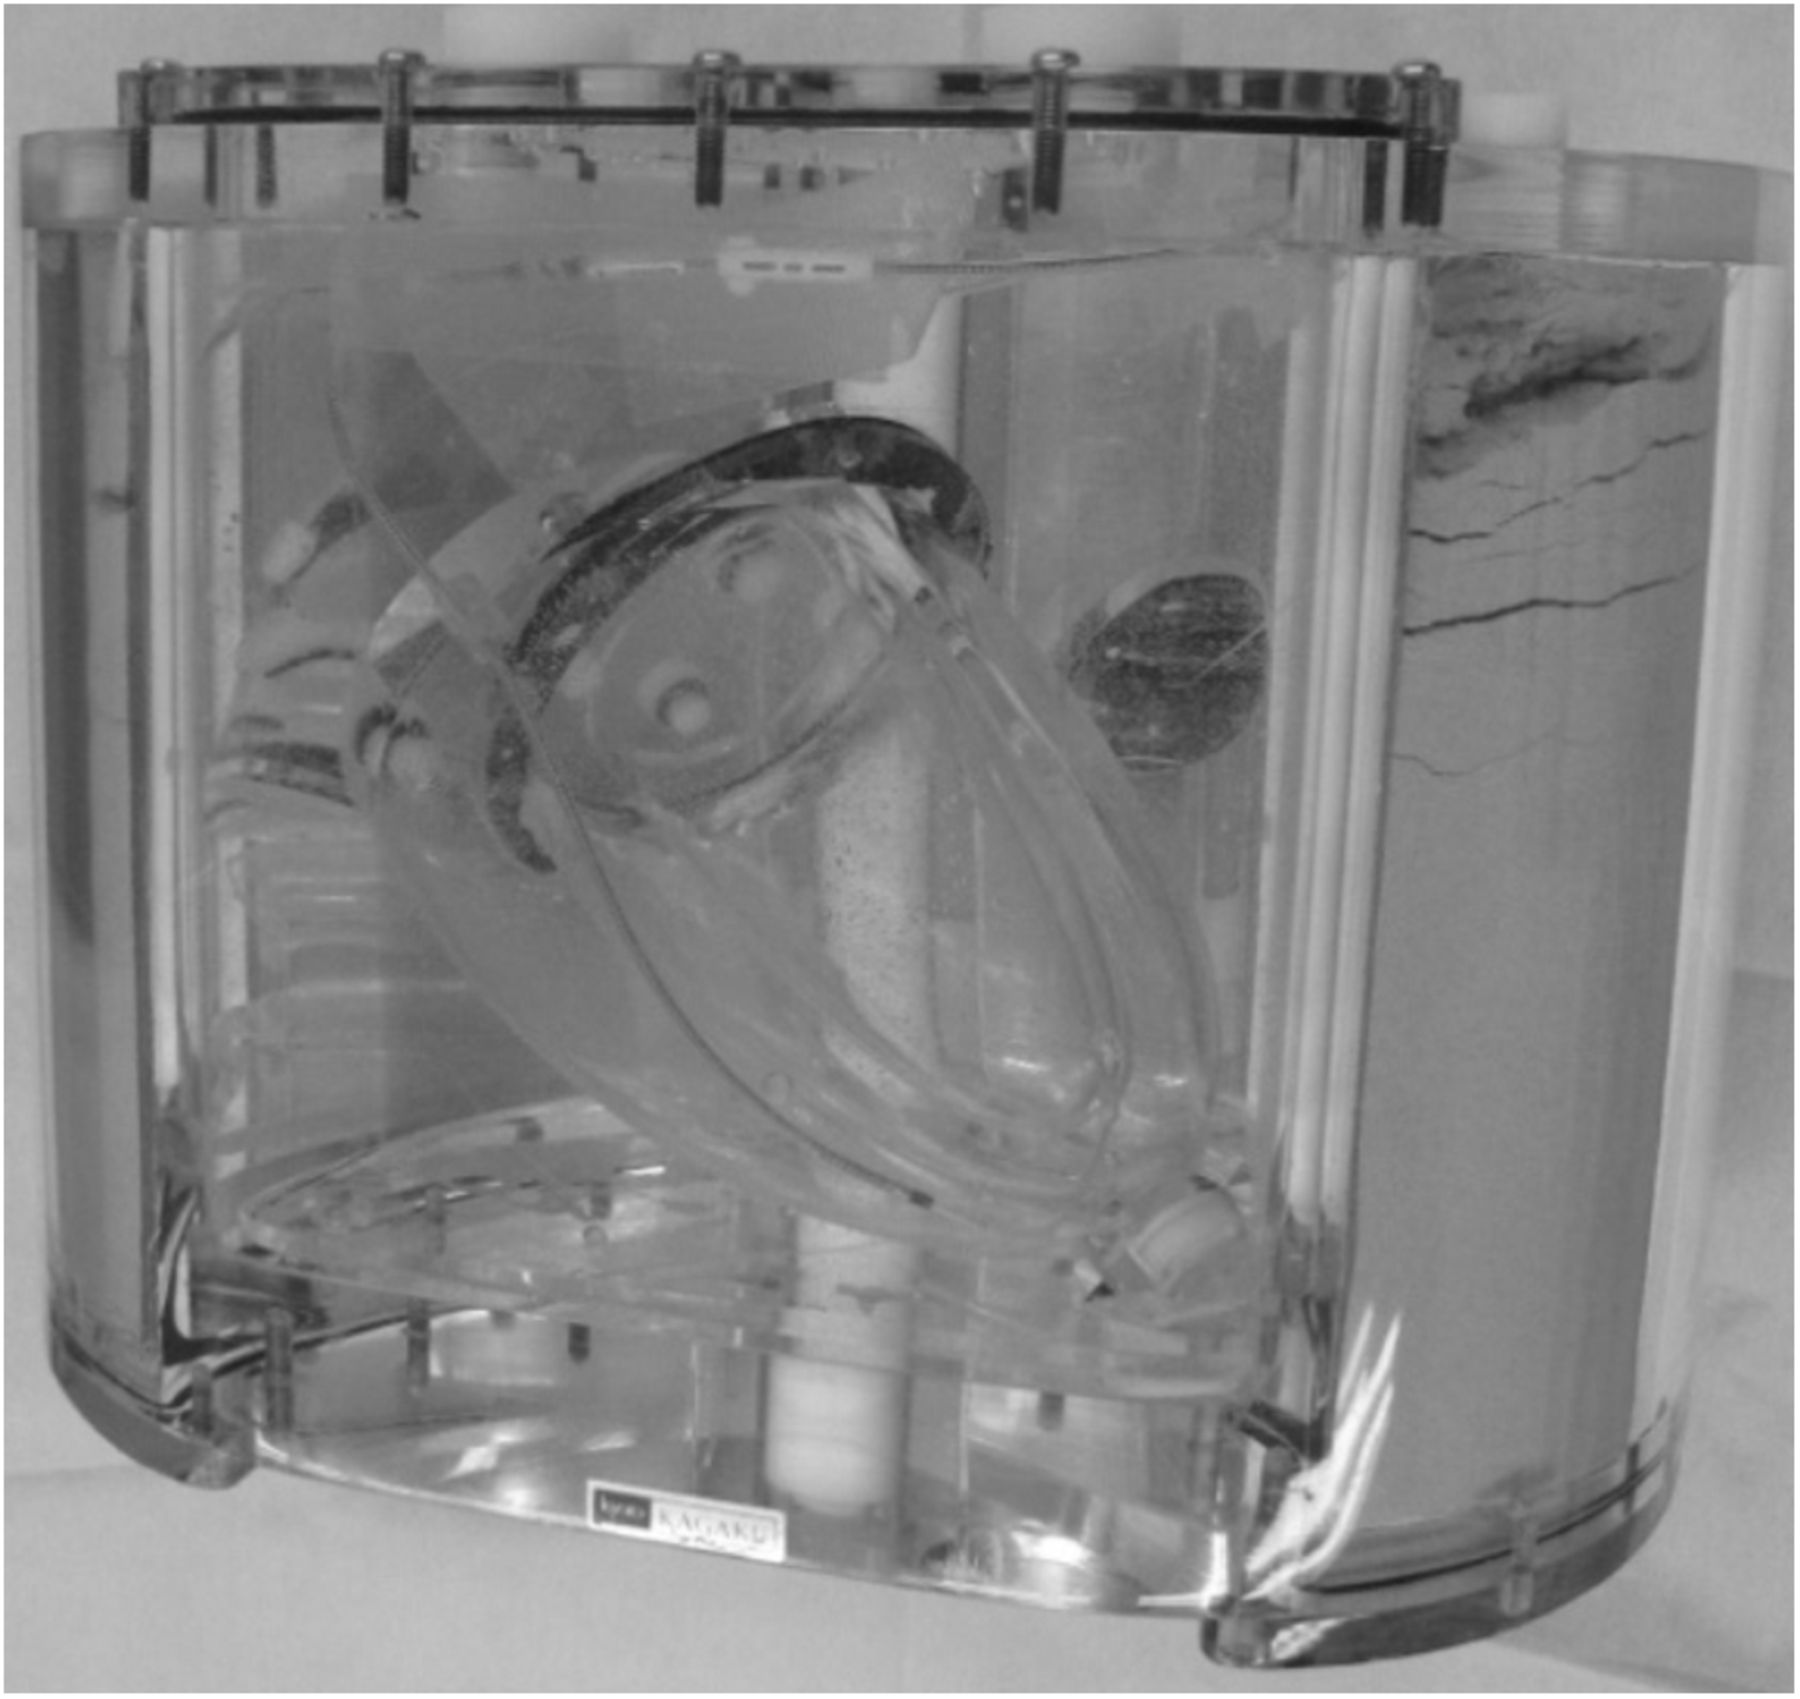
Photograph showing configuration of phantom and lead.
99mTc-pertechnetate (400 MBq) was poured into the left cardiac ventricle. SPECT imaging proceeded using a matrix of 128 × 128, a zoom of 1.45, and a 90-s frame acquisition time. CT images were acquired with a slice thickness of 3 mm (2 × 1.5). The influence of leads was estimated from polar maps divided into 17 segments as recommended by the American Heart Association and from SPECT images. Relative ratios (%) of count uptake in each segment were calculated. Control experiments proceeded without leads for comparison. Data from all experiments were analyzed using paired t tests.
RESULTS
High-Resolution Mode
Table 1 shows ratios of counts in PS2 and PS3 compared with PS1 in high-resolution mode with and without CTAC. The error was 5% without CTAC, and overestimation was as low as 4%, even with CTAC.
Ratio of PS1 and Each Point Source in Simple Phantom
Ultra-High-Resolution Mode
Table 1 also shows ratios of counts in PS2 and PS3 compared with PS1 in ultra-high-resolution mode with and without CTAC. The results were essentially the same as those obtained in high-resolution mode.
Metal Artifacts Arising from Leads
Table 1 shows ratios of counts in PS2 and PS3 compared with PS1 with and without CTAC. The ICD lead increased the overestimation to 6%. The metal content in the ICD lead was probably responsible for this increase. The results for the other leads showed the metal artifacts to have little influence on the counts.
Cardiac Phantom
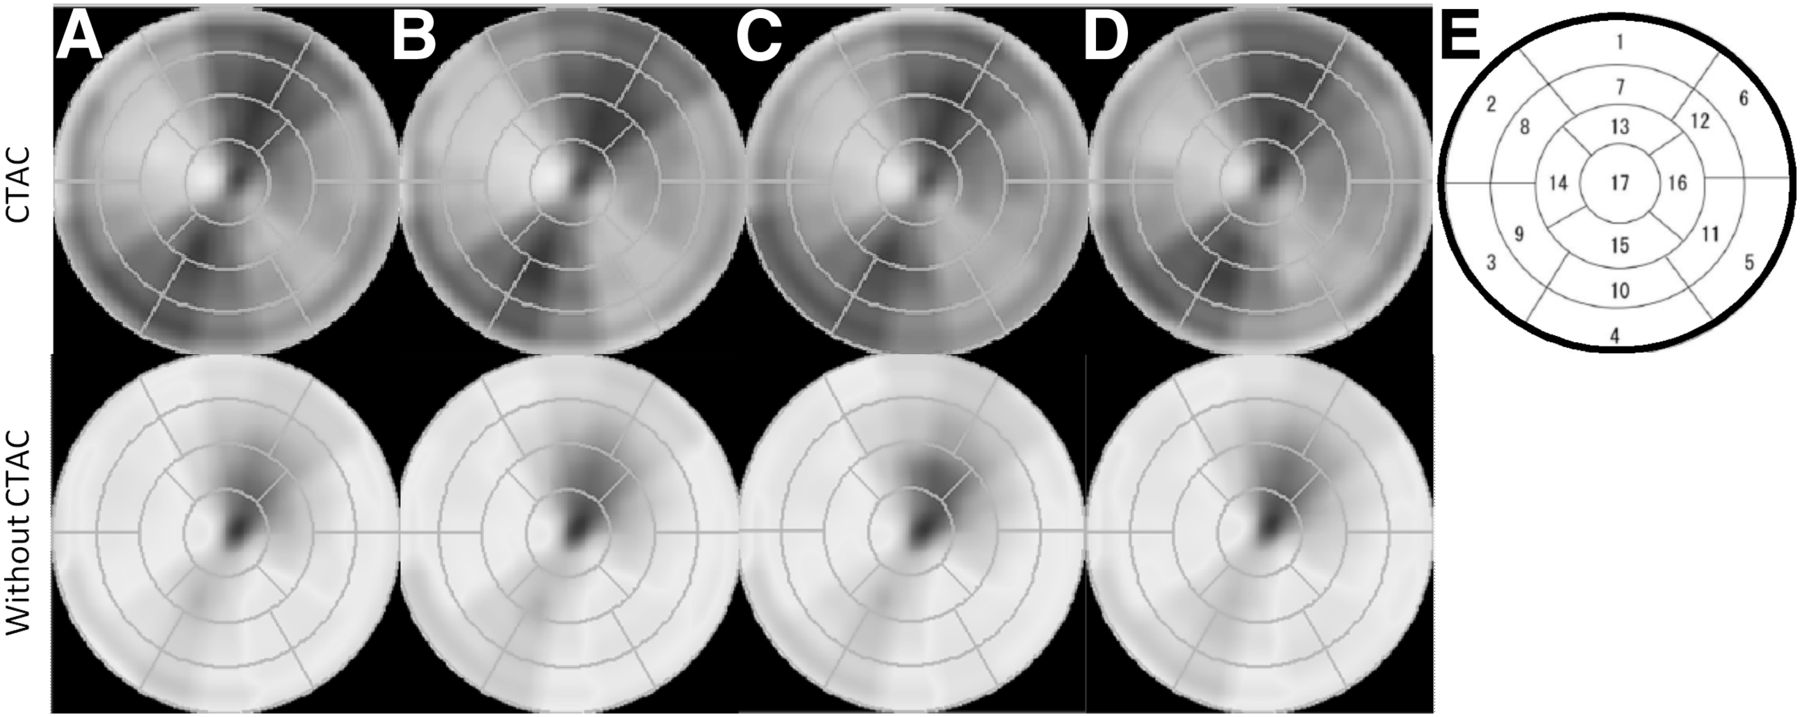
Figure 4 shows fused and SPECT images with and without leads. Leads influenced the fusion images but not to such an extent that they differed from the images obtained without leads. Figure 5 shows polar maps, and Table 2 shows relative (%) uptake in each segment. Paired t tests did not find a significant difference (5%) in uptake, regardless of the presence or absence of leads.
Fused images and SPECT images: fused image in which phantom includes pacemaker and LV lead (A), SPECT image in which phantom includes pacemaker and LV lead (B), fused image with no lead (C), and PET image with no lead (D). In A, presence of LV lead seems to have an influence, but comparison with B proves that there is no influence. A color version of this figure is available as a supplemental file at http://tech.snmjournals.org.

Polar maps obtained with no lead (A), pacemaker lead (B), ICD lead (C), and pacemaker and LV lead (D), and chart showing segmentation by American Heart Association (F). A color version of this figure is available as a supplemental file at http://tech.snmjournals.org.
Relative Percentage Count Uptake of Each Segment
DISCUSSION
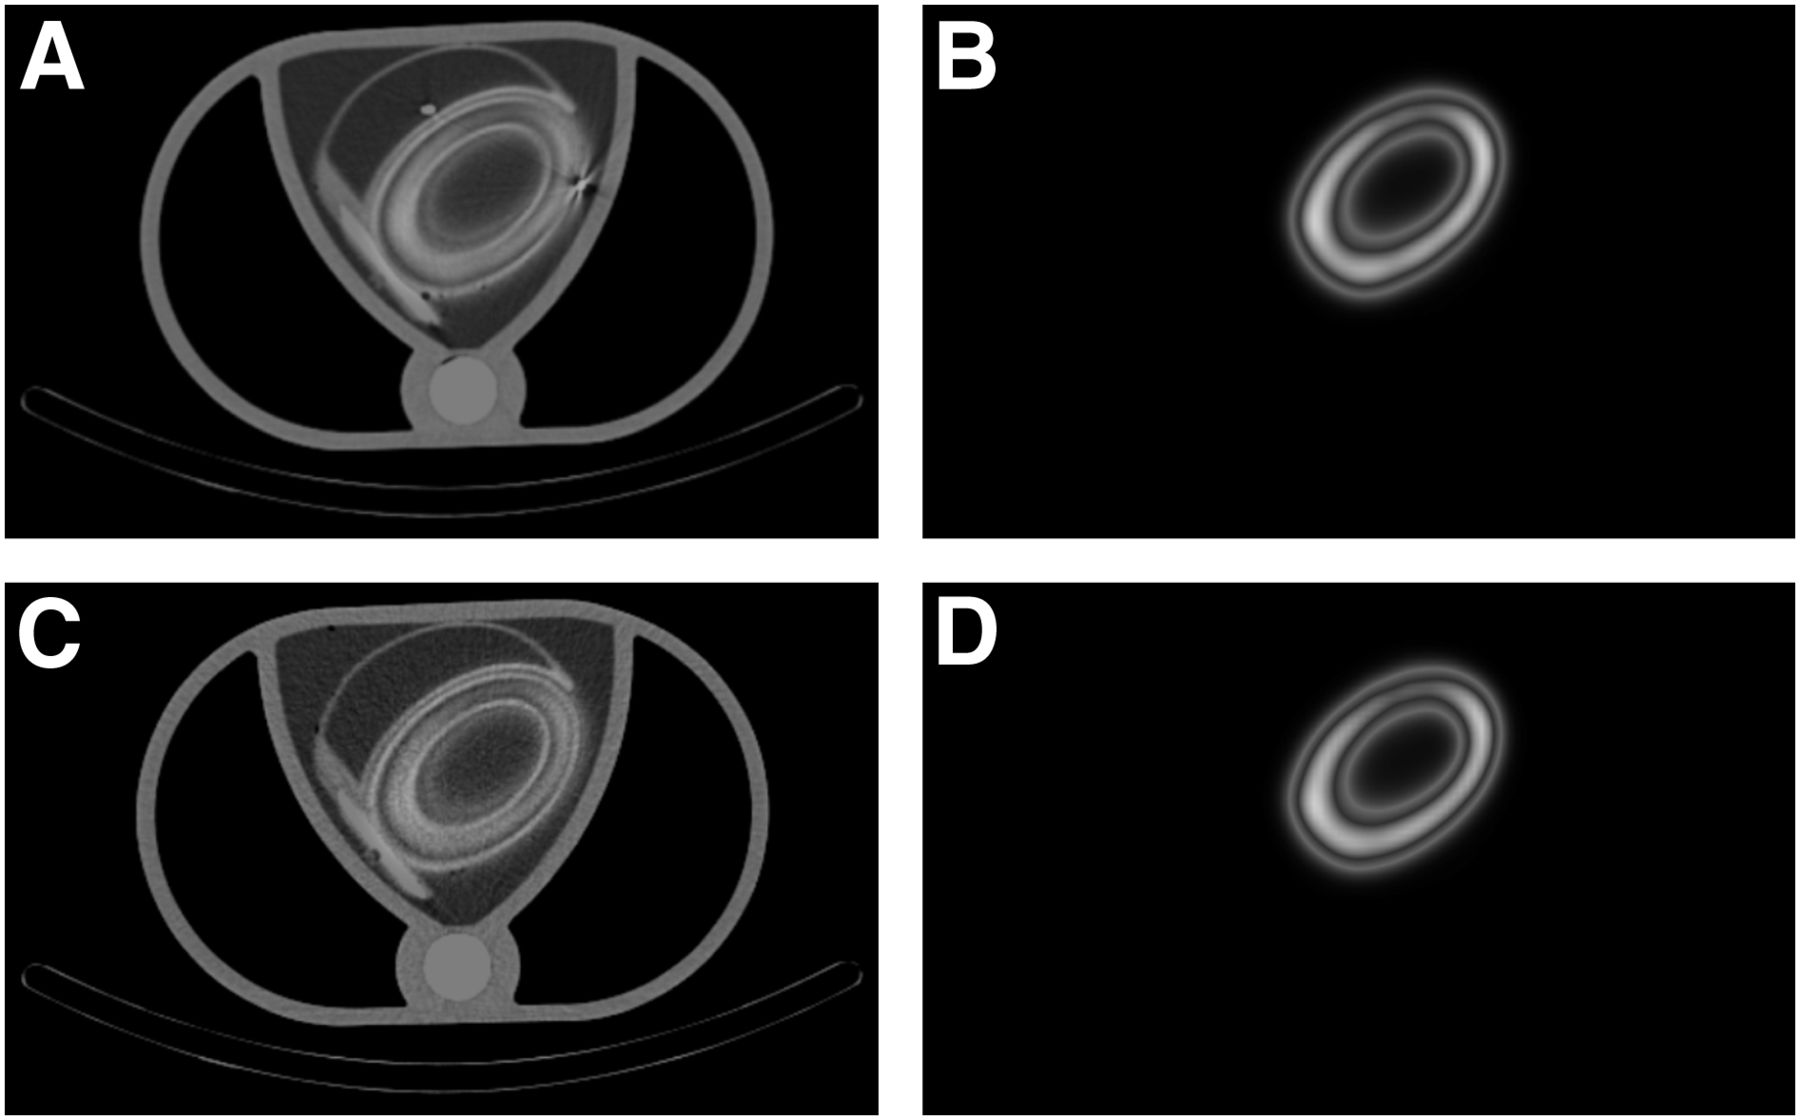
Myocardial perfusion SPECT is important for the medical assessment of cardiac diseases. However, in men, a decrease in counts occurs at the inferior wall because of attenuation by the diaphragm, whereas in women a decrease in counts occurs at the anteroseptal wall because of attenuation by the breasts. A reduction in myocardial SPECT counts due to attenuation creates a false-positive increase in counts and lowers the degree of singularity. If CTAC is used, myocardial SPECT images of the inferior and anteroseptal walls will not be affected by attenuation, and diagnostic accuracy will increase. Besides, attenuation correction confers an advantage for detecting significant abnormal findings in nondiagnostic CT images (11). However, overestimation by SPECT might be possible if patients have pacemaker or ICD leads because PET counts in the presence of ICD leads are overestimated when CTAC is applied. In fact, one report has described overestimation in SPECT images of an artificial hip joint (12). The overestimation is caused by the inability of the attenuation correction algorithm to precisely complement the difference between the energy of SPECT and that of CT. This compensation becomes even more difficult in the presence of metals because they have high atomic numbers. However, the present study did not find a high overestimation for the leads. Pacemaker leads usually comprise a cobalt or nickel conductor coil that connects the main part of the lead to an electrode, and they are usually insulated with polyurethane and silicon rubber. The quality of the material used to construct pacemaker leads corresponding to MR imaging and LV leads is essentially the same. Although the coil structures differ somewhat between the 2 leads, the diameters are quite similar, being 1.7 and 2.3 mm for LV leads and pacemaker leads corresponding to MR imaging, respectively. Thus, the results for the pacemaker and LV leads did not significantly differ in the present study. On the other hand, the diameter of the ICD lead was 2.7 mm and the platinum alloy coil is located near its tip. Therefore, overestimation was higher for the ICD lead than for the other leads but still was only 4%. The leads used here did not cause a significant overestimation of imaging findings; even under conditions where metal artifacts were generated, the overestimation was only 6%. Leads had no influence in the phantom that mimicked the human body. The image of attenuation maps was smoother than the standard CT image, and a metal artifact was not clearly detected. Therefore, the influence on counts was not large when CTAC was applied. We speculate that the diameter of ICD leads is too small to have any influence. The μ map becomes indistinct, and a lead with a small diameter is hard to discriminate. Furthermore, metal artifacts became more ambiguous in μ maps than in CT images (Fig. 6). Thus, pacemaker, LV, and ICD leads did not significantly influence SPECT findings at normal resolution regardless of the application of CTAC. The results obtained at high resolution were similar. Physiologic issues and leads are not the main cause of overestimation, even if accumulation is increased or reduced near a lead in nuclear medicine images. Therefore, CTAC is useful even when a lead is present. We think that the present study clarified the impact of pacemaker, ICD, and LV leads on SPECT with CTAC.

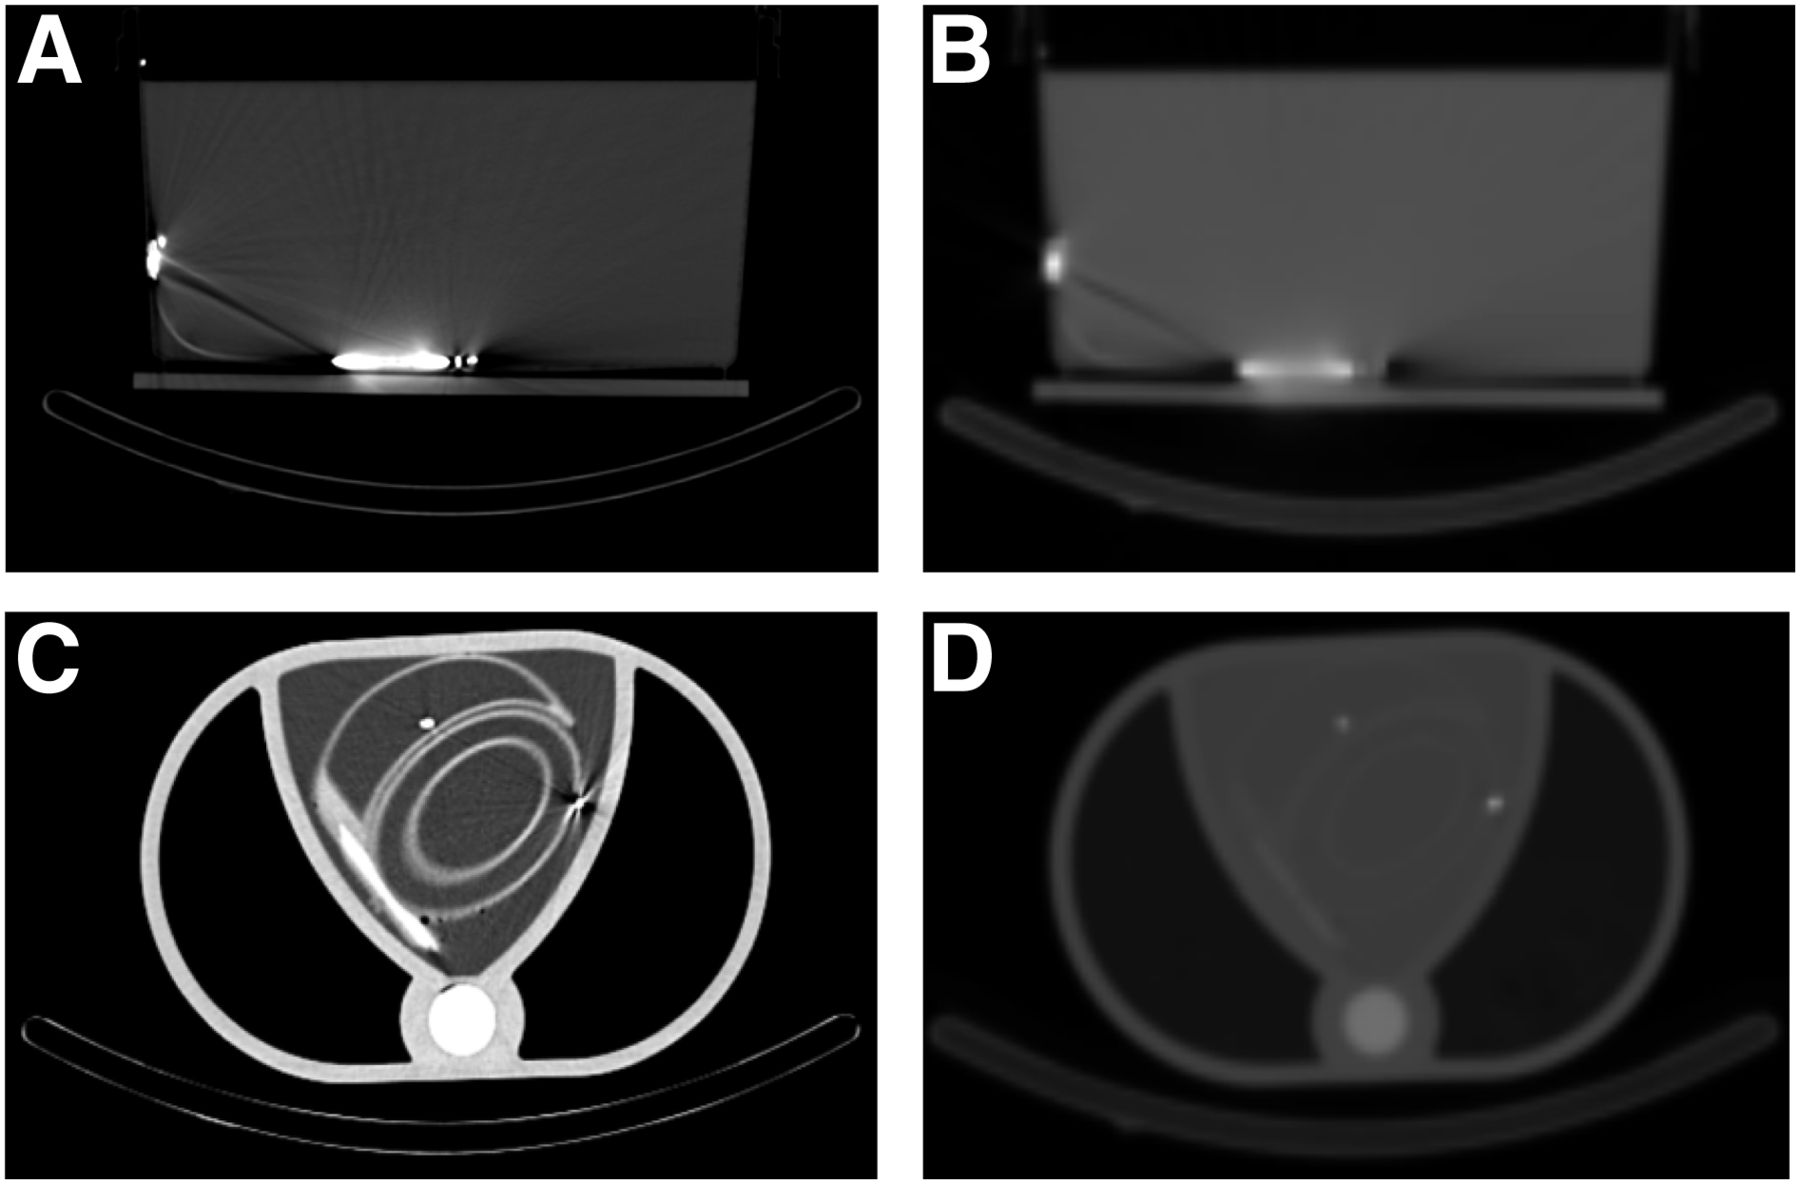
Transaxial views showing metal artifact from ICD lead: CT image of artifact from ICD lead (A), μ map showing artifact from ICD lead (B); CT image of imitation human body (C), and μ map of imitation human body (D). Metal artifact is clear on CT but not on μ map.
CONCLUSION
The presence of metal will result in overestimated CTAC. However, pacemaker, ICD, and LV leads are thin and essentially do not influence CTAC, which should be applied to increase the diagnostic accuracy of nuclear medicine assessments.
DISCLOSURE
No potential conflict of interest relevant to this article was reported.
Acknowledgments
We thank Mizunori Mochiki (Gunma prefectural Cardiovascular Center) and Masamichi Yanagisawa (Nihon Medi-Physics Co., Ltd., Imaging Information Technology Centre) for assistance with this investigation.
Footnotes
Published online Jan. 24, 2014.
REFERENCES
- Received for publication October 10, 2013.
- Accepted for publication November 27, 2013.


Jump to section
Related Articles
Cited By...
- No citing articles found.