


Abstract
Diagnosis of new bone growth in patients with compound tibia fractures or deformities treated using a Taylor spatial frame is difficult with conventional radiography because the frame obstructs the images and creates artifacts. The use of Na18F PET studies may help to eliminate this difficulty. Methods: Patients were positioned on the pallet of a clinical PET/CT scanner and made as comfortable as possible with their legs immobilized. One bed position covering the site of the fracture, including the Taylor spatial frame, was chosen for the study. A topogram was performed, as well as diagnostic and attenuation correction CT. The patients were given 2 MBq of Na18F per kilogram of body weight. A 45-min list-mode acquisition was performed starting at the time of injection, followed by a 5-min static acquisition 60 min after injection. The patients were examined 6 wk after the Taylor spatial frame had been applied and again at 3 mo to assess new bone growth. Results: A list-mode reconstruction sequence of 1 × 1,800 and 1 × 2,700 s, as well as the 5-min static scan, allowed visualization of regional bone turnover. Conclusion: With Na18F PET/CT, it was possible to confirm regional bone turnover as a means of visualizing bone remodeling without the interference of artifacts from the Taylor spatial frame. Furthermore, dynamic list-mode acquisition allowed different sequences to be performed, enabling, for example, visualization of tracer transport from blood to the fracture site.
Conventional 2-dimensional planar radiography with a Taylor spatial frame often obscures much of the fracture (Fig. 1A), leads to errors in correctly aligning the fracture, and may obscure new bone growth.
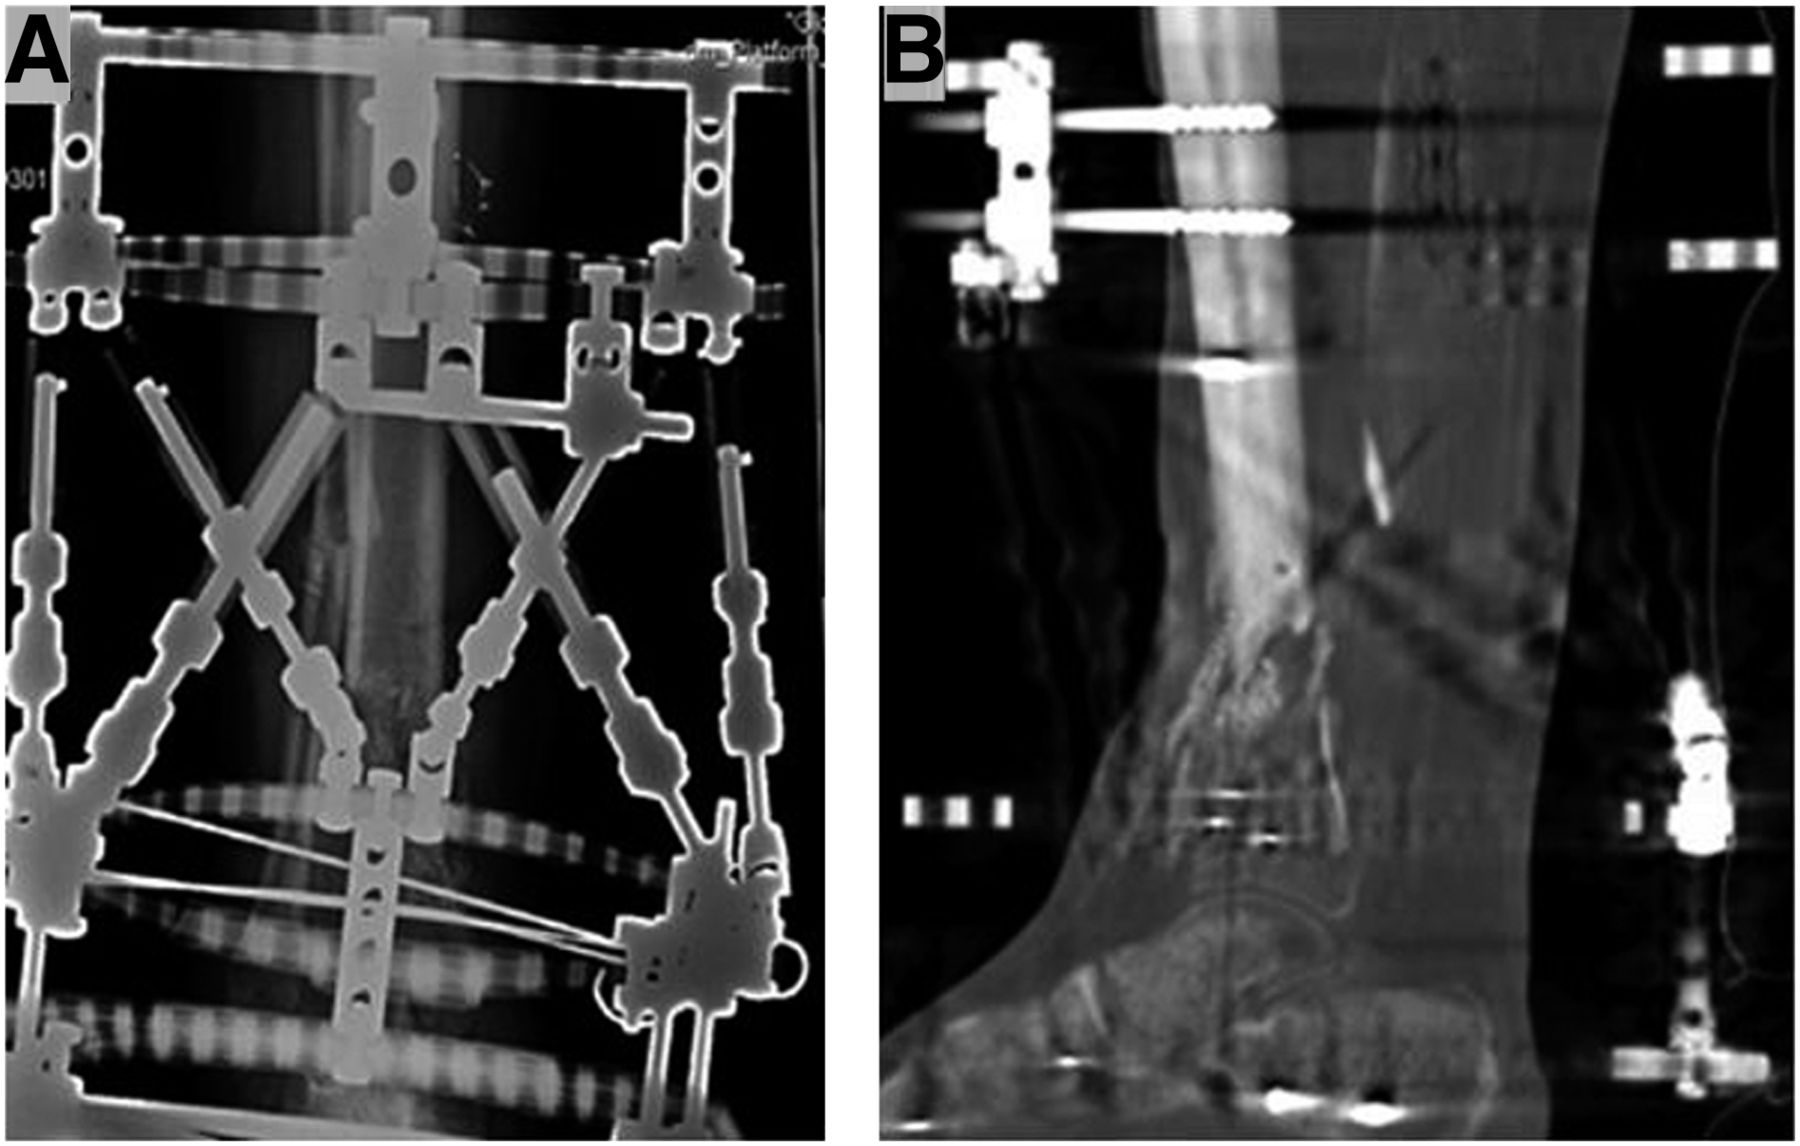
Typical planar radiograph (A) and CT scan (B) of patient with Taylor spatial frame.
Many institutions try to overcome this loss of information by using different radiographic techniques, such as a frame-mounted x-ray guide (1). However, CT (Fig 1B) is the preferred method for imaging compound fractures (2). Assessment using CT greatly improves visualization of the fracture site and bone remodeling (3). Na18F is a well-known bone tracer and has been Food and Drug Administration–approved since 1972. The most common use of Na18F is for metabolic bone disease, but the tracer may also be useful for evaluating bone grafts and new bone growth (4). Nearly all new bone growth results in increased uptake of Na18F. The degree of increased uptake is dependent on factors such as regional blood flow and active bone turnover, though uptake is higher in new bone growth because of the increased availability of binding sites.
The combination of Na18F as a bone tracer with PET/CT scanning may eliminate the problem of metal artifacts and provide better visualization of new bone growth (5). A companion paper describes the clinical results of our study of 9 patients. This study was approved by the Regional Ethics Committee (diarienummer 2012/1049-31/1), and all subjects gave written informed consent.
MATERIALS AND METHODS
Phantom Study
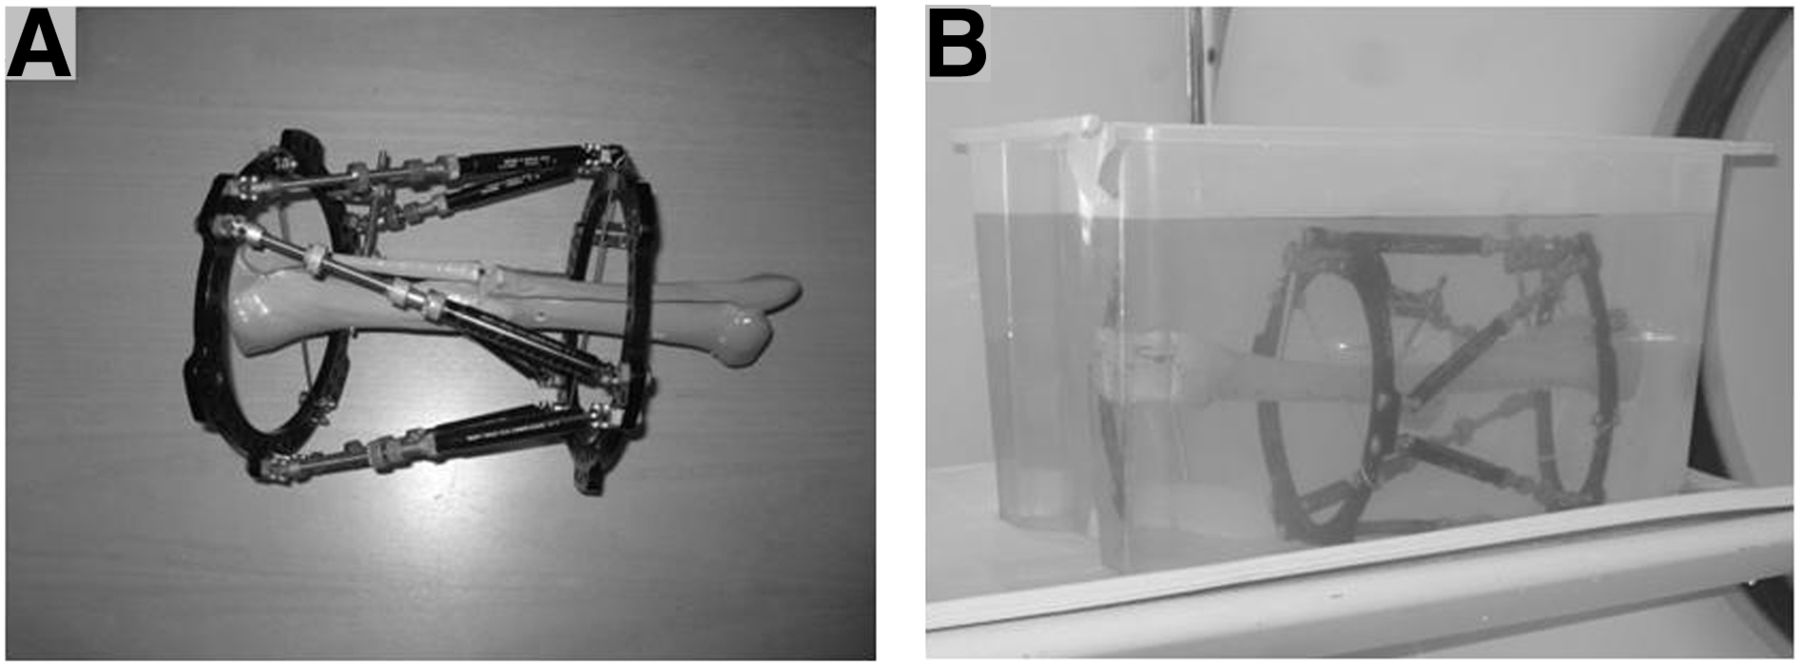
To establish the feasibility of the protocol, we used a phantom consisting of a Taylor spatial frame mounted on a skeletal lower leg (Fig. 2A). This phantom was immersed in a solution of 5 L of water and 217 MBq (5.86 mCi) of Na18F, to simulate the skeletal structure in an attenuating medium (Fig. 2B). A clinical PET/CT scanner (Biograph 64 True Point True V; Siemens Medical Solutions) was used to obtain images. A low-dose CT and static 5-min, 1-bed-position PET acquisition was performed. The images were reconstructed and reformatted with and without the metal artifact reduction algorithm provided by the manufacturer. Images produced without this algorithm showed no artifacts (hot spots) in the phantom (Fig. 3A).

(A) Taylor spatial frame attached to plastic leg. (B) Phantom (in water bath) about to be inserted into PET/CT scanner.
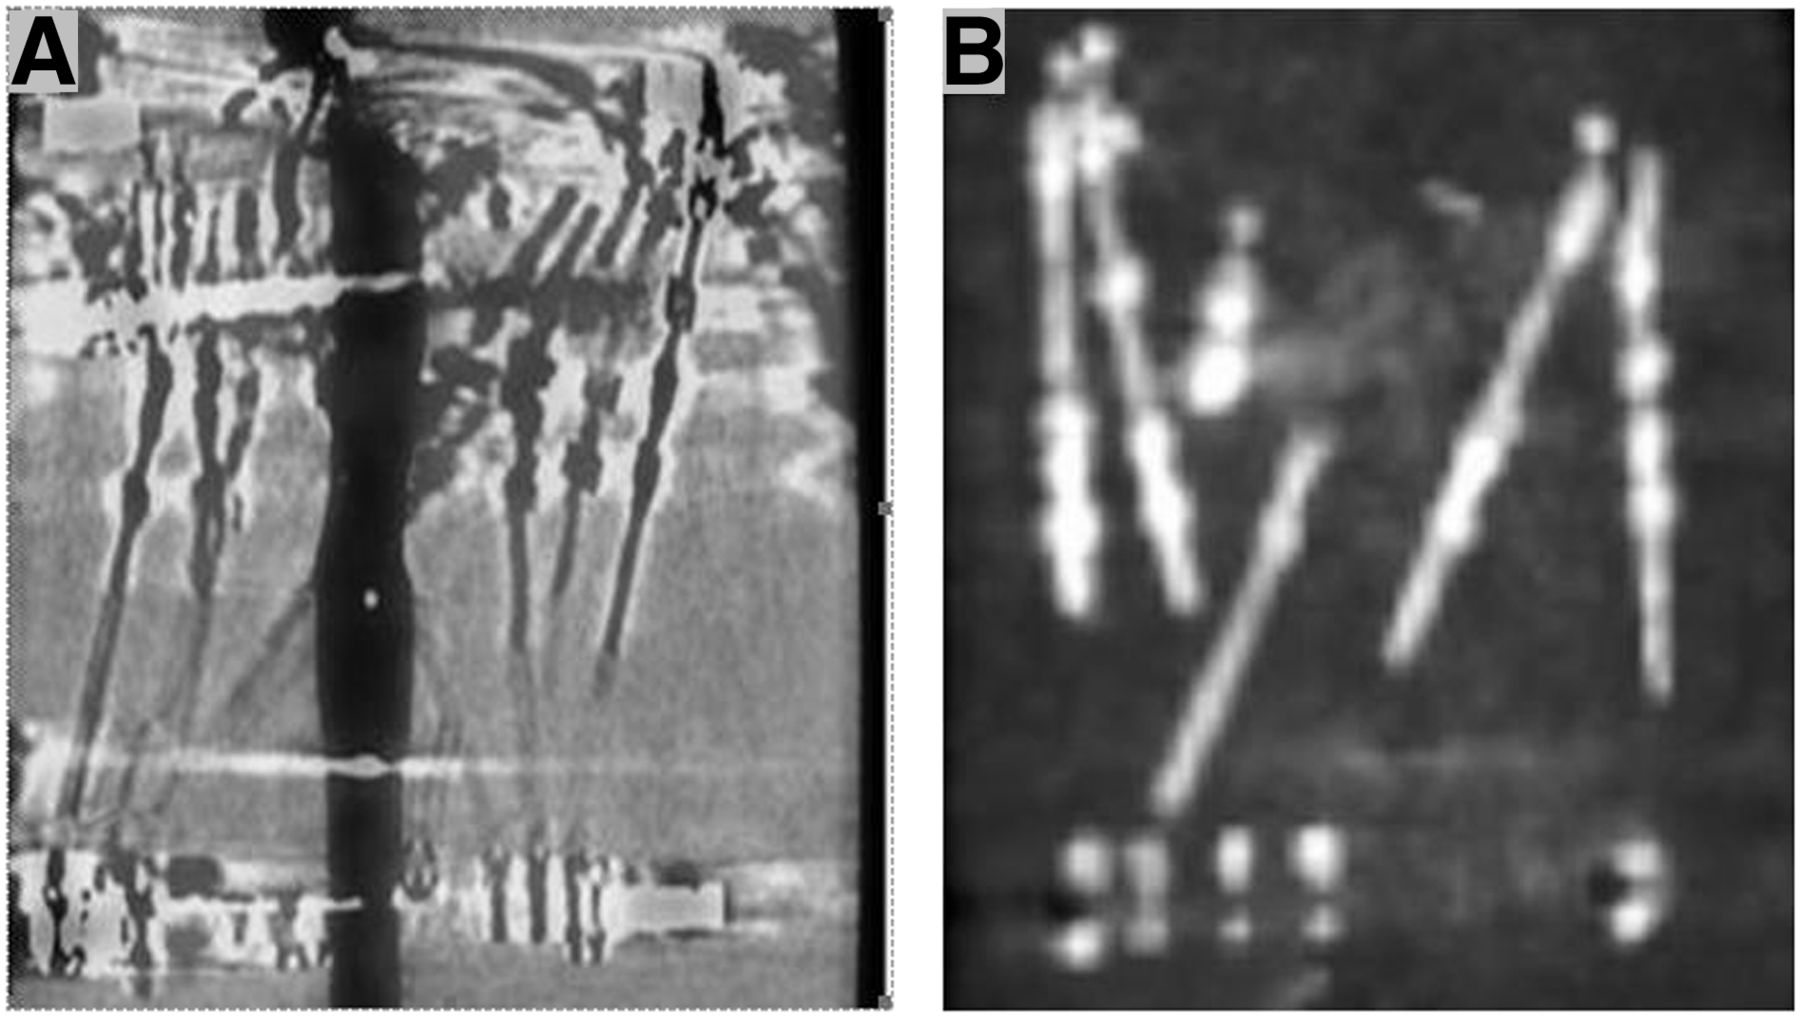
Reconstructed PET/CT scans of phantom: (A) When metal reduction algorithm is not used, no metal artifacts are seen in reconstruction of leg and no uptake of 18F is seen in Taylor spatial frame. (B) When metal reduction algorithm is used, uptake of 18F is seen in metal of Taylor spatial frame.
Patient Studies
Preliminary PET/CT studies were performed on 2 patients (both male, aged 64 and 39 y) to determine the amount of bone activity at a time close to removal of the Taylor spatial frame. The scans of these 2 patients were obtained at 39 and 19 wk after the initial operation, and the frame was removed at 47 and 29 wk (respectively).
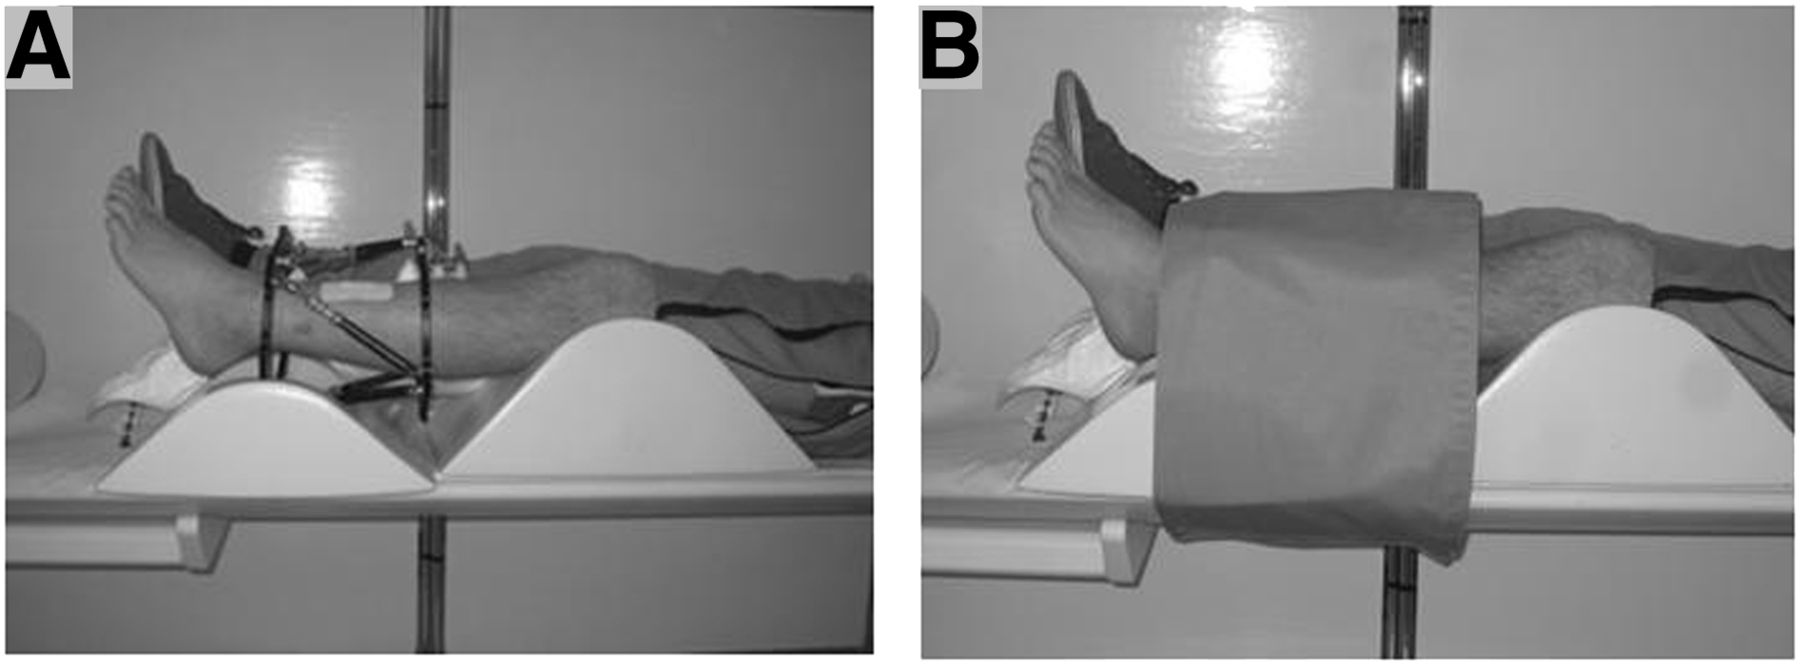
The clinical study included 7 patients (2 female and 5 male) with an average age of 39 y and varying types of fractures, but all outfitted with a Taylor spatial frame. The patients were examined 6 wk and 3 mo after the Taylor spatial frame had been applied, resulting in 14 examinations. The patients were not required to fast or follow any restrictions before the examination. The patients’ medical histories were reviewed, and the height and weight of each patient were recorded. The patients were hydrated with 7 dL of water 30 min before the examination and were asked to empty their bladders before entering the scanning room. A venous catheter was inserted in the arm. The patients were placed on the scanner pallet and made as comfortable as possible, with support under the knees. The affected leg was immobilized (Fig. 4).

Initial (A) and final prescanning (B) positions of patient.
A diagnostic CT scan was obtained of the region of the Taylor spatial frame, and the patients were then positioned in the PET field of view. The patients were injected with 2 MBq (0.054 mCi) of Na18F per kilogram of body weight, and a 10-mL saline flush was administered. The PET list-mode acquisition and administration of the Na18F were started simultaneously.
Image Acquisition and Reconstruction
Each patient underwent a diagnostic CT scan followed by a list-mode acquisition at the site of the fracture and including the Taylor spatial frame. The diagnostic CT was performed with a tube tension of 120 kV, a pitch of 1.0, a slice thickness of 1.2 mm, a rotation speed of 0.5 s, and a current of 50 mAs. This protocol was used for 15 examinations. For the final examination, the protocol was changed to simulate the protocols used by the Radiology Department with the intention of reducing the number of CT examinations of the patient. The new CT protocol used a spiral 64-slice scan; a tube tension of 140 kV, a pitch of 1, a slice thickness of 0.6 mm with a rotation time of 1 s, and a current of 60 mAs.
CT reconstructions using Siemens filters were as follows: a 0.6-mm slice with a 0.6-mm increment using a B70 very sharp bone filter, a B20s smooth abdomen filter, and a B70s very sharp osteo filter. All reconstructions were reformatted in coronal and sagittal slices with a 0.6-mm thickness and a 0.6-mm increment.
A 45-min PET acquisition was performed in list mode, and a static 5-min acquisition was performed 60 min after injection. The static PET acquisition was reconstructed, with and without attenuation correction, using a method (2-dimensional ordered-subset expectation maximization) consisting of 4 iterations and 8 subsets. The image matrix was 168 × 168 with a gaussian filter of 5 mm in full width at half maximum using the Siemens B19 PET very smooth abdomen filter with a 5-mm slice and 3-mm increments.
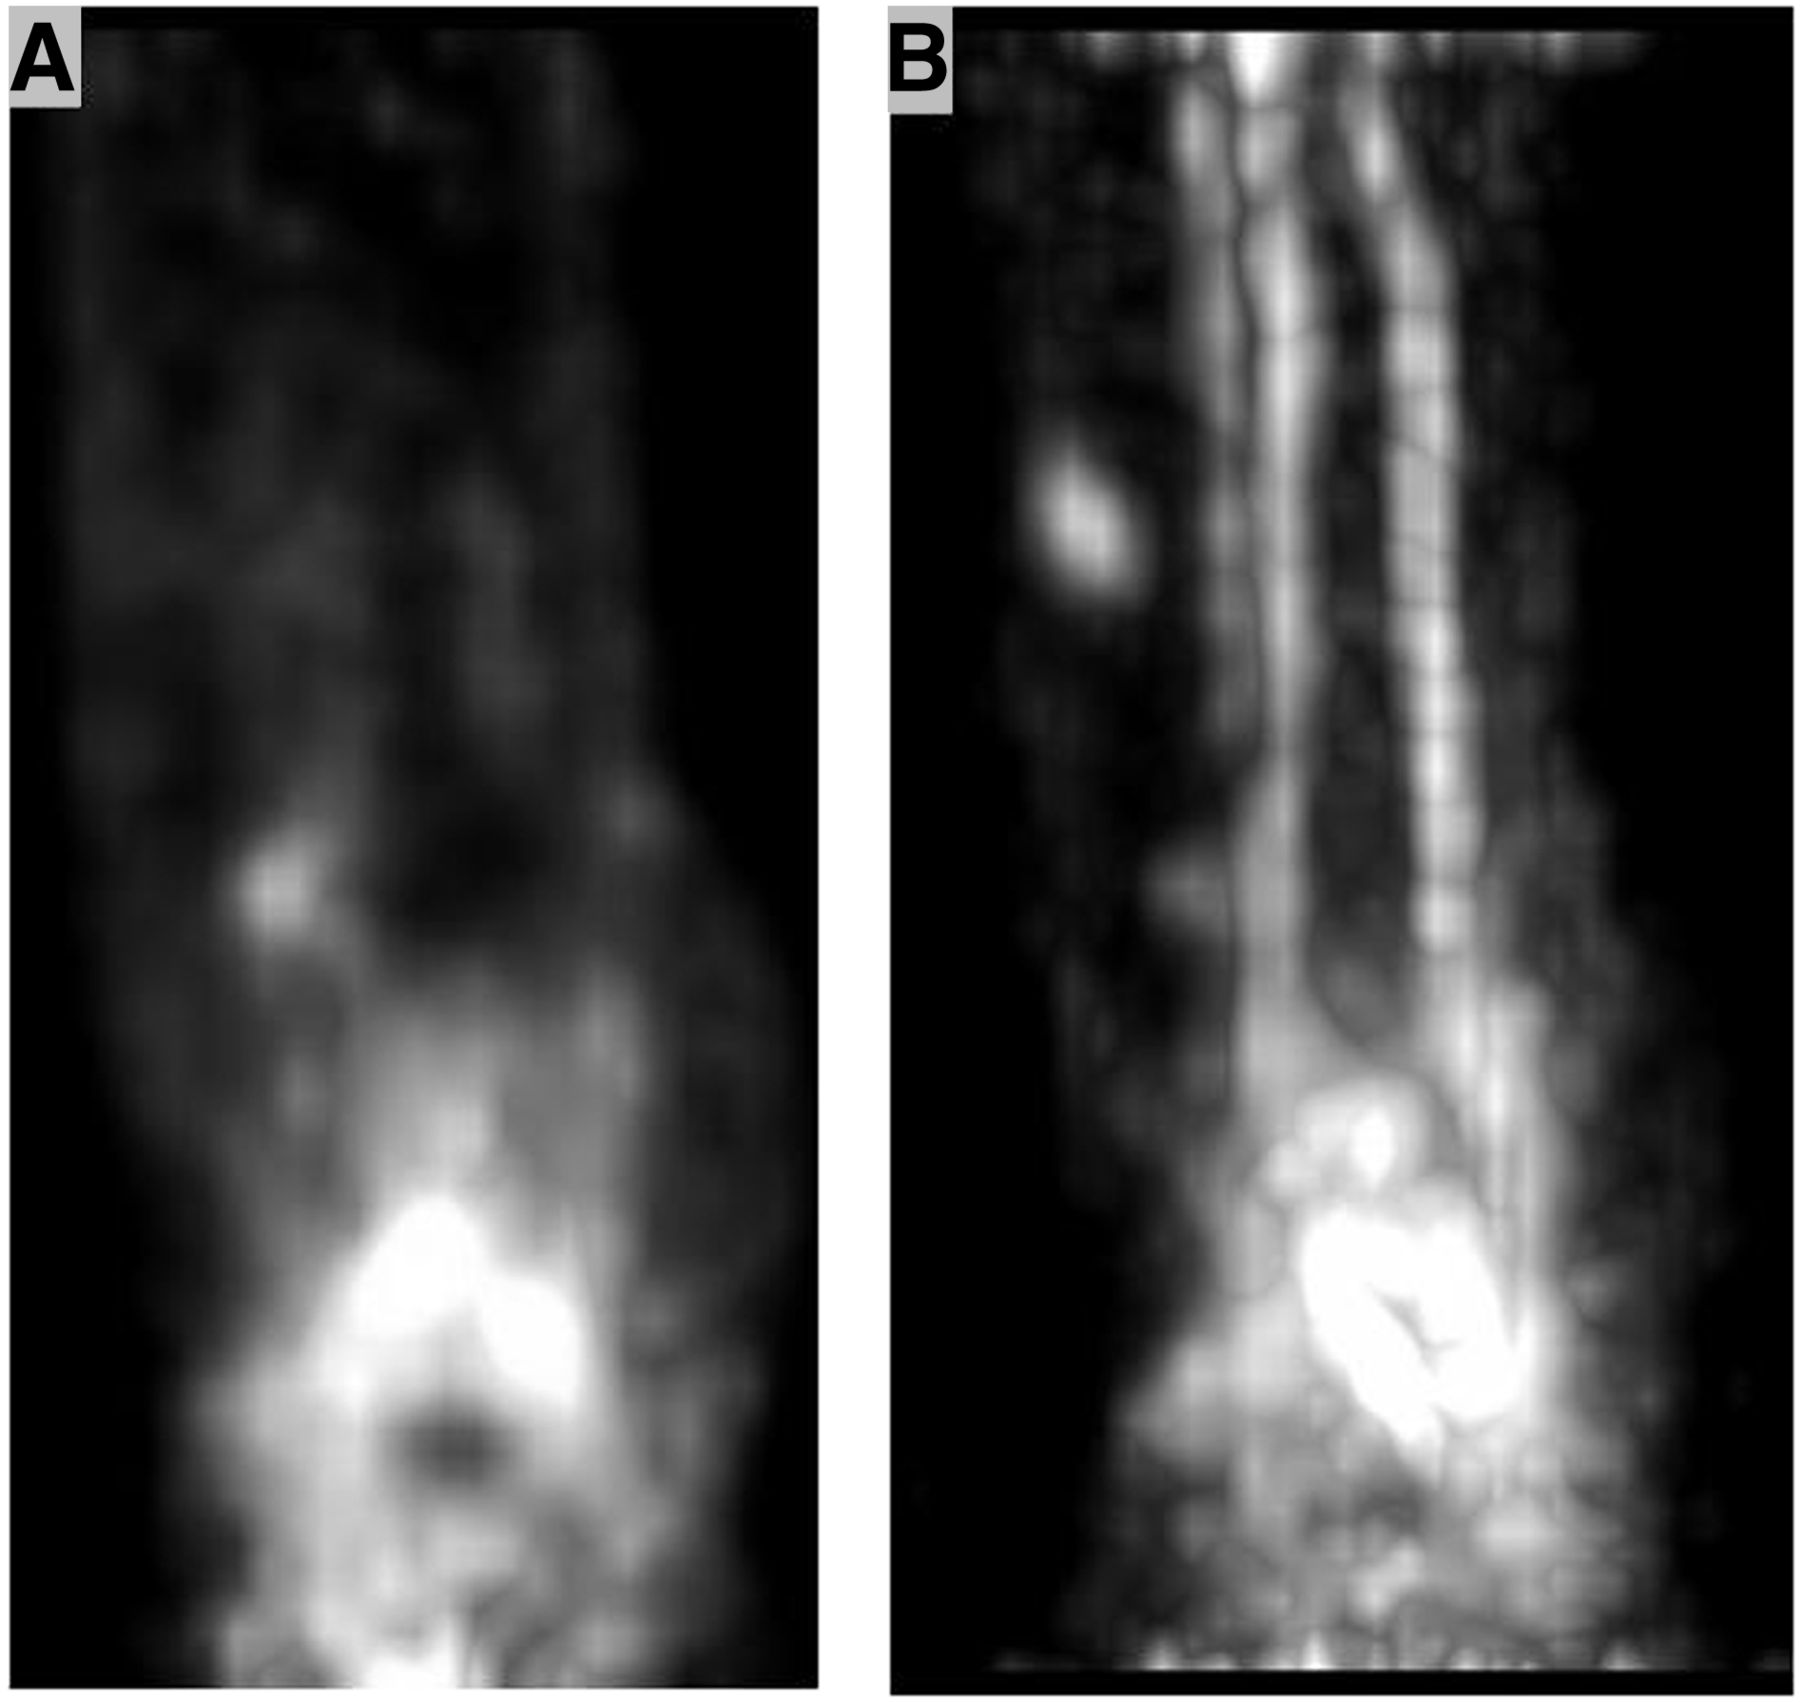
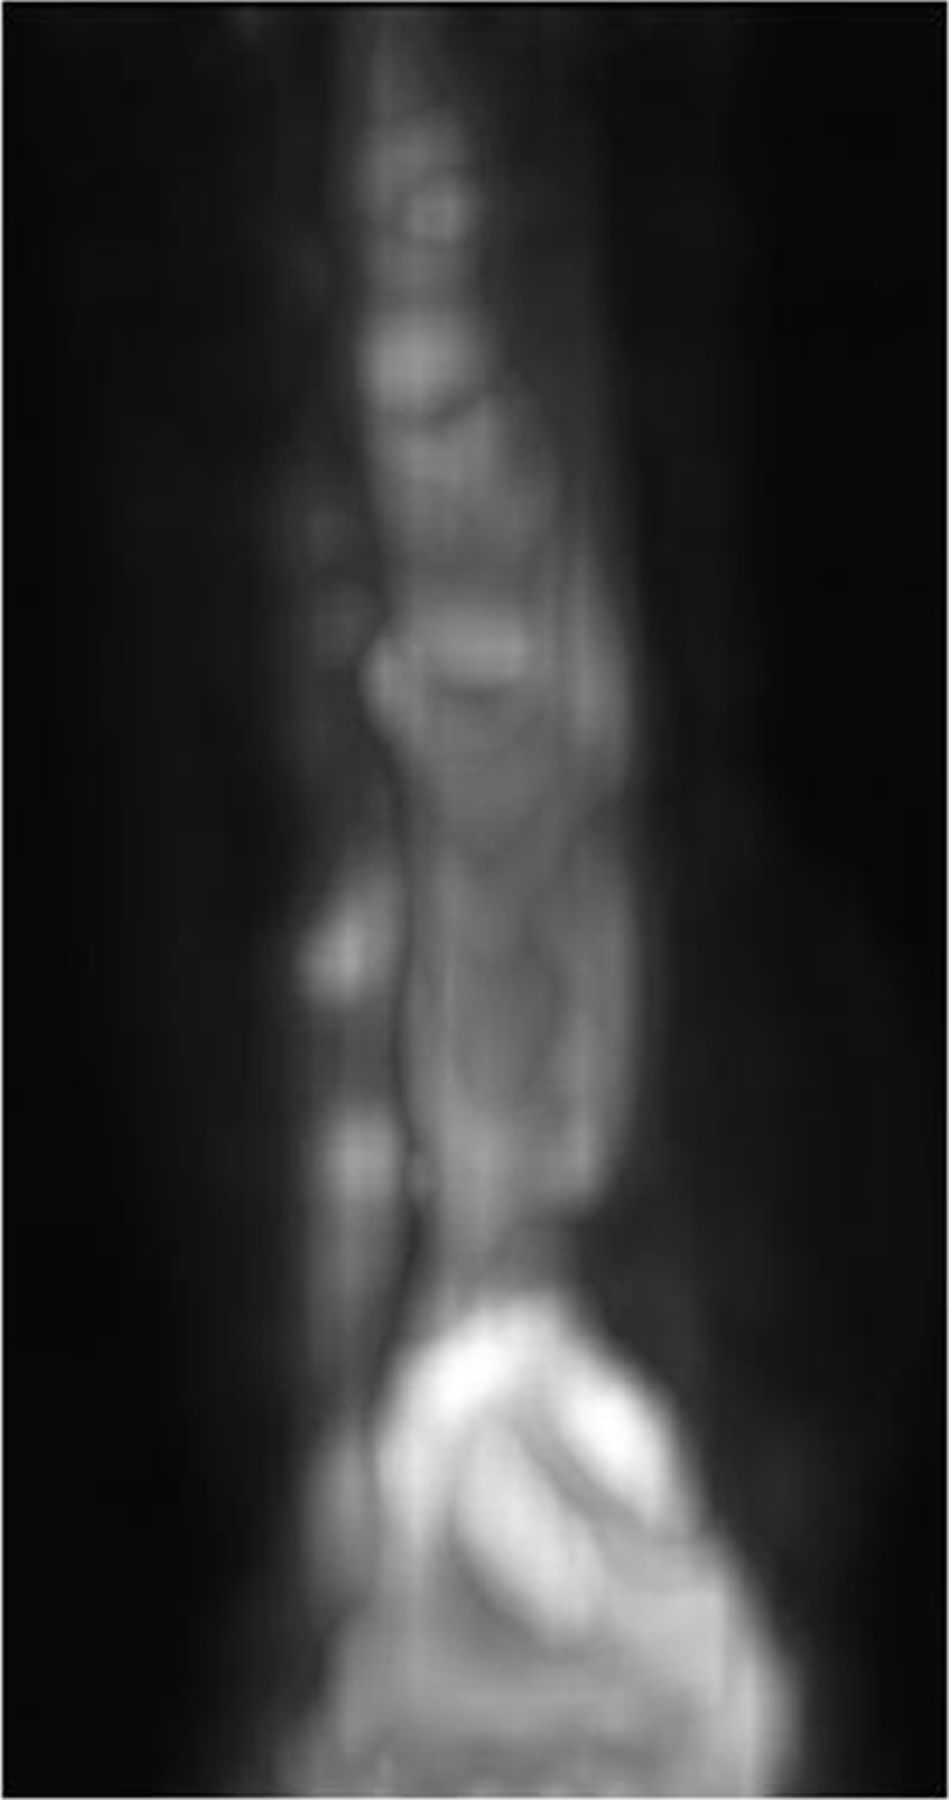
The PET list-mode 45-min acquisition was reconstructed with and without attenuation correction using 2-dimensional ordered-subset expectation maximization with 4 iterations with subsets of 8. The matrix was 168 × 168. The list-mode data were grouped into 4 different frame durations: 5 frames of 1 min each (Fig. 5B); 5 of 3 min each (Fig. 5B); 3 of 5 min each, and 1 of 10 min. Additionally, reconstructions were made at the 30-min and the 45-min time frames, using the same reconstruction parameters. An additional 5-min static PET image was acquired 60 min after injection (Fig. 6).

PET scans reconstructed from list mode with 5 frames of 1 min each (A) and 3 min each (B).

Initial 5-min static scan acquired after 60 min.
In all cases except two, the first CT acquisition was used for attenuation correction of the 5-min static PET scan. In 2 cases there was some patient motion; thus, a second (low-dose) CT scan was obtained for attenuation correction. Fused PET/CT 3-dimensional images (Fig. 7) were reformatted with 5-mm slices and 3-mm increments.

Three-dimensional reconstruction of axial view (A) and coronal view (B) of 5-min static PET scan fused with CT scan.
RESULTS
The phantom study was performed to confirm the validity of the Siemens metal artifact reduction algorithm. Using the reduction algorithm gave false uptake in the Taylor spatial frame (Fig. 3B), whereas not using the algorithm gave no false hot spots. The 30- and 45-min reconstructions from the list-mode acquisition gave optimal time frames for uptake of Na18F. With Na18F PET/CT, the image quality allowed the physician to better visualize new bone remodeling. Though this method has been used on only a few subjects, it may in future be used to determine bone healing and the stability of fractures treated with a Taylor spatial frame.
DISCUSSION
Radiographs including planar and CT imaging are valuable tools for physicians treating fractures. Currently these imaging methods are the standard for evaluating stability, alignment, and new bone growth in patients with fractures. With the application of an external fixator, such as a Taylor spatial frame, some vital information may be obscured by the radiopacity of the metal in the frame. With the combination of PET and CT we are able to visualize the fracture site without interference by the metal struts in the Taylor spatial frame. This method may also replace or reduce the number of CT scans performed to monitor bone healing.
The list-mode 45-min acquisition was performed to determine the best time frame in which to acquire optimal images. The dynamic list-mode acquisition also allowed imaging of tracer transport from blood to the fracture site, giving an indication of new bone turnover. These image postprocessing analyses have yet to be performed. The static 5-min scan taken 60 min after injection gave added information on the uptake of Na18F.
An additional feature of these Na18F PET/CT scans is that they can be performed by the staff while waiting for 18F-FDG uptake of the first patient of the day. The 18F is already being produced by the cyclotron facility as a precursor to their production of 18F-FDG. The fact that satisfactory images can be successfully acquired in less than 1 h means that one Na18F PET/CT scan can be conducted per machine per day with no additional equipment or staff time, thus increasing the effective use of the PET/CT facility.
CONCLUSION
Na18F PET/CT imaging successfully visualized the 3-dimensional spatial distribution of bone remodeling without the negative impact of artifacts from the Taylor spatial frame. The scanning procedure and parameters that have been developed as a result of these initial studies have led to new clinical applications, such as monitoring bone healing and assessing bone status before deciding whether to remove the Taylor spatial frame.
DISCLOSURE
The costs of publication of this article were defrayed in part by the payment of page charges. Therefore, and solely to indicate this fact, this article is hereby marked “advertisement” in accordance with 18 USC section 1734. Financial support was provided by the Department of Nuclear Medicine, Karolinska University Hospital, Solna, Sweden. No other potential conflict of interest relevant to this article was reported. This work was presented at the annual meeting of the Society of Nuclear Medicine, Vancouver, Canada, June 2013.
Footnotes
Published online Jan. 16, 2014.
REFERENCES
- Received for publication September 24, 2013.
- Accepted for publication November 8, 2013.


Jump to section
Related Articles
Cited By...
- No citing articles found.