


Abstract
The significance of left ventricular (LV) dyssynchrony for the prediction of response to cardiac resynchronization therapy (CRT) has been demonstrated. Parameters reflecting LV dyssynchrony (phase SD, histogram bandwidth) can be derived from gated myocardial perfusion SPECT (GMPS) using phase analysis. The feasibility of LV dyssynchrony assessment with phase analysis on GMPS using Quantitative Gated SPECT (QGS) software has not been demonstrated in patients undergoing CRT. The aim of the present study was to validate the QGS algorithm for phase analysis on GMPS in a direct comparison with echocardiography using tissue Doppler imaging (TDI) for LV dyssynchrony assessment. Also, prediction of response to CRT using GMPS and phase analysis was evaluated. Methods: Patients (n = 40) with severe heart failure (New York Heart Association class III–IV), an LV ejection fraction of no more than 35%, and a QRS complex greater than or equal to 120 ms were evaluated for LV dyssynchrony using GMPS and echocardiography with TDI. At baseline and after 6 mo of CRT, clinical status, LV volumes, and LV ejection fraction were evaluated. Patients with functional improvement were classified as CRT responders. Results: Both histogram bandwidth (r = 0.69, r2 = 0.48, SEE = 25.4, P < 0.01) and phase SD (r = 0.65, r2 = 0.42, SEE = 26.8, P < 0.01) derived from GMPS correlated significantly with TDI for assessment of LV dyssynchrony. At baseline, CRT responders showed a significantly larger histogram bandwidth (94° ± 23° vs. 68° ± 21°, P < 0.01) and a larger phase SD (26° ± 6° vs. 18° ± 5°, P < 0.01) than did nonresponders. Receiver-operating-characteristic curve analysis identified an optimal cutoff value of 72.5° for histogram bandwidth to predict CRT response, yielding a sensitivity of 83% and a specificity of 81%. For phase SD, sensitivity and specificity similar to those for histogram bandwidth were obtained at a cutoff value of 19.6°. Conclusion: QGS phase analysis on GMPS correlated significantly with TDI for the assessment of LV dyssynchrony. Moreover, a high accuracy for prediction of response to CRT was obtained using either histogram bandwidth or phase SD.
Cardiac resynchronization therapy (CRT) has become an established therapeutic option for patients with drug-refractory heart failure. Thus far, several clinical trials have demonstrated the beneficial effect of CRT on symptoms, quality-of-life (QoL) score, and exercise capacity (1,2). In addition, CRT improved left ventricular ejection fraction (LVEF), reduced severity of mitral regurgitation, and decreased left ventricular (LV) volumes (reverse remodeling) (1,2). Moreover, CRT resulted in a superior survival rate, with a reduction in heart failure hospitalization rate (3,4).
Although CRT provides considerable benefit, one third of the patients meeting the current selection criteria do not respond to this form of therapy (5–8), and attention has shifted toward improved patient selection for CRT (9,10). Particularly, observational trials have shown the significance of LV dyssynchrony for the prediction of response to CRT (6–8). LV dyssynchrony can be detected using different imaging modalities, including echocardiography with tissue Doppler imaging (TDI) (6–8) or strain (rate) imaging (11), MRI (12), and nuclear imaging with single photon emission computed tomography (SPECT) (13–18). In particular, phase analysis on gated myocardial perfusion SPECT (GMPS) has been evaluated recently for the assessment of LV dyssynchrony (14–18).
Recently, the Quantitative Gated SPECT (QGS) algorithm (Cedars-Sinai) has been expanded to provide quantitative parameters, in addition to the previously reported functional parameters, for the assessment of LV dyssynchrony (14,18). With this algorithm, quantification of LV dyssynchrony is based on phase calculations for each LV surface-sampling point. The aim of the current study was to further validate the QGS-modified algorithm for phase analysis on GMPS in a direct comparison with echocardiography using TDI for the assessment of LV dyssynchrony. Moreover, outcome after 6 mo of CRT was evaluated and related to baseline LV dyssynchrony on GMPS.
MATERIALS AND METHODS
Study Population and Protocol
The study population consisted of 40 consecutive drug-refractory heart failure patients who were scheduled for implantation of a CRT device. Eligibility for CRT was based on advanced heart failure (New York Heart Association [NYHA] functional class III–IV), depressed systolic LV function (LVEF ≤ 35%), prolonged QRS duration (≥120 ms), and sinus rhythm. Patients with decompensated heart failure, a recent myocardial infarction (<3 mo), or a previously implanted pacemaker were excluded.
Before CRT implantation, all patients underwent evaluation of clinical status, GMPS with 99mTc-tetrofosmin, and 2-dimensional (2D) echocardiography with TDI as part of the clinical assessment to determine therapeutic options.
The clinical status of the patient was assessed on the basis of NYHA functional class, exercise capacity (6-min-walk test), and QoL score (using the Minnesota QoL Questionnaire) (19).
Six months after CRT implantation, assessment of clinical status and 2D echocardiography with TDI were repeated. Patients with an improvement of 1 grade or more in NYHA class were classified as responders to CRT. Patients without improvement in NYHA class were considered nonresponders; patients who died of progressive heart failure were also considered nonresponders.
GMPS
Data Acquisition.
Resting electrocardiogram-gated GMPS with 99mTc-tetrofosmin (500 MBq, injected at rest) was performed with a triple-head SPECT camera system (GCA 9300/HG; Toshiba Corp.). High-resolution, low-energy collimators were used, and a 20% window was centered around the 140-keV energy peak of 99mTc-tetrofosmin. A total of 90 projections (step-and-shoot method, 35 s/projection; 64 × 64 matrix; total imaging time, 23 min) over a 360° circular orbit were obtained; data acquisition involved 16 frames per cardiac cycle. Data were reformatted into gated short-axis images by reconstruction with filtered backprojection and reorientation. No attenuation correction was used. Data were displayed in polar map format and analyzed using a 17-segment model (20). Segments with a perfusion defect were defined as those having less than 50% tracer uptake.
Phase Calculations.
These reconstructed images were analyzed by a modified version of the QGS algorithm (21) that provides quantitative parameters, in addition to previously described functional parameters, for the assessment of LV dyssynchrony (14). QGS operates by first computing a mid-myocardial LV surface. The algorithm then computes endo- and epicardial surfaces using count profile and thickening information derived from myocardial mass conservation combined with count increases caused by partial-volume effects. All surfaces are generated as 2D meshes in an ellipsoidal coordinate system, with a fixed number of latitudinal and longitudinal samples (21). The current version of QGS uses 36 longitudinal and 28 latitudinal samples, leading to a maximum of 1,008 sampling points (usually fewer because of surface truncation by the valve plane). Subsequent phase calculations are performed using regional maximal counts obtained by searching between the endocardial and the epicardial surfaces, normally to the mid-myocardial surface, for each surface-sampling point. A unidimensional array is created for each spatial sampling point containing the image counts at each interval. This array represents a time-varying, periodic function to which a cosine curve can be fitted. For this analysis, the constant component can be ignored; therefore, this process is equivalent to reducing the periodic function to its first Fourier harmonic, characterized by an amplitude and phase angle. Once the phase angle has been calculated for each mid-myocardial surface point, a 2D median filter is applied to eliminate spurious variations. The window size of the filter (9 longitudinal samples of 36, 7 latitudinal samples of 28) was selected empirically. Because phase measurements are essentially ill-defined for signals that exhibit low temporal variations (22), 5% of the samples for which the amplitude is lowest were eliminated.
Dyssynchrony Parameters.
Once phase information has been calculated for all sampling points, global and regional dyssynchrony measures can be computed. For this study, a histogram was constructed from the phase values for the entire left ventricle, and phase SD and bandwidth were calculated and examined as the global dyssynchrony measures. Phase SD was calculated in the usual manner. Bandwidth was calculated to include 95% of histogram elements as previously reported by Chen et al. (15).
Timing values can be expressed in milliseconds (ms), as angles in degrees (0°−360°), or as a percentage of the average duration of the cardiac cycle (0%−100%); the latter 2 values are equivalent. Although timing values expressed in milliseconds have been considered more clinically relevant with echocardiography, they are also directly dependent on the heart rate, potentially rendering the comparison of studies acquired with different heart rates problematic (23). Hence, for this study all timing values are expressed in degrees.
2D Echocardiography
Transthoracic resting 2D echocardiography was performed with a commercially available system (Vivid Seven; General Electric-Vingmed), with the patient placed in a left lateral decubitus position. A 3.5-MHz transducer was used to obtain images at a depth of 16 cm in the parasternal and apical views (standard long- and short-axis, 2- and 4-chamber images). From apical 2- and 4-chamber images, LV end-systolic (LVESV) and LV end-diastolic (LVEDV) volumes and LVEF were calculated using the biplane Simpson's approach (24). In addition, TDI was performed to assess LV dyssynchrony. For TDI (triggered to the QRS complex), color Doppler frame rates exceeded 80 frames/s, and pulse repetition frequencies varied between 500 Hz and 1 kHz, yielding aliasing velocities between 16 cm/s and 32 cm/s. Tissue Doppler images and conventional echo images were saved in cine-loop format and analyzed by 2 experienced observers unaware of the GMPS and clinical patient data. All analyses were performed using commercially available software (Echopac 6.0.1; General Electric-Vingmed). To determine LV dyssynchrony, the sample volume was placed in the basal portions of the septum and lateral wall; peak systolic velocities and time-to-peak systolic velocities were obtained, and the delay in peak systolic velocity between the septum and the lateral wall was calculated as an indicator of LV dyssynchrony (25). Reliable tissue Doppler curves for the assessment of septal-to-lateral delay were obtained in 39 patients.
The peak systolic velocity analysis was limited to the LV ejection phase (marked by the opening and closing of the aortic valve). The inter- and intraobserver agreements for assessment of LV dyssynchrony were 90% and 96%, respectively (26). Substantial LV dyssynchrony on TDI was defined as a delay in peak systolic velocity greater than or equal to 65 ms between the basal septum and the lateral wall (7).
CRT Implantation
The LV pacing lead was inserted transvenously via the subclavian route as reported previously (25). A coronary sinus venogram was obtained during occlusion of the coronary sinus using a balloon catheter. The LV pacing lead was inserted into the coronary sinus with an 8-French guiding catheter and positioned as far as possible in the venous system, preferably in the posterolateral vein. The right atrial and right ventricular leads were positioned conventionally. For each patient, the atrioventricular interval was adjusted to maximize the mitral inflow duration using pulsed-wave Doppler echocardiography. No adjustments were made to the V-V interval during the first 6 mo of CRT. The CRT-device and LV-lead implantations were successful in all patients, and there were no major complications. All patients received a CRT-D device (Contak Renewal [Guidant]; InSync III, InSync Marquis, or InSync Sentry [Medtronic Inc.]; Atlas HF [St. Jude Medical]), and 4 types of pacemaker leads were used (Acuity 4554 or Easytrak 4517–4524 [Guidant]; Attain 4193–4194 [Medtronic]; Quicksite 1056T [St. Jude Medical]).
Statistical Analysis
Continuous data are expressed as mean ± SD, and categoric data are presented as percentages. When appropriate, the 2-tailed paired or unpaired Student t test and the χ2 test were used for numeric or categoric data.
The relationship between histogram bandwidth and phase SD derived from GMPS and LV dyssynchrony derived from TDI was evaluated by Pearson correlation analysis. Next, univariate and multivariate analyses were performed to determine predictors of response to CRT. Receiver-operating-characteristic (ROC) curves were analyzed to determine the optimal cutoff values of histogram bandwidth and phase SD to predict response to CRT. The highest sum of sensitivity and specificity was considered as the optimal cutoff value for the prediction of response to CRT.
For all analyses, a P value of less than 0.05 was considered statistically significant.
RESULTS
Study Population
Baseline characteristics of the 40 patients (32 men; mean age, 63 ± 8 y) are summarized in Table 1. The etiology of heart failure was ischemic cardiomyopathy in 70% of patients and idiopathic dilated cardiomyopathy in 30%. Medication consisted of diuretics (90% of patients), angiotensin-converting enzyme inhibitors (90% of patients), and β-blockers (75% of patients) in maximum tolerated dosages. Before CRT implantation, the mean NYHA functional class was 3.1 ± 0.4 and the mean QoL score was 38 ± 19. On the surface electrocardiogram, the mean QRS interval was 156 ± 34 ms, and the 6-min-walk distance was 323 ± 96 m. On 2D echocardiography, the mean LVESV was 193 ± 79 mL, with a mean LVEDV of 252 ± 84 mL and a mean LVEF of 25% ± 8%. Mean heart rate during GMPS was 68.6 ± 12.9 beats/min, and the mean heart rate during TDI was 68.5 ± 13.2 beats/min (P = not significant). The mean number of cardiac segments with a perfusion defect was 6 ± 3.
Baseline Characteristics of Study Population (n = 40)
LV Dyssynchrony: GMPS Versus TDI
Phase analysis on GMPS yielded a mean histogram bandwidth of 84° ± 26° (range, 40°−152°) and a mean phase SD of 23° ± 7° (range, 12°−41°). On TDI, the mean LV dyssynchrony was 53 ± 35 ms (range, 0–130 ms). Pearson correlation showed a significant correlation between LV dyssynchrony on TDI and histogram bandwidth on GMPS (r = 0.69, r2 = 0.48, SEE = 25.4, n = 39, P < 0.01, Fig. 1A). Also, a significant correlation between LV dyssynchrony on TDI and phase SD on GMPS was demonstrated (r = 0.65, r2 = 0.42, SEE = 26.8, n = 39, P < 0.01, Fig. 1B). Finally, a good correlation between histogram bandwidth and phase SD was observed (r = 0.95, r2 = 0.91, SEE = 8.0, P < 0.01).
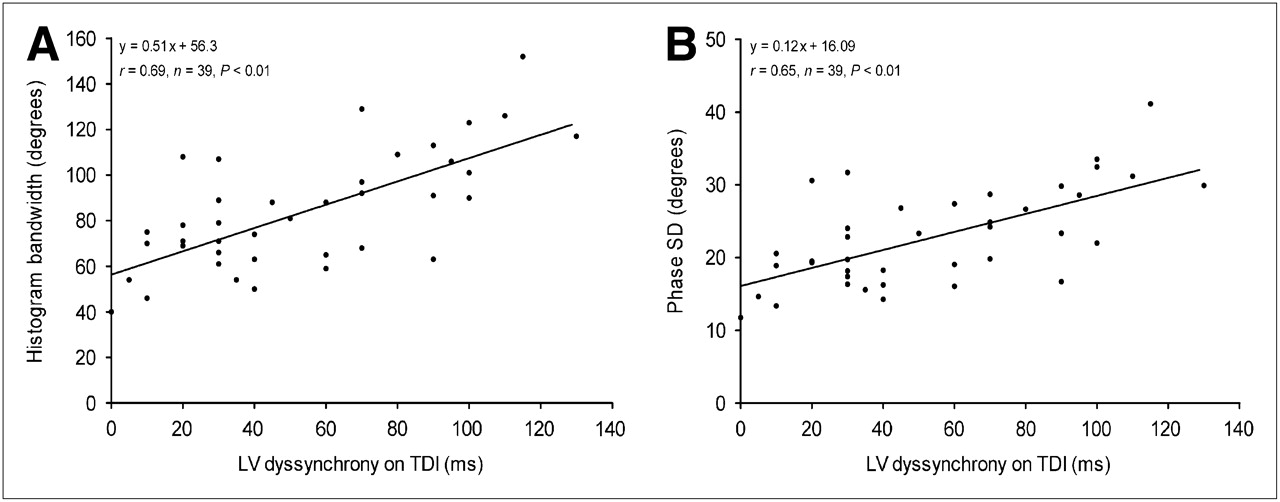
Agreement between LV dyssynchrony on TDI and histogram bandwidth (A) or phase SD (B) derived from GMPS. Significant correlation between LV dyssynchrony on TDI and histogram bandwidth or phase SD as assessed with GMPS was observed.
Patients with LV dyssynchrony greater than or equal to 65 ms on TDI (indicating substantial LV dyssynchrony) had significantly larger histogram bandwidth and phase SD than did patients with LV dyssynchrony below 65 ms on TDI (Fig. 2).
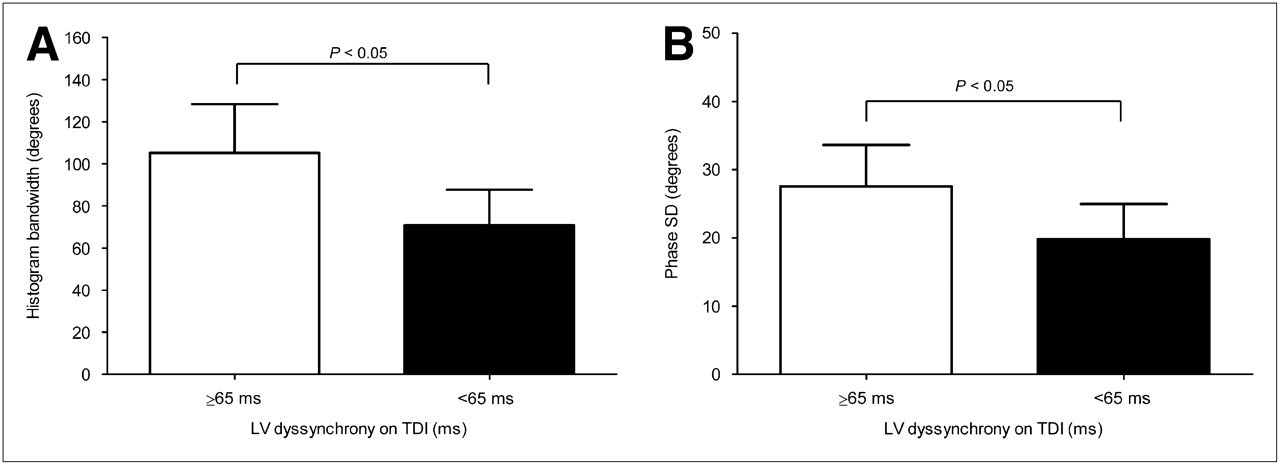
(A) Histogram bandwidth was significantly larger in patients with substantial LV dyssynchrony on TDI (defined as mechanical delay between basal septum and lateral wall ≥ 65 ms) than that in patients without LV dyssynchrony on TDI (delay < 65 ms) (105 ± 23 vs. 71 ± 17, P < 0.05). (B) Phase SD was significantly larger in patients with substantial LV dyssynchrony on TDI (defined as mechanical delay between basal septum and lateral wall ≥ 65 ms) than that in patients without LV dyssynchrony on TDI (delay < 65 ms) (28 ± 6 vs. 20 ± 5, P < 0.05).
Clinical Responders and Nonresponders
At the 6-mo follow-up, 24 (60%) patients showed an improvement of 1 or more grades in NYHA functional class and were considered responders to CRT. Among the 16 (40%) nonresponders, 5 patients died within 6 mo of CRT because of progressive heart failure.
In Table 2, baseline clinical and imaging variables for responders and nonresponders are summarized. Responders showed a significantly longer 6-min-walk distance and larger LVEDV. Furthermore, responders had significantly more LV dyssynchrony on TDI (Fig. 3).

Extent of LV dyssynchrony on TDI at baseline was significantly larger in responders to CRT than that in nonresponders to CRT (62 ± 37 vs. 40 ± 26, P < 0.05).
Baseline Characteristics of Clinical Responders and Nonresponders
For the GMPS data, responders showed significantly larger histogram bandwidth (94° ± 23° vs. 68° ± 21°, P < 0.01) and phase SD (26° ± 6° vs. 18° ± 5°, P < 0.01) than did nonresponders. Responders to CRT showed a significantly lower number of cardiac segments with perfusion defects than did nonresponders to CRT (5 ± 2 vs. 8 ± 2, P < 0.01). Examples of GMPS data in patients with and without response to CRT are shown in Figure 4.

(A) Example of a patient without LV dyssynchrony on GMPS. Synchronous contraction pattern is reflected by homogeneous phase angle distribution of polar map (left) and narrow highly peaked histogram (right). At 6-mo follow-up, no improvement in NYHA functional class was observed and LVEF remained unchanged (32% at baseline vs. 33% at 6-mo follow-up). (B) Example of a patient with extensive LV dyssynchrony on GMPS. LV dyssynchrony is indicated by heterogeneous phase angle distribution of polar map (left) and wide histogram (right). At 6-mo follow-up, NYHA functional class improved from 3 to 2, with increase in LVEF from 21% to 33%.
Baseline and 6-Mo Follow-up Data
At the 6-mo follow-up, responders showed a significant improvement in NYHA functional class, QoL score, and 6-min-walk distance, whereas nonresponders did not show significant improvement in any of the clinical parameters (Table 3). Furthermore, at the 6-mo follow-up only responders demonstrated a significant decrease in LVEDV and LVESV and a significant increase in LVEF.
Baseline and 6-Month Follow-up Characteristics: Responders Versus Nonresponders
Univariate analysis was performed on clinical, echocardiographic, and GMPS variables and demonstrated that 6-min-walk distance, LVEDV, and LV dyssynchrony on TDI were predictors of response to CRT at the 6-mo follow-up. In addition, histogram bandwidth and phase SD were predictive of CRT response at the 6-mo follow-up. Multivariate analysis showed that 6-min-walk distance (P = 0.042) and phase SD (P < 0.01) were the only independent predictors for response to CRT.
ROC curve analysis was used to define the optimal threshold for prediction of response to CRT. For histogram bandwidth, optimal cutoff value was defined at 72.5°, which yielded a sensitivity of 83% and a specificity of 81%; the area under the curve (AUC) was 0.83 (Fig. 5A). For phase SD, optimal cutoff value was defined at 19.6°, yielding a sensitivity of 83% and a specificity of 81%; the AUC was 0.85 (Fig. 5B).
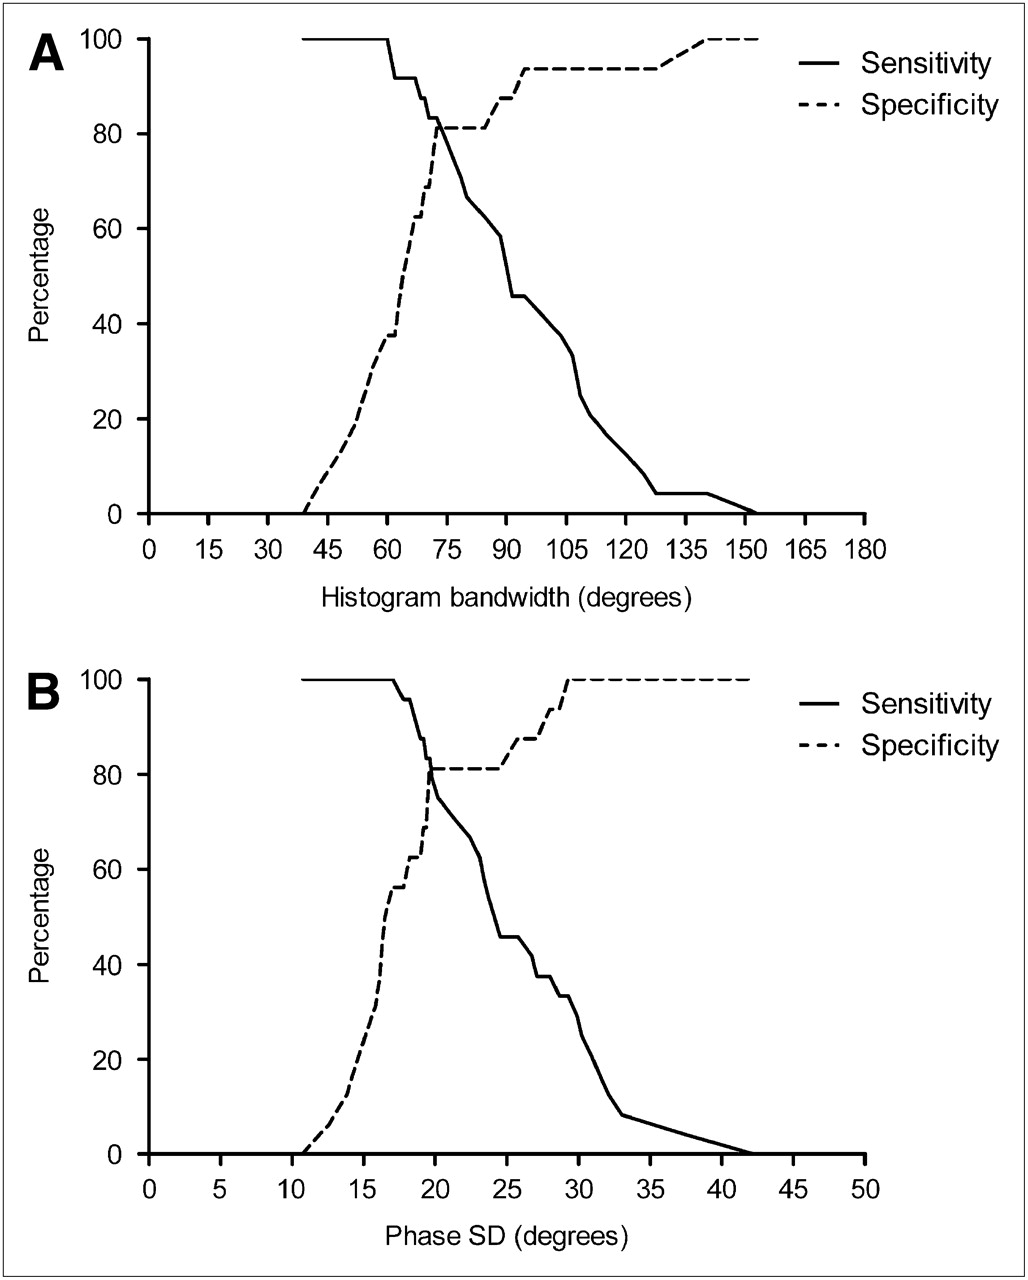
ROC curve analysis for histogram bandwidth (A) and phase SD (B) for prediction of response to CRT. ROC curve analysis for histogram bandwidth showed good predictive value (AUC, 0.83) of response to CRT. Optimal cutoff value was defined at 72.5°, yielding sensitivity of 83% and specificity of 81%. For phase SD, ROC curve analysis demonstrated good predictive value (AUC, 0.85) of response to CRT. Optimal cutoff value was defined at 19.6°, yielding sensitivity of 83% and specificity of 81%.
DISCUSSION
Phase analysis on GMPS and echocardiography using TDI showed a significant correlation for the assessment of LV dyssynchrony. Moreover, both histogram bandwidth and phase SD derived from GMPS were predictive of CRT response at the 6-mo follow-up. For histogram bandwidth, an optimal cutoff value of 72.5° yielded a sensitivity of 83% and a specificity of 81% to predict response to CRT. For phase SD, sensitivity and specificity similar to those for histogram bandwidth were obtained at a cutoff value of 19.6°.
LV Dyssynchrony Derived from GMPS
Patients are selected for CRT on the basis of the current American Heart Association/American College of Cardiology/European Society of Cardiology guidelines, which recommend CRT in patients with NYHA class III or IV heart failure, an LVEF of no more than 35%, and a prolonged QRS interval greater than or equal to 120 ms (6–10).
However, a substantial number of the selected patients do not show response to CRT (2,5–8). Therefore, efforts have been made to improve current selection criteria for CRT, and previous studies have demonstrated that LV dyssynchrony is related to CRT response and may have additional value in the selection of potential candidates for CRT (6–8). One of the potential explanations for nonresponse in patients meeting contemporary guidelines is that a wide QRS complex may reflect interventricular rather than intraventricular dyssynchrony (26).
To detect LV dyssynchrony, a variety of imaging techniques can be used, including echocardiography with TDI (6–8) or myocardial strain (rate) imaging (11), MRI (12), and nuclear imaging with GMPS (14–18). Most studies on CRT have reported on echocardiographic methods to assess LV dyssynchrony; in particular, echocardiography using TDI has been used as a tool for the assessment of LV dyssynchrony (6-8). Recently, the feasibility of phase analysis on GMPS for detection of LV dyssynchrony has been shown (27,28). This approach provides automatically quantitative parameters of LV dyssynchrony using count-based analysis and has been developed to extract amplitude and phase angle from changes in counts per region during the cardiac cycle (14–17). Amplitude of the phase curve indicates maximal systolic wall thickening, whereas phase angle indicates the beginning of mechanical contraction per region, providing information on the degree of hetero- or homogeneity of the mechanical activation pattern within the ventricle. A histogram was constructed that represents the distribution of the phase angle for all sample points of the left ventricle, providing quantitative parameters for LV dyssynchrony including histogram bandwidth (includes 95% of the elements of the phase histogram) and phase SD (SD of phase distribution) (18).
Various studies have shown that this approach can detect LV dyssynchrony in patients with heart failure and a wide QRS complex (27,28). Subsequent studies have shown the relationship between phase analysis on GMPS and echocardiographic techniques for the assessment of LV dyssynchrony (29,30). Henneman et al. (29) evaluated 75 heart failure patients with a wide QRS complex in a head-to-head comparison between phase analysis on GMPS and 2D echocardiography with TDI. The authors demonstrated that histogram bandwidth and phase SD derived from GMPS related well to LV dyssynchrony derived from TDI. Marsan et al. (30) used real-time 3-dimensional echocardiography and also demonstrated a good relationship with phase analysis on GMPS for the detection of LV dyssynchrony in 40 patients with heart failure. In the current study, GMPS data were processed with the QGS algorithm, which was expanded to provide quantitative parameters for the assessment of LV dyssynchrony. It was shown that LV dyssynchrony derived from TDI related significantly to histogram bandwidth and phase SD obtained with the QGS algorithm.
GMPS for Prediction of Response to CRT
Many echocardiographic studies have shown that LV dyssynchrony is predictive for response to CRT (6–8). Only 1 study has reported on the use of GMPS for prediction of response to CRT (31); in that study, 42 patients with heart failure (NYHA class III–IV), an LVEF of no more than 35%, and a QRS greater than 120 ms underwent GMPS before CRT implantation. In the patients, reflectors of LV dyssynchrony (phase SD and histogram bandwidth) were identified as predictors of response to CRT over a 6-mo follow-up period. Particularly, a cutoff value of 43° for phase SD yielded a sensitivity and specificity of 74% for prediction of response to CRT; a cutoff value of 135° for histogram bandwidth had a sensitivity and specificity of 70%.
In the current study, a different algorithm derived from the QGS program was used for the assessment of phase SD and histogram bandwidth. In line with previous work (31), histogram bandwidth and phase SD were significantly larger in CRT responders than in CRT nonresponders (Table 2). When ROC curve analysis was applied, a cutoff value of 19.6° for phase SD yielded a sensitivity of 83% and a specificity of 81% (AUC, 0.85) to predict response to CRT at the 6-mo follow-up. For histogram bandwidth, a similar sensitivity and specificity were obtained at a cutoff value of 72.5° (AUC, 0.83). The accuracy to predict response to CRT in the current study is in line with earlier work using different software to analyze GMPS (31). The optimal cutoff values for phase SD and histogram bandwidth in the present study are not identical to the values obtained in the study by Henneman et al. (31), and this may be related to differences in software packages or to differences in study populations. One of the major differences between these software packages is that QGS uses an ellipsoidal sampling system (21), whereas the Emory Cardiac Toolbox uses the hybrid cylindric–spheric coordinate system (32).
In both the study by Henneman et al. (31) and the current study, the accuracy of GMPS to predict response to CRT was not perfect. Compared with TDI, however, the advantages of GMPS include providing global measurements and having measurements that are automatically derived. Given these advantages and the accuracy demonstrated by this and previous work, GMPS may provide a reasonable alternative for clinical use to TDI in predicting CRT response.
It is not realistic to expect a perfect accuracy for prediction of CRT response based solely on LV dyssynchrony. Indeed, recent work has indicated that issues other than LV dyssynchrony are important for response to CRT. Scar tissue has been identified as an important factor limiting the response to CRT (33,34). It has been shown that the extent of scar tissue was inversely related to the response to CRT; also, patients with scar tissue in the region where the LV lead was positioned did not respond well to CRT and the extent (the total scar burden) of scar tissue has been shown to prevent response to CRT. Therefore, the preferred method would be to assess not only the presence of LV dyssynchrony but also the extent and location of scar tissue in the left ventricle. In this perspective, GMPS has the potential to provide both these parameters from the same dataset.
Finally, it has been shown that patients with the LV lead positioned outside the region of latest mechanical activation benefitted less from CRT than did patients with the lead positioned in the area of latest activation (35). More recently, Ypenburg et al. (36) reported on the outcome of patients undergoing CRT with the LV lead positioned inside or outside the region of latest mechanical activation and demonstrated that long-term survival was better when the LV pacing lead was positioned at the site of latest mechanical activation.
Study Limitations
The current work should be considered a feasibility study, validating a new algorithm on phase analysis with QGS. Patients with extensive scar tissue in the left ventricle benefit less from CRT. In addition, patients with the LV pacing lead located outside the region of latest mechanical activation will have a less favorable response to CRT. In the current study, only the number of cardiac segments with a perfusion defect was integrated. To provide a meaningful analysis on all these issues, however, a much larger study population is needed. Whether integration of all this information will result in a superior prediction of response to CRT needs further testing in future studies.
CONCLUSION
Phase analysis on GMPS using QGS software correlated significantly with TDI for the assessment of LV dyssynchrony. In addition, both phase SD and histogram bandwidth were predictive of response to CRT.
Larger studies are needed to confirm these findings and to explore the relative clinical effectiveness of GMPS and TDI in prediction of response to CRT.
Acknowledgments
A portion of this study was supported by the Dutch Heart Foundation grant 2006T102. Cedars-Sinai Medical Center receives royalties from the licensing of QGS.
Footnotes
-
COPYRIGHT © 2009 by the Society of Nuclear Medicine, Inc.
References
- Received for publication November 27, 2008.
- Accepted for publication January 29, 2009.


