


Abstract
Objective: The radioactivity count distribution in the brain must be determined accurately to accurately measure cerebral blood flow (CBF). Scatter and attenuation are factors that compromise the accuracy of determining radioactivity counts in the brain.
Methods: We compared regional CBF in patients by an autoradiographic method using N-isopropyl-p-[123I] iodoamphetamine when, first, attenuation correction alone was performed uniformly on SPECT images by using empiric μ-values (Chang method); second, scatter correction was performed and the μ-values of a homogeneous-attenuation body of water were used for attenuation correction (triple-energy window [TEW] + Chang method); and third, scatter correction was performed and the μ-values calculated by CT were used for attenuation correction (TEW + CT method). We also compared regional CBF measured by these methods with the values obtained by the xenon CT/CBF method, which uses CT and stable xenon.
Results: Scatter correction reduced overestimation of regional CBF in low-flow regions. The TEW + CT method yielded better regional and overall correlations with the xenon CT/CBF method than did either of the other methods.
Conclusion: The TEW + CT method of correction gave the most accurate measurements of regional CBF.
- brain perfusion SPECT
- autoradiography method
- stable XeCT regional CBF measurement
- scatter correction
- attenuation correction
Quantitative measurements of regional cerebral blood flow (CBF) can be made by SPECT through conversion of SPECT counts to regional CBF using input function data. For the calculation of regional CBF to be accurate, the SPECT count distributions must be accurate, but the scatter and attenuation of γ-rays emitted from inside the body are obstacles to accuracy. The triple-energy-window (TEW) method, which positions subwindows next to the photopeak window, is a way to correct scatter (1–3), and the Chang method, (4,5) which assumes homogeneous attenuation in the body and therefore applies a single linear attenuation coefficient value, has long been used as a way to correct attenuation. However, because of the cerebral parenchyma, skull, nasal cavities, and other structures, the head is not homogeneously attenuating (6,7). A method that uses γ-rays from an external radiation source (8,9) and a method that uses CT have been developed in recent years and can now measure and correct the inhomogeneous attenuation distribution in the head. In the past, the method that uses CT faced such problems as data incompatibility between CT and SPECT and registration mismatches; however, by processing CT images via a Digital Imaging and Communications in Medicine (DICOM) network and matching positions with the automatic registration tool (10), one can now apply attenuation maps that are appropriate for the γ-ray energy used. This method is rapidly becoming widely adopted because, rather than requiring that CT attenuation maps be prepared on the day of the SPECT examination, it allows use of CT images acquired in previous routine examinations, thus preventing additional exposure to radiation.
In this clinical study, we compared the effect of the TEW method for scatter correction and the Chang or CT method for attenuation correction on regional CBF quantitatively determined by the autoradiography method of Iida et al. (11–14), which uses N-isopropyl-p-[123I] iodoamphetamine (123I-IMP). The 3 methods that we compared included, first, use of only the Chang method of attenuation correction, second, use of scatter correction and the Chang method (TEW + Chang method), and third, use of scatter correction and the CT method of attenuation correction (TEW + CT method). We also compared regional CBF measured by these methods with the values obtained by a CT method using stable xenon (XeCT/CBF) (15,16).
MATERIALS AND METHODS
Equipment
We used a GCA-9300A/PI triple-detector SPECT machine with a low-energy, super-high-resolution fanbeam collimator (half-value width at the center of the SPECT image, 8.6 mm) and a GMS-5500A/PI data processor (Toshiba). Blood samples were measured in an ARC-300 γ-counter (Aloka) (11–14). For the XeCT/CBF method, we used an X-vigor CT machine (Toshiba) and an AZ-725 xenon gas absorption machine and AZ-7000 data processor (Anzai Manufacturing).
Data Acquisition and Processing
The SPECT acquisition used a 128 × 128 matrix and was continuous over 360° in 4° steps for 10 rotations at 3 min per rotation. A Butterworth preprocessing filter was applied, using a cutoff frequency of 0.12 cycles per pixel (1 pixel = 1.72 mm) and 8°. Filtered backprojection was used for reconstruction, and a Ramachandran (ramp) filter was used for correction. The TEW method (1–3) was used for scatter correction. Scatter was estimated and reduced in the main window by using a main window of 20% and subwindows of 7% above and below the main window, for an energy window with a 123I photopeak of 160 keV. In the attenuation correction method, the attenuation map for the Chang method was prepared by extracting the skin contour and using its inner side as a homogeneous-attenuation body. When the attenuation correction was performed by the Chang method alone, 0.07 cm−1 was used as the attenuation coefficient (15), whereas when the TEW method was used in combination (TEW + Chang method), correction was performed using 0.146 cm−1, which is the attenuation coefficient for 160-keV γ-ray water. In the TEW + CT method, which processes the CT image via the DICOM network and registers the SPECT and CT images by the automatic registration tool (10), correction was performed by converting the CT image into a μ-map suitable for the γ-curve energy that was used. That conversion used a linear equation for cross-calibration with air and water. After reconstitution of the projection data that were used for scatter correction by the TEW method, the CT image that had been converted to a μ-map was used for attenuation correction (Table 1).
Methods
Autoradiography
An arterial blood sample was collected 10 min after the intravenous injection of 123I-IMP, and the SPECT acquisition began 10 min later. The data were used to calculate regional CBF (autoradiography/CBF method) by the technique of Iida et al. (11–14).
XeCT/CBF
The CT parameters consisted of a 512 × 512 matrix, 24-cm field of view, 10-mm slice thickness, 7 scans per slice surface at 1-min intervals, and 7 × 7 point smoothing. The method was based on Fick’s principle. Regional CBF (16,17) was calculated by XeCT/CBF using the AZ-725 xenon gas inhalation system, with a 4-min inhalation of a 30% Xe:70% O2 gas mixture and a 4-min washout.
Comparison of the 3 Methods
Regional CBF images of a healthy subject were obtained using each of the autoradiography/CBF methods. Horizontal profile curves at 2 levels—the level of the cerebral basal ganglia and the level of the lateral ventricles—were generated from these images and were compared.
Comparison of Autoradiography/CBF and XeCT/CBF
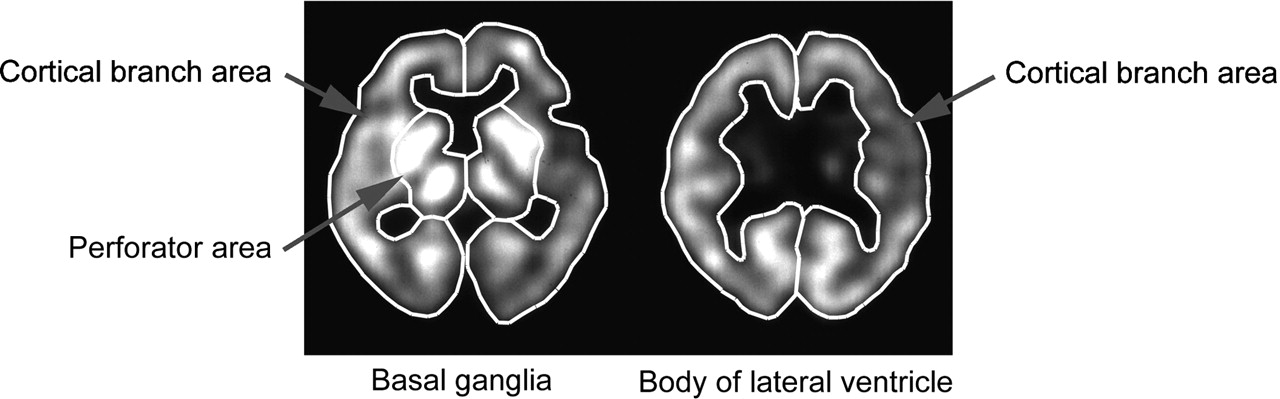
Regional CBF as determined by each of the autoradiography/CBF methods and by the XeCT/CBF method was compared in 80 patients (52 men and 28 women; age range, 19–80 y; mean age, 65.7 y) with chronic cerebrovascular disorders. For each patient, 6 regions of interest (ROIs) were placed: the right and left perforator regions at the level of the basal ganglia, the right and left cortical branch regions at the level of the basal ganglia, and the right and left cortical branch regions at the level of the lateral ventricle (Fig. 1).

ROIs for human study are set in right and left perforator regions and in right and left cortical branch regions at level of basal ganglia (4 ROIs in total) and in right and left cortical branch regions at level of body of lateral ventricle (2 ROIs in total).
RESULTS
Comparison of the 3 Methods
Profile curves of the regional CBF images at the 2 levels for each of the methods are shown in Figure 2. The profile curve obtained by the Chang method in low-flow areas, such as the white matter and cerebral ventricles, yielded higher values than the curves obtained by the other 2 methods. The profile curves obtained by the TEW + Chang method and the TEW + CT method were similar in the low-flow areas, but in high-flow areas, such as the gray matter and thalamus, the TEW + CT method yielded higher values.
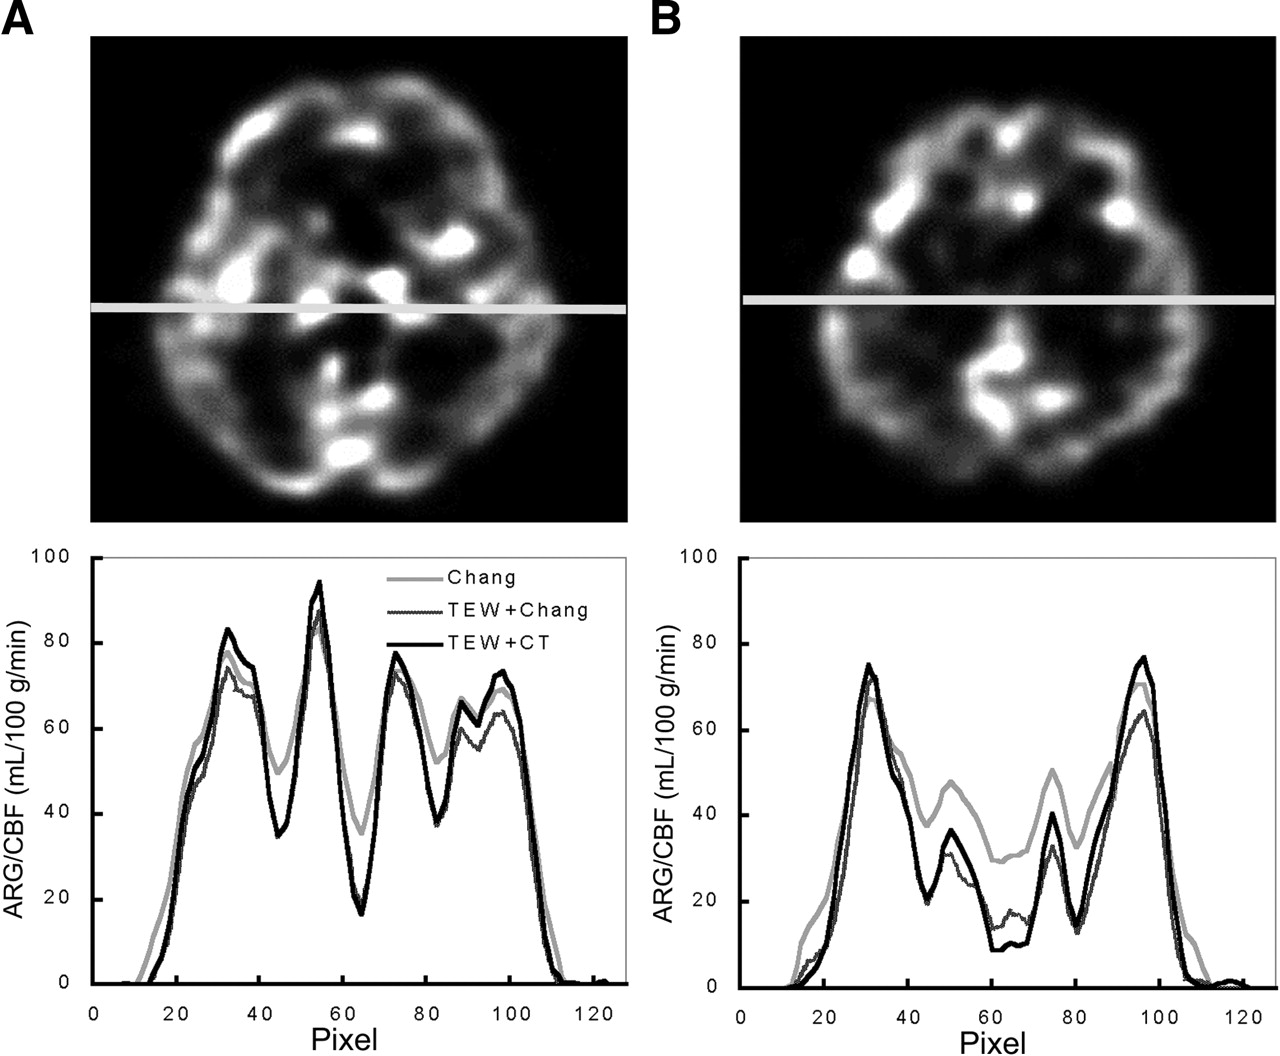
Profile curves obtained from humans at level of basal ganglia (A) and level of body of lateral ventricle (B). Profile curves obtained by TEW + Chang and TEW + CT methods were similar for regions with low regional CBF values, such as white matter and ventricles. However, profile curves obtained by TEW + CT method were higher in regions with high regional CBF values, such as gray matter and thalamus. In Chang method, difference between higher parts and lower parts of profile curves was less than in the other 2 methods, and regional CBF values were high, especially in white matter and ventricle. ARG = autoradiography.
Comparison of Autoradiography/CBF and XeCT/CBF
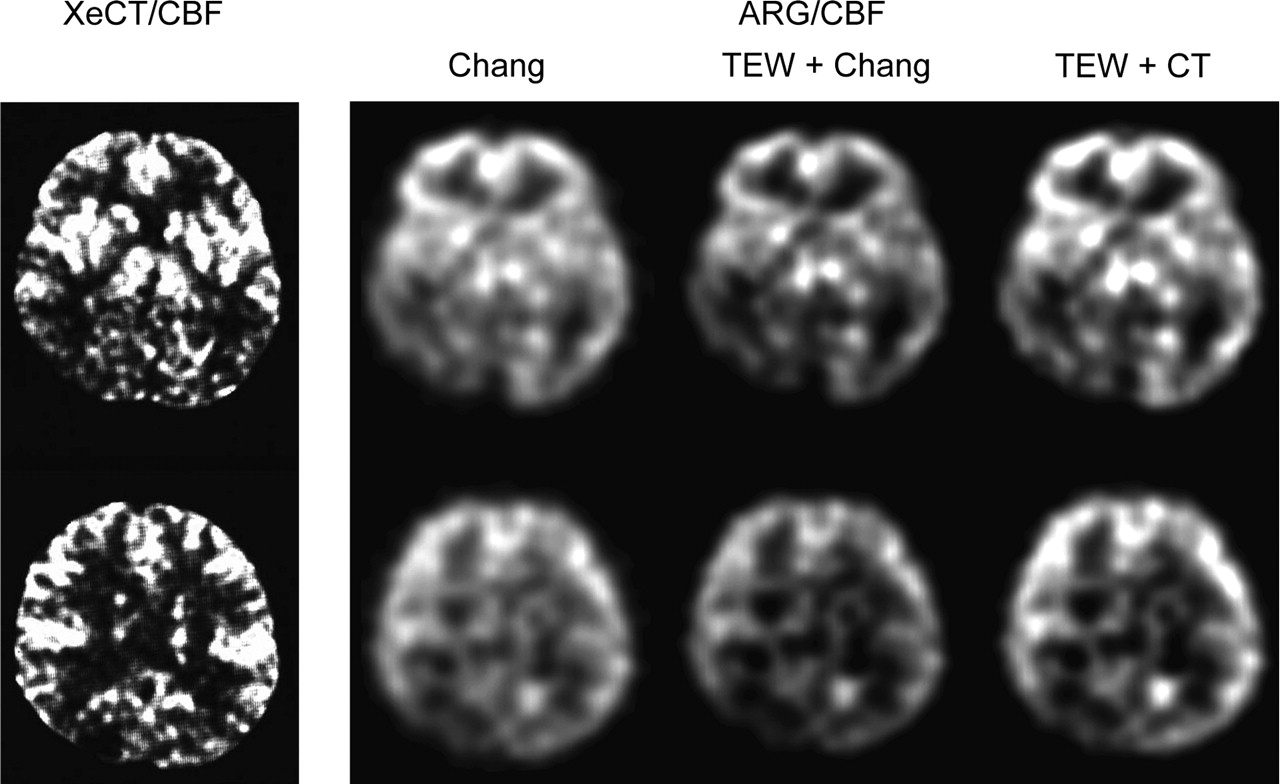
Regional CBF images obtained by the XeCT/CBF method and by each of the autoradiography/CBF methods are shown in Figure 3. The correlation in regional CBF between the autoradiography/CBF methods and the XeCT/CBF method is shown for all regions in Figure 4 and for each region in Figure 5.

XeCT/CBF image and autoradiography/CBF images of the 3 methods used on 67-y-old woman with right posterior cerebral artery occlusion. ARG = autoradiography.
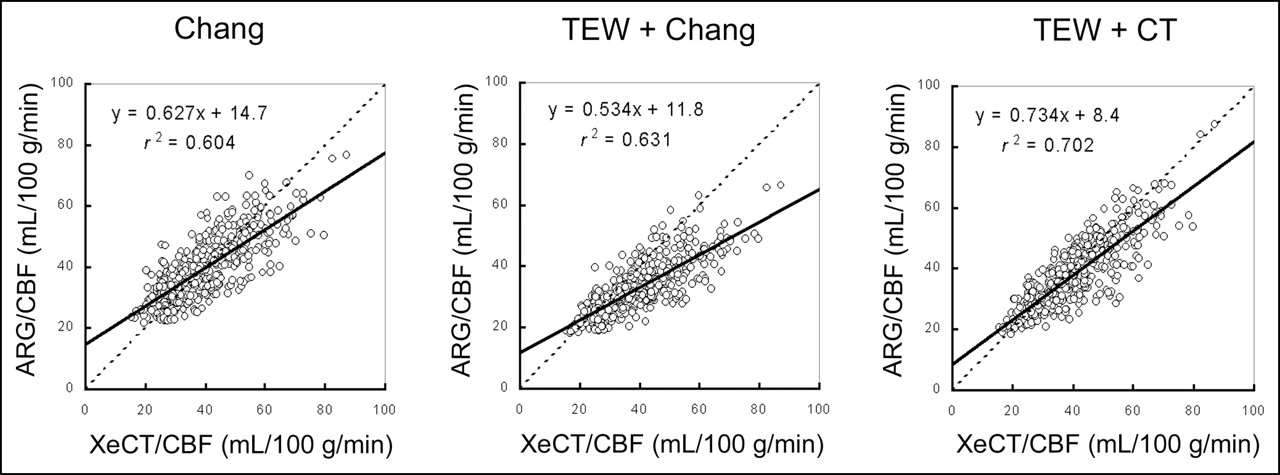
Correlations between regional CBF values obtained by each autoradiography/CBF method and regional CBF values obtained by XeCT/CBF method in clinical cases. In each area, x-coefficient of regional CBF values obtained by TEW + CT method to those obtained by XeCT/CBF method improved maximally. Correlation was better in methods using scatter and attenuation correction than in method using attenuation correction alone. ARG = autoradiography.
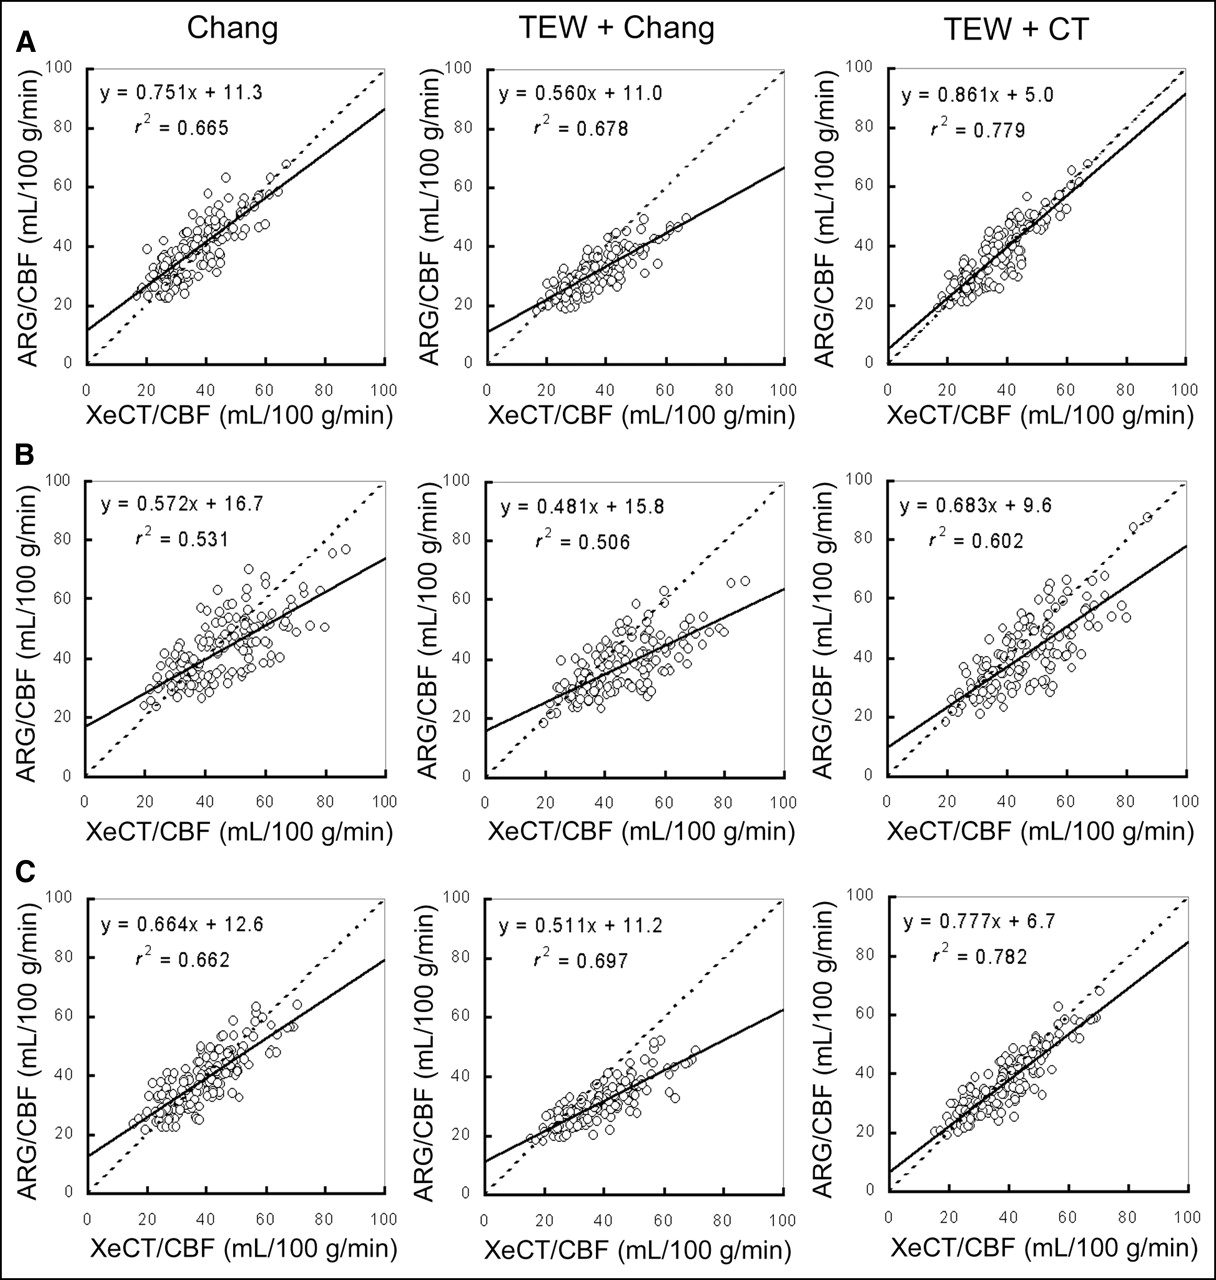
Correlations between regional CBF values obtained by each autoradiography/CBF method and regional CBF values obtained by XeCT/CBF method for each ROI: (A) cortical branch region at level of basal ganglia; (B) perforator region at level of basal ganglia; (C) cortical branch region at level of body of lateral ventricle. In each region, x-coefficient of regional CBF values obtained by TEW + CT method to those obtained by XeCT/CBF method improved maximally. In all methods, correlations were better in cortical branch region than in perforator region. ARG = autoradiography.
Figure 3 shows that although contrast differed slightly among regional CBF images obtained with the different autoradiography/CBF methods, the blood flow distribution patterns of these images closely matched the patterns obtained by the XeCT/CBF method.
The overall comparisons in Figure 4 show that the Chang method yielded an r2 value of 0.604 and that this correlation was poorer than with the other 2 methods. With the TEW + Chang method, the coefficient of x was 0.534, and the slope diverged further from unity than with the other 2 methods.
The comparisons of the individual regions in Figure 5 show that the perforator region at the level of the basal ganglia yielded poorer correlations than did the other 2 regions, and the slopes also deviated more from unity. At flow levels below approximately 40 mL/100 g/min, the Chang method yielded higher values than did the XeCT/CBF method at all regions and tended to yield lower values at higher flow levels. The higher the blood flow at every region, the more the values obtained by the TEW + Chang method diverged from the values obtained by the XeCT/CBF method. Both in the region comparisons and in the overall comparisons, the TEW + CT method showed statistically significant correlations with the XeCT/CBF method and better correlations than did the other 2 methods.
DISCUSSION
Methods of correcting scatter and attenuation make it possible to obtain SPECT images showing accurate radioactivity distributions. These corrections are currently made by any of a variety of methods, depending on the performance and available functionality of the equipment, circumstances at the institution, and other factors. Regardless of the method, however, from a clinical standpoint it is extremely important to obtain images with accurate radioactivity spatial distributions.
Figure 2 shows that, when compared with the other 2 methods, the Chang method yielded no significant differences in autoradiography/CBF in high-blood-flow regions such as the gray matter and thalamus but yielded clearly higher values in low-flow regions such as the white matter and cerebral ventricles. The higher values in low-flow regions were thought to be due to a low concentration of radioisotope in those regions, because a significantly larger fraction of the photons tomographically reconstructed there are secondary scattered γ-rays as opposed to primary photon emissions and because the attenuation correction was performed at a fixed μ-value in the reconstructed images (18). As a result, as shown in Figure 3, the Chang method yielded the regional CBF images with the poorest resolution of the 3 autoradiography/CBF methods. The contribution of low-flow regions causes overestimation of regional CBF in large ROIs. In other words, because the values obtained at blood flow levels below approximately 40 mL/100 g/min were higher than those obtained by XeCT/CBF, the Chang method y-intercept diverged further from 0 than did the y-intercepts obtained by the other 2 methods. These results show that scatter correction is essential to obtain accurate count values in low-flow areas (19).
As shown in Figure 2, in low-flow regions such as the white matter and cerebral ventricles, the TEW + Chang method yielded almost the same profile curves as did the TEW + CT method, whereas in high-flow regions such as the gray matter and thalamus, the TEW + Chang method yielded clearly lower values. This difference is thought to be due to undercorrection of cranial attenuation in high-flow regions, because the TEW + Chang method does not take the skull into account but, rather, corrects attenuation on the basis of the assumption that the head is of homogeneous attenuation. Because the counts are also low in the white matter and cerebral ventricles, these are the regions most affected by scatter correction, and because both methods correct for scatter, no differences in regional CBF arose. As a result, in the correlation overall in Figure 4, the higher the blood flow, the more markedly the x-coefficient diverges in comparison with the other 2 methods. As shown by the correlations at each region in Figure 5, the x-coefficient and correlation values in the perforator region at the center of the brain, which is most affected by attenuation, are poorer than those obtained by the other methods and at other regions. In this study, we used 0.146 cm−1, the water value of 123I, as the linear attenuation coefficient; however, in the body the actual linear attenuation coefficient is higher than that of water (18). If the linear attenuation coefficient is set slightly higher to account for this difference between water and the body, then the count definitely increases. However, when the counts are normalized by the autoradiography method to yield regional CBF values, cross-calibration is performed between the phantom and the well counter, and the in vivo SPECT count A (counts per pixel [cpp]) is transformed into the well counter count B (cpm). Cross-calibration factor (CCF) uses the phantom and is represented as CCF = the count C (cpm) of the phantom content fluid measured by the well counter/the phantom SPECT count D (cpp). Here, the formula for transforming in vivo SPECT count A (cpp) into the well counter count B (cpm) is B (cpm) = A (cpp) × C (cpm)/D (cpp). Thus, even if the attenuation coefficient is changed, the regional CBF value will not be greatly changed because the phantom count D changes in the same manner as does the in vivo count A (13). Thus, accurate attenuation correction is necessary in view of the attenuation produced by the skull (20).
The TEW + CT method performs scatter correction along with an attenuation correction that accounts for skull attenuation. Thus, as shown by the profile curves in Figure 2, the TEW + CT method yields higher values in high-flow regions than do the other 2 methods. In addition, as shown in Figure 5, the correlations with XeCT/CBF were better with the TEW + CT method than with the other 2 methods at each of the regions, including the perforator region, which exhibited the largest divergences from XeCT/CBF. This finding shows that of the 3 autoradiography/CBF methods compared in this study, the TEW + CT method yielded the most accurate values in relation to those yielded by the XeCT/CBF method.
The results of this study confirmed that if scatter and attenuation correction are not performed, regional CBF values are systematically overestimated in low-flow regions because of scattering and systematically underestimated in high-flow regions because of attenuation, but that accurate scatter and attenuation correction yields good correlations with regional CBF measured by other modalities. It appears that, in the future, scatter correction and attenuation correction for an inhomogeneous-attenuation structure will be essential when CBF is measured quantitatively by SPECT.
Ideally, the same CBF values should be obtained regardless of the modality. Because of such problems as the partial-volume effect, which was not considered in the present study, additional studies will be needed to more accurately measure blood flow by SPECT.
CONCLUSION
This study has shown that scatter correction is essential to obtain accurate regional CBF values in low-flow regions and that, because of attenuation by the skull, attenuation correction is necessary to obtain accurate regional CBF values in high-flow regions. These corrections yielded good correlations with CBF measured by the XeCT/CBF method.
Acknowledgments
We thank Masahiro Takayama (Nihon Medi-Physics Co., Ltd.) and Audrius Stundzia and Paul Dufort (Advanced Biologic Corp.) for their assistance in the preparation of this paper.
Footnotes
For correspondence or reprints contact: Masuo Hayashi, Department of Radiology, Osaka Medical College Hospital, 2-7, Daigaku-chou, Takatsuki-shi, Osaka, Japan.
E-mail: rad040{at}poh.osaka-med.ac.jp
REFERENCES


Jump to section
Related Articles
Cited By...
- Optimization of the Attenuation Coefficient for Chang Attenuation Correction in 123I Brain Perfusion SPECT
- A Headrest Made of Extruded Polystyrene Reduces the Influence of Attenuation Correction on Human Brain SPECT Images
- Influence of Attenuation Correction by Brain Perfusion SPECT/CT Using a Simulated Abnormal Bone Structure: Comparison Between Chang and CT Methods
- Assessment of Clinical Impact in the Application of Chang Attenuation Correction to Lung Ventilation/Perfusion SPECT
- SPECT/CT
- SPECT Quantification of Benzodiazepine Receptor Concentration Using a Dual-Ligand Approach