


Abstract
Brain perfusion SPECT has physical phenomena such as attenuation, scatter, and degradation of resolution that impair accuracy on data acquisition. Chang and CT methods have spread application for attenuation correction (AC) and indicate the utility of AC using a brain phantom without a bone or with a normal bone structure. However, nonuniform AC of an abnormal bone structure such as postoperative bone defect after burr-hole surgery has not yet been evaluated. Therefore, we evaluated the influence of nonuniform AC of an abnormal bone structure between the 2 AC methods. Methods: We created 5 brain phantoms simulating an abnormal bone structure such as frontal, occipital, and right temporal bone defects as well as with and without a bone, which compared the influence among 3-dimensional ordered-subset expectation maximization (OSEM) incorporating scatter, attenuation, and resolution recovery corrections, and obtained 3 reconstruction processing images: OSEM (non-AC; NAC), OSEM (Chang), and OSEM (CTAC). The average counts of the 5 brain phantoms by OSEM (NAC), OSEM (Chang), and OSEM (CTAC) were evaluated by a count profile curve and counts ratio in the region of interest. Results: The counts of OSEM (NAC) and OSEM (Chang) with a bone were approximately 7% higher than those without a bone, whereas OSEM (CTAC) had a similar count ratio. The count ratio of frontal or occipital lobes with a bone defect on both OSEM (NAC) and OSEM (Chang) was 5%–10% higher than that in frontal or occipital lobes without a bone defect; however, OSEM (CTAC) had nearly identical frontal or occipital lobes with and without a bone defect. Conclusion: We conducted a phantom study simulated with and without a bone defect to demonstrate the influence of brain counts between 2 different AC methods. Although the Chang method did not correct the influence of the bone defect due to the use of a uniform attenuation coefficient, the CTAC method correctly conducted AC regardless of the presence of a bone defect.
Brain perfusion SPECT comprises physical phenomena such as attenuation, scatter, and degradation of resolution on data acquisition that impairs image quality. Many researchers, therefore, have proposed technology to correct these physical phenomena (1–5). Technologies for attenuation correction (AC) have been reported to use Sorenson, Chang, transmission CT, and CT AC (CTAC) methods to this end (3–8).
The Chang method is one of the most commonly used AC techniques in Japan (9). Although the Chang method involves correction using a uniform attenuation coefficient, the head has nonuniform structures such as the skull, ventricles, and white and gray matter. Furthermore, the Chang method does not take into account the effect of a head holder. Hayashi et al. have reported that the Chang method, compared with CTAC, underestimates cerebral blood flow (CBF) because of the impact of the skull (8). In addition, Ishii et al. have reported that occipital lobe counts decrease by approximately 10% because of attenuation caused by the head holder in the Chang method (5). CTAC was developed to improve on the problems of the Chang method, which can include correcting for the nonuniform structure of the head (10,11). However, CTAC of separate SPECT and CT acquisitions may lead to a misregistration artifact, which impairs image quality and the quantitative accuracy of CBF in brain perfusion SPECT (10,11). The combination of SPECT and CT scanning has found widespread application. Ishii et al. have reported the utility of nonuniform AC using SPECT/CT equipment with regard to the impact of a head holder (5).
Although nonuniform AC has been evaluated using brain phantoms and clinical studies of a normal bone structure, nonuniform AC of an abnormal bone structure on brain SPECT has not yet been evaluated. Brain perfusion SPECT is widely used for diagnosis and therapy evaluations in Moyamoya disease, cerebral infarction, epilepsy, brain hemorrhage, and arteriovenous malformation (12–15). Therapeutic approaches in these diseases include surgery such as craniotomy and burr-hole surgery, in addition to radiation and medical therapies. Some patients who have undergone postoperative craniotomy and burr-hole surgery to decrease brain pressure still have bone defects. For pre- and postoperative evaluations of craniotomy and burr-hole surgery using brain perfusion SPECT, the SPECT image may change the brain count distribution due to the difference in attenuation attributable to bone loss, which impairs the accuracy of therapy evaluation. This study was conducted to demonstrate the influence of AC between the Chang and CT methods in brain SPECT in the setting of an abnormal skull structure.
MATERIALS AND METHODS
Phantom Design
A Hoffman 3-dimensional brain phantom (Biodex Medical Systems, Inc.) was covered with calcium sulfate (thickness, ∼18 mm) to simulate a skull (16). A CT tube voltage of 130 kVp and μ-value of 140 keV of calcium sulfate with 99Tc were set at 600 Hounsfield units and 0.24 cm−1, respectively (17,18). Furthermore, 3 abnormal skull structures were created in the phantom, simulating frontal, occipital, and right temporal bone defects (defect width, ∼20 mm) to simulate cranial defects after burr-hole surgery (Fig. 1). The phantom was filled with a 99mTc solution at a concentration of 1.65 MBq/mL. Thus, a total of 5 brain phantoms simulated with frontal, occipital, and right temporal bone defects as well as with and without a bone were acquired.
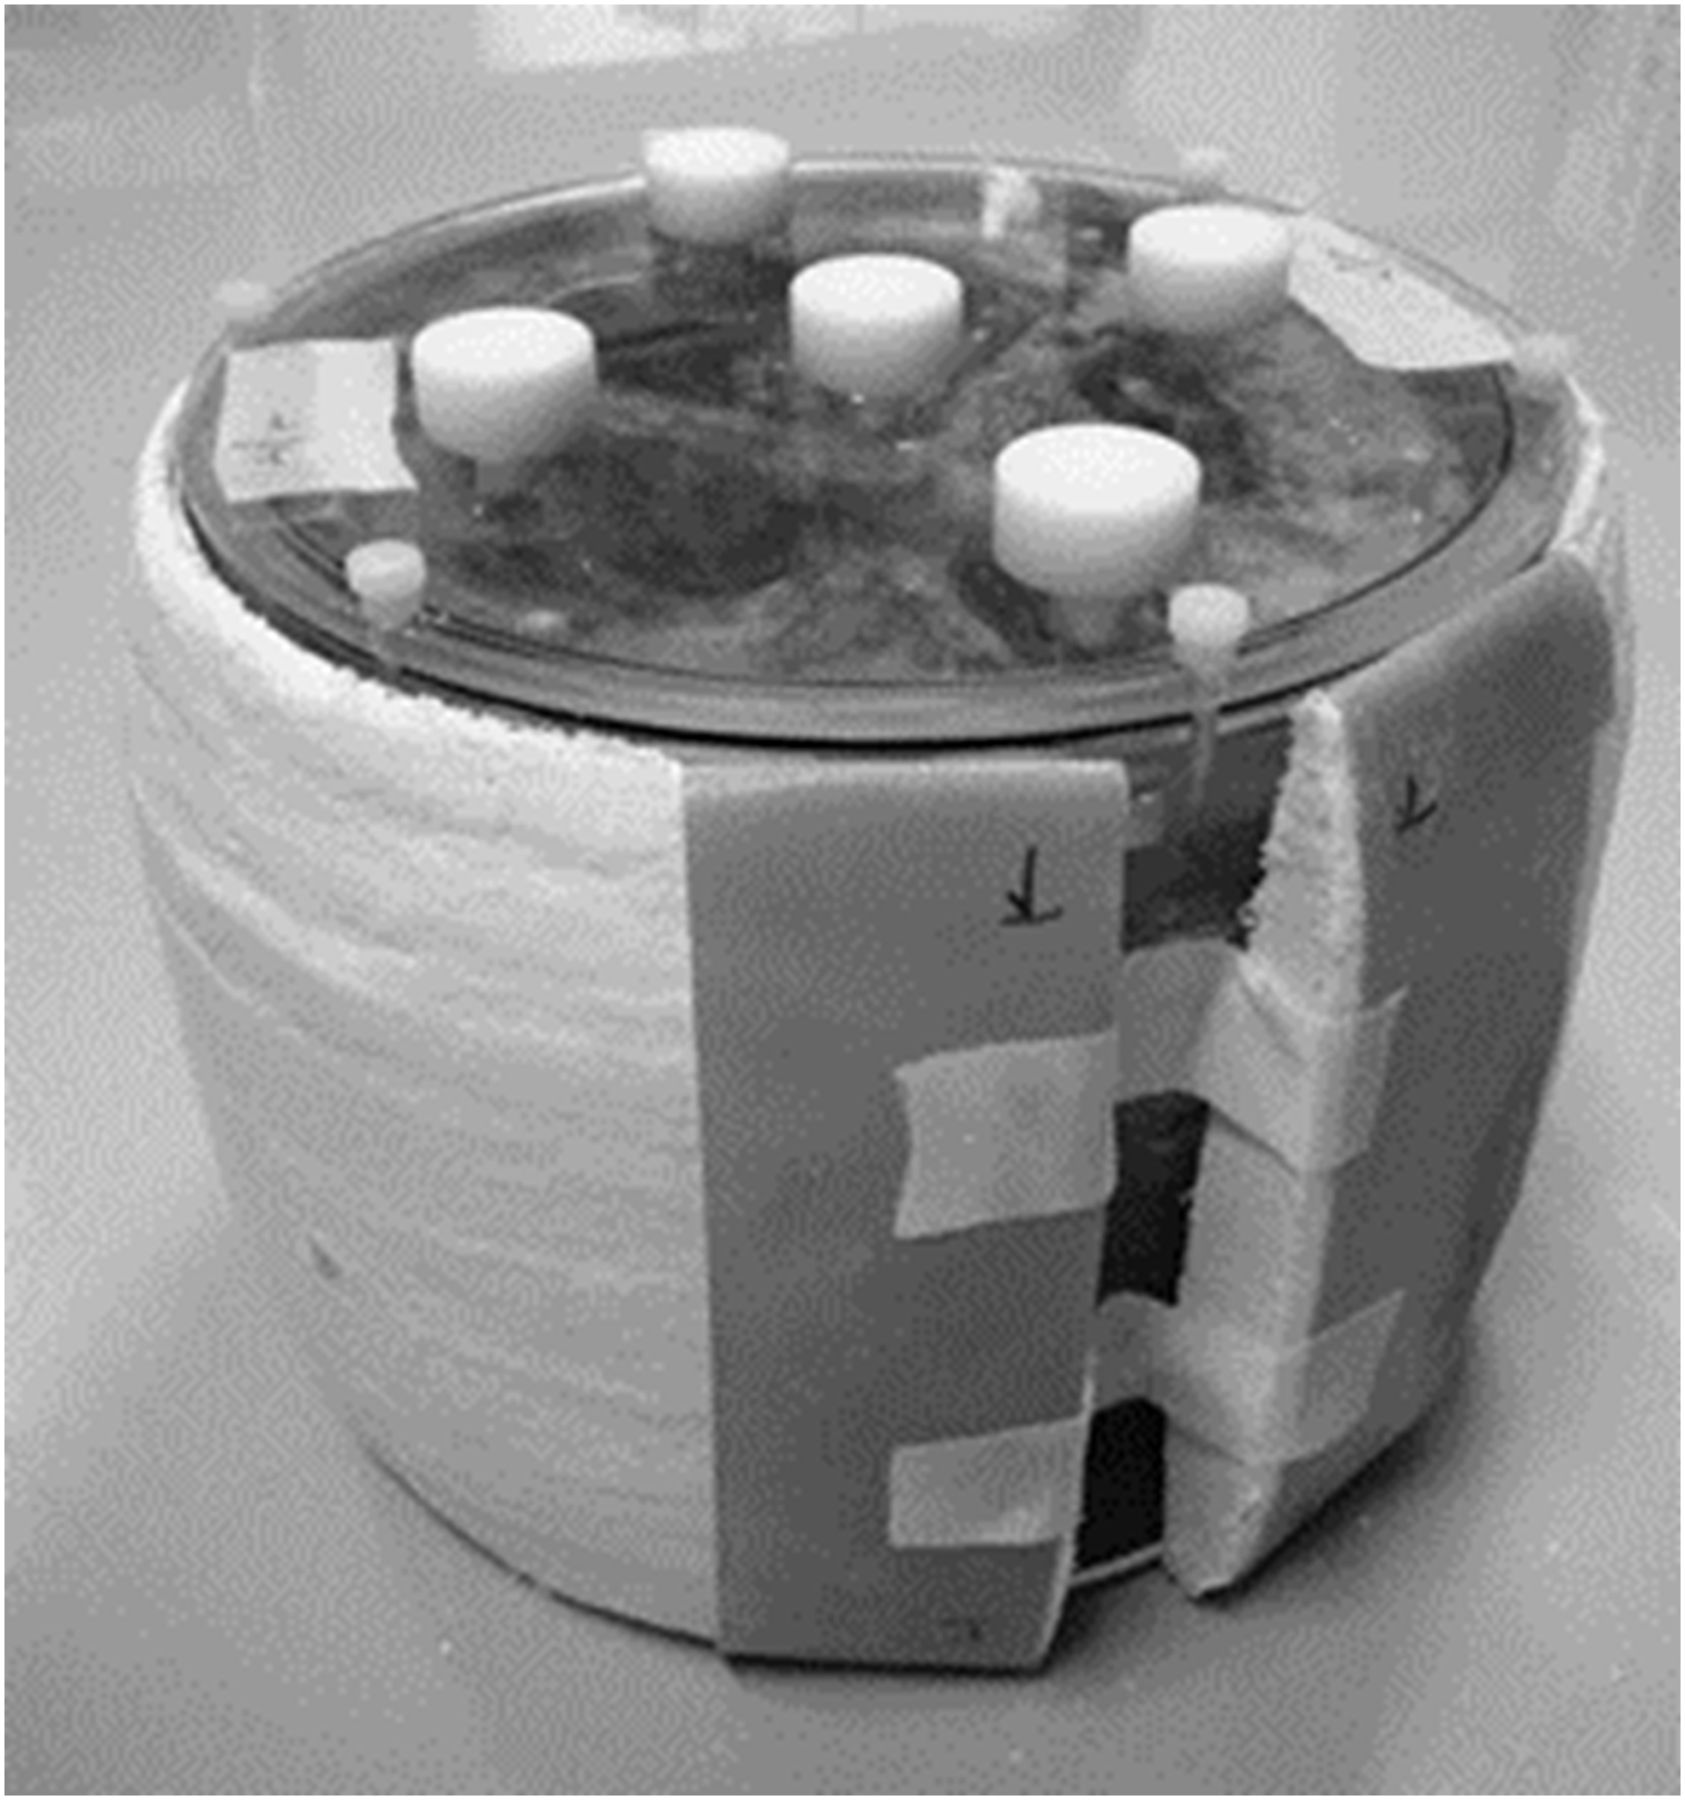
Hoffman 3-dimensional brain phantom simulated a skull after burr-hole surgery. Phantom was covered with calcium sulfate (thickness, ∼18 cm) to simulate cranium. Three phantoms with abnormal skull structures simulated frontal, occipital, and right temporal bone defects (defect width, ∼2 cm).
Acquisition Protocols and Image Reconstruction
SPECT images were acquired with a dual-head γ-camera (Symbia T6 hybrid SPECT/CT system; Siemens Japan) equipped with a low-energy high-resolution collimator. A photopeak window of 99mTc was set as a 21% energy window centered at 140 keV, and a low subwindow for scatter correction was set as a 7% of photopeak window (120–129 keV). Acquisition parameters were a 128 × 128 matrix (zoom factor, 2.29; pixel size, 2.1 mm), in the continuous mode of a 360° circular orbit (radius of rotation, 190 mm) and 90 projections of step angle 4°. The acquisition time was regulated such that the average brain count in the anterior view was 30–40 counts per pixel, which was decided with reference to the clinical image. A CT scan was obtained with the following parameters: tube voltage of 130 kVp, product of tube current and time of 50 mAs, and slice thickness of 5.0 mm.
SPECT data were reconstructed using a Flash3D algorithm that incorporated AC, scatter, and resolution recovery corrections in 3-dimensional ordered-subset expectation maximization (OSEM), from which 3 reconstruction processing images were obtained: OSEM (non-AC; NAC), OSEM (Chang), and OSEM (CTAC) (2). The number of subsets and iterations were 18 and 15, respectively, and the full width at half maximum (FWHM) of the gaussian filter was 10.5 mm in all methods. AC with the Chang method was performed assuming a uniform attenuation coefficient of 0.150 cm−1. Scatter correction was conducted using the multienergy window method (19).
Image Assessments
Brain counts from 5 pattern phantoms for OSEM (NAC), OSEM (Chang), and OSEM (CTAC) were evaluated by a count profile curve and counts ratio. A count profile curve was set on a straight line passing between the defect and the contralateral normal bone (frontal and occipital bone defects: frontal and occipital lobe line; right temporal bone defect: left and right temporal lobe line including the thalamus), which was normalized by the maximum brain count of the ipsilateral normal bone (Figs. 2A and 2B).
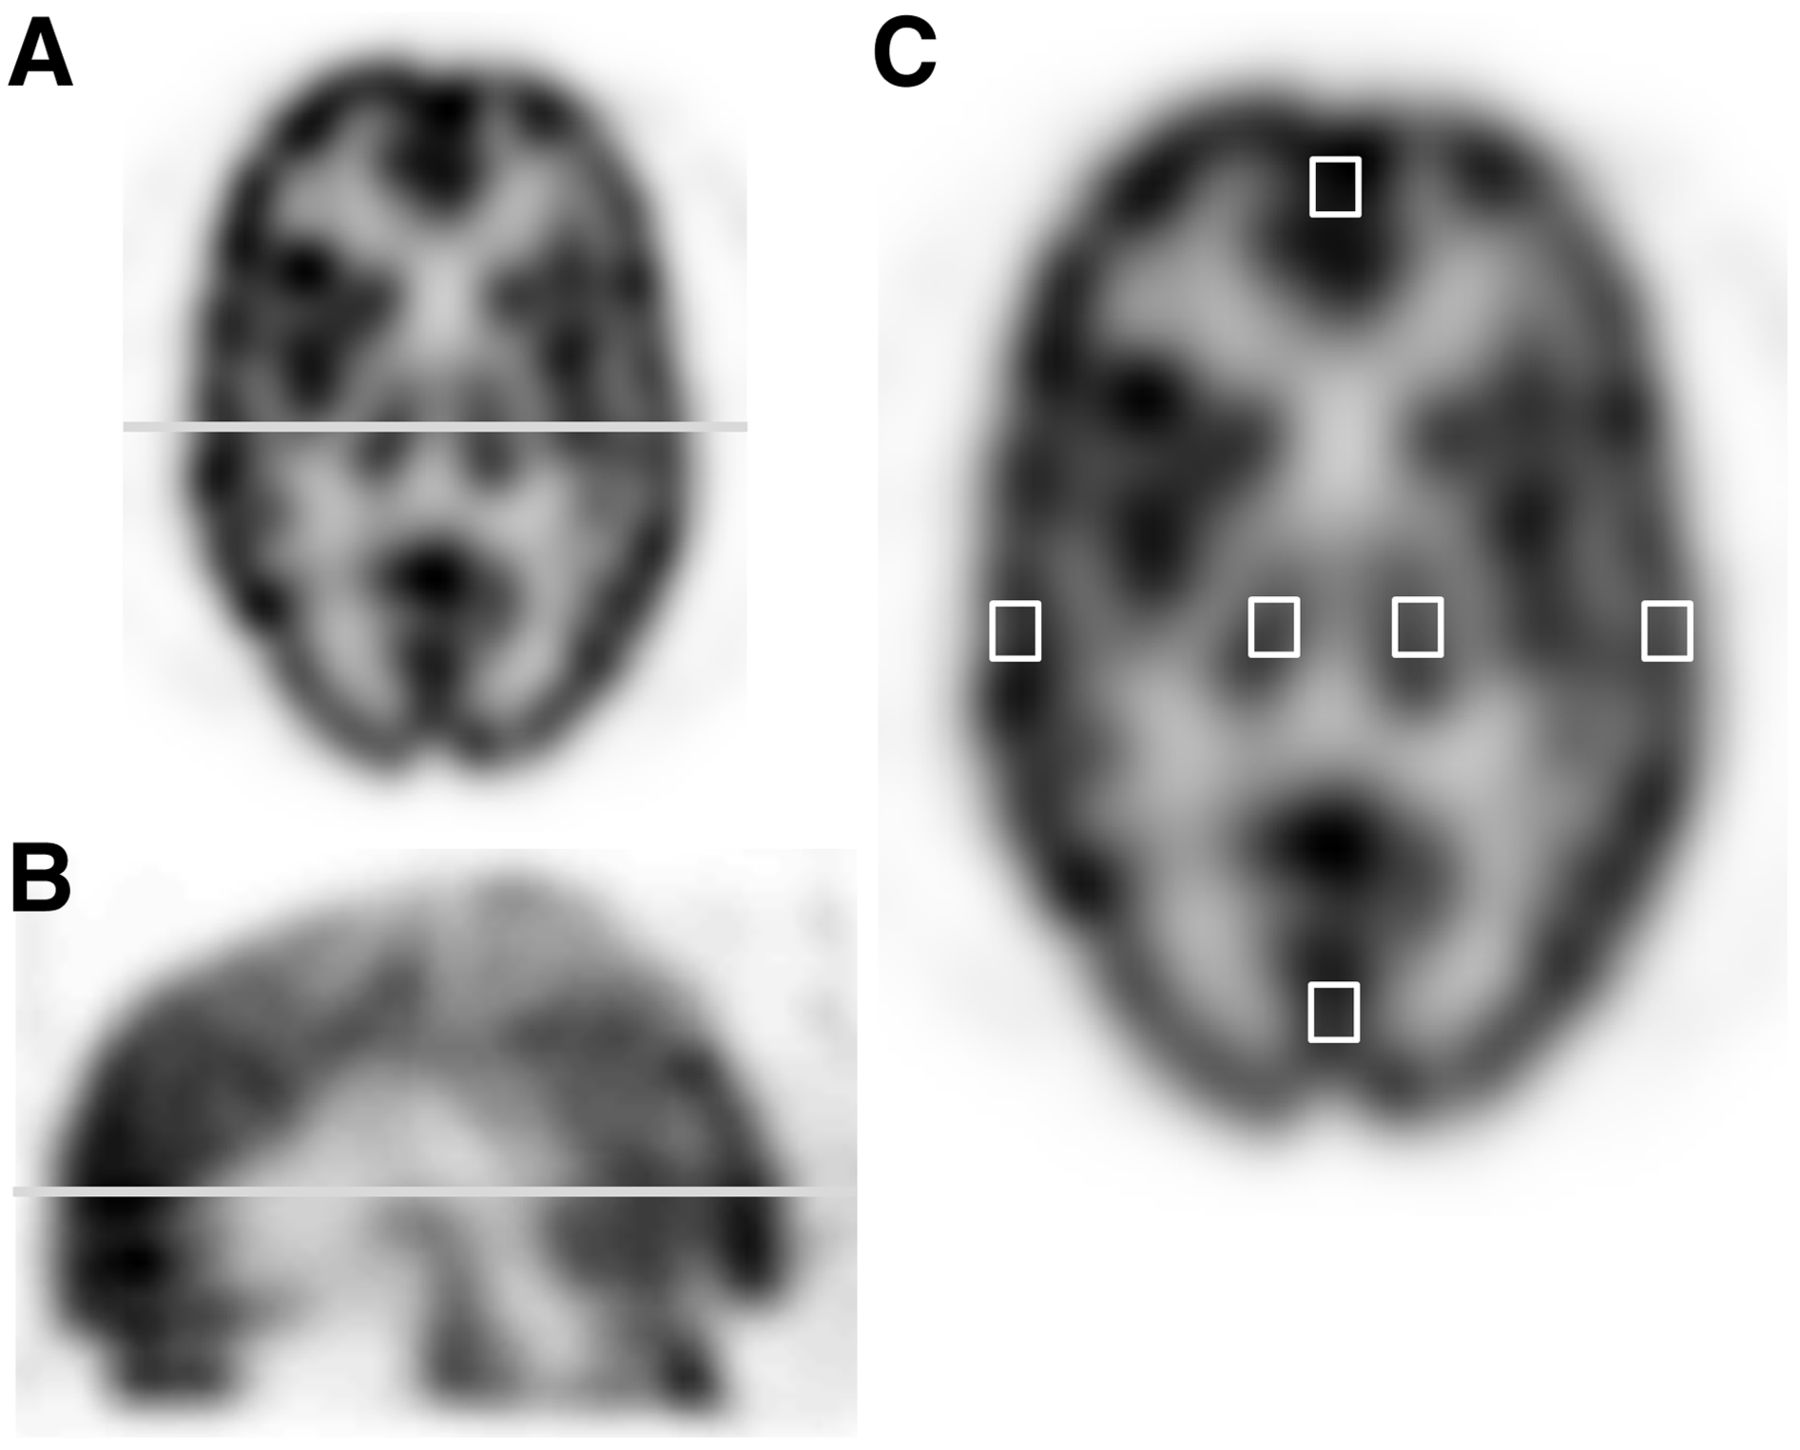
Illustration of brain image setting profile curve line and region of interest. Count profile curve was set on straight line passing between defect and contralateral normal bone: left and right temporal lobe line including thalamus with transversal image (A) and frontal and occipital lobe line with sagittal image (B). (C) Regions of interest set on thalamus and frontal, occipital, right, and left temporal lobes to calculate count ratio.
Brain phantoms with and without a bone were evaluated using the thalamus–to–temporal lobe ratio, which was calculated from average brain counts in square shapes of regions of interest measuring 13 × 13 mm set on the thalamus and temporal lobe of the right and left sides of consecutive 7 brain image slices (Fig. 2C). Furthermore, brain phantoms with and without bone defects were evaluated using the count ratio calculated from the region of interest in the frontal, occipital, right, and left temporal lobes between the defect side and the contralateral normal bone side, which were calculated from Equation 1. Eq. 1where A is the right–to–left lobe ratio for the right temporal bone defect, frontal–to–occipital lobe ratio for the frontal bone defect, or occipital–to–frontal lobe ratio for the occipital bone defect. B and C are average brain counts for normal bone and defective bone sides, respectively.
Statistical Analysis
The count ratios among the thalamus–to–temporal lobe, right and left temporal lobe, frontal–to–occipital lobe, and occipital–to–frontal lobe ratios were analyzed using the Wilcoxon signed-rank test between the phantoms with and those without a bone or those with and without bone defects. In all analyses, a P value of less than 0.05 was considered to indicate statistical significance.
RESULTS
The count profiles of OSEM (NAC), OSEM (Chang), and OSEM (CTAC) are shown in Figure 3. The OSEM (Chang) method has a slightly different right temporal lobe side count with and without a right temporal bone defect. However, the OSEM (CTAC) method showed nearly identical counts (Fig. 3A). Similarly, other bone defects for the OSEM (Chang) method also had different normalized count ratios with and without a bone defect. However, the OSEM (CTAC) method showed a nearly matching value (Figs. 3B and 3C).
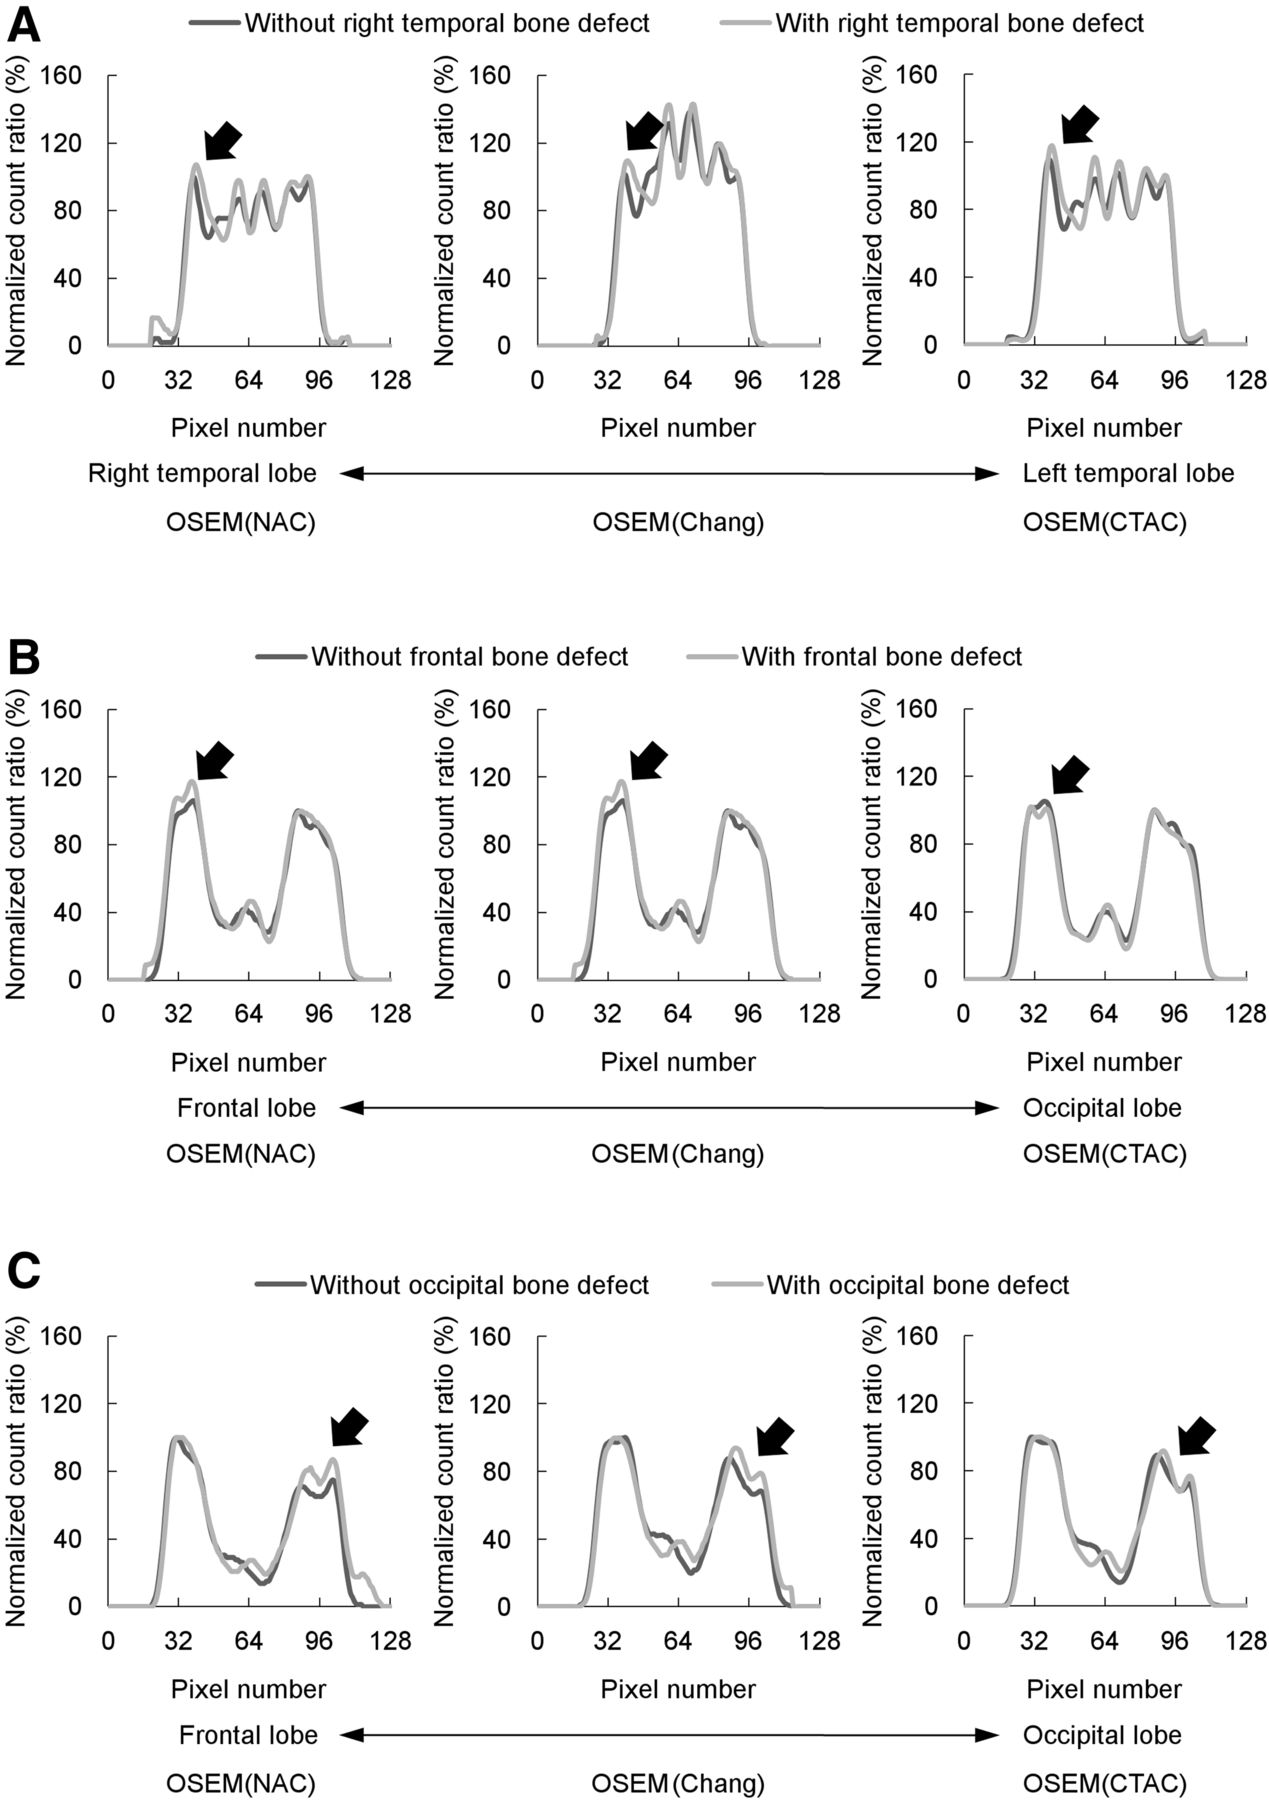
Comparison of a profile curve with and without a bone defect. These graphics show profile curves of brain lobes with and without bone defects of right temporal (A), frontal (B), and occipital (C) bones. Lower pixel number indicates right temporal (A) and frontal lobes (B and C), whereas higher pixel number indicates left temporal (A) and occipital lobes (B and C). Furthermore, graphics on left, middle, and right show OSEM (NAC), OSEM (Chang), and OSEM (CTAC), respectively. Black arrows show part with and without bone defects.
The thalamus–to–temporal lobe ratios among OSEM (NAC), OSEM (Chang), and OSEM (CTAC) were 0.82 ± 0.04, 1.24 ± 0.06, and 0.94 ± 0.05 without a bone and 0.89 ± 0.05, 1.33 ± 0.06, and 0.93 ± 0.08 with a bone, respectively (Fig. 4). In addition, the OSEM (NAC) and OSEM (Chang) with a bone were approximately 7% higher than those for phantoms without bone, which was a significant difference (P = 0.005). However, the ratios for OSEM (CTAC) were nearly equivalent.

Comparison with thalamus–to–temporal lobe ratio with and without bone among 3 methods. Graphics on left, middle, and right show OSEM (NAC), OSEM (Chang), and OSEM (CTAC), respectively.
The count ratios of OSEM (NAC), OSEM (Chang), and OSEM (CTAC) are shown in Figure 5. The right–to–left temporal lobe count ratios among OSEM (NAC), OSEM (Chang), and OSEM (CTAC) were 1.05 ± 0.03, 1.06 ± 0.02, and 1.04 ± 0.02 without a right temporal bone defect, and 1.12 ± 0.02, 1.14 ± 0.02, and 1.02 ± 0.07 with a right temporal bone defect (Fig. 5A). The count ratio of the right temporal lobe with a bone defect was approximately 7% higher than that of the left temporal lobe without a bone defect in OSEM (NAC) and OSEM (Chang) methods, which showed a significant difference (P = 0.02), whereas OSEM (CTAC) had a similar count ratio. The frontal–to–occipital lobe ratio and occipital–to–frontal lobe ratio among OSEM (NAC), OSEM (Chang), and OSEM (CTAC) were 1.11 ± 0.04, 1.14 ± 0.06, and 1.22 ± 0.03 without a frontal bone defect; 1.18 ± 0.14, 1.25 ± 0.16, and 1.21 ± 0.11 with a frontal and bone defect; 0.90 ± 0.03, 0.88 ± 0.04, and 0.82 ± 0.02 without an occipital bone defect; and 0.99 ± 0.10, 0.95 ± 0.10, and 0.82 ± 0.05 with an occipital bone defect, respectively (Figs. 5B and 5C). The count ratio of both frontal and occipital lobes with bone defects was found to be 5%–10% higher than in frontal and occipital lobes without bone defects when OSEM (NAC) and OSEM (Chang) were used; however, OSEM (CTAC) had nearly identical frontal or occipital lobe counts with and without a bone defect. Furthermore, OSEM (NAC) and OSEM (Chang) when phantoms with and without an occipital bone defect were compared and OSEM (Chang) when phantoms with and without a frontal bone defect were compared showed significant differences (OSEM [NAC] with and without an occipital bone defect evaluation; P = 0.03, OSEM [Chang] both frontal and occipital bone defect evaluations; P = 0.04).

Comparison of count ratios of brain lobes with and without a bone defect. Graphics show right–to–left temporal lobe ratio (A), frontal–to–occipital lobe ratio (B), and occipital–to–frontal lobe ratio (C) with and without bone defect. Furthermore, graphics on left, middle, and right show OSEM (NAC), OSEM (Chang), and OSEM (CTAC) corrected values, respectively.
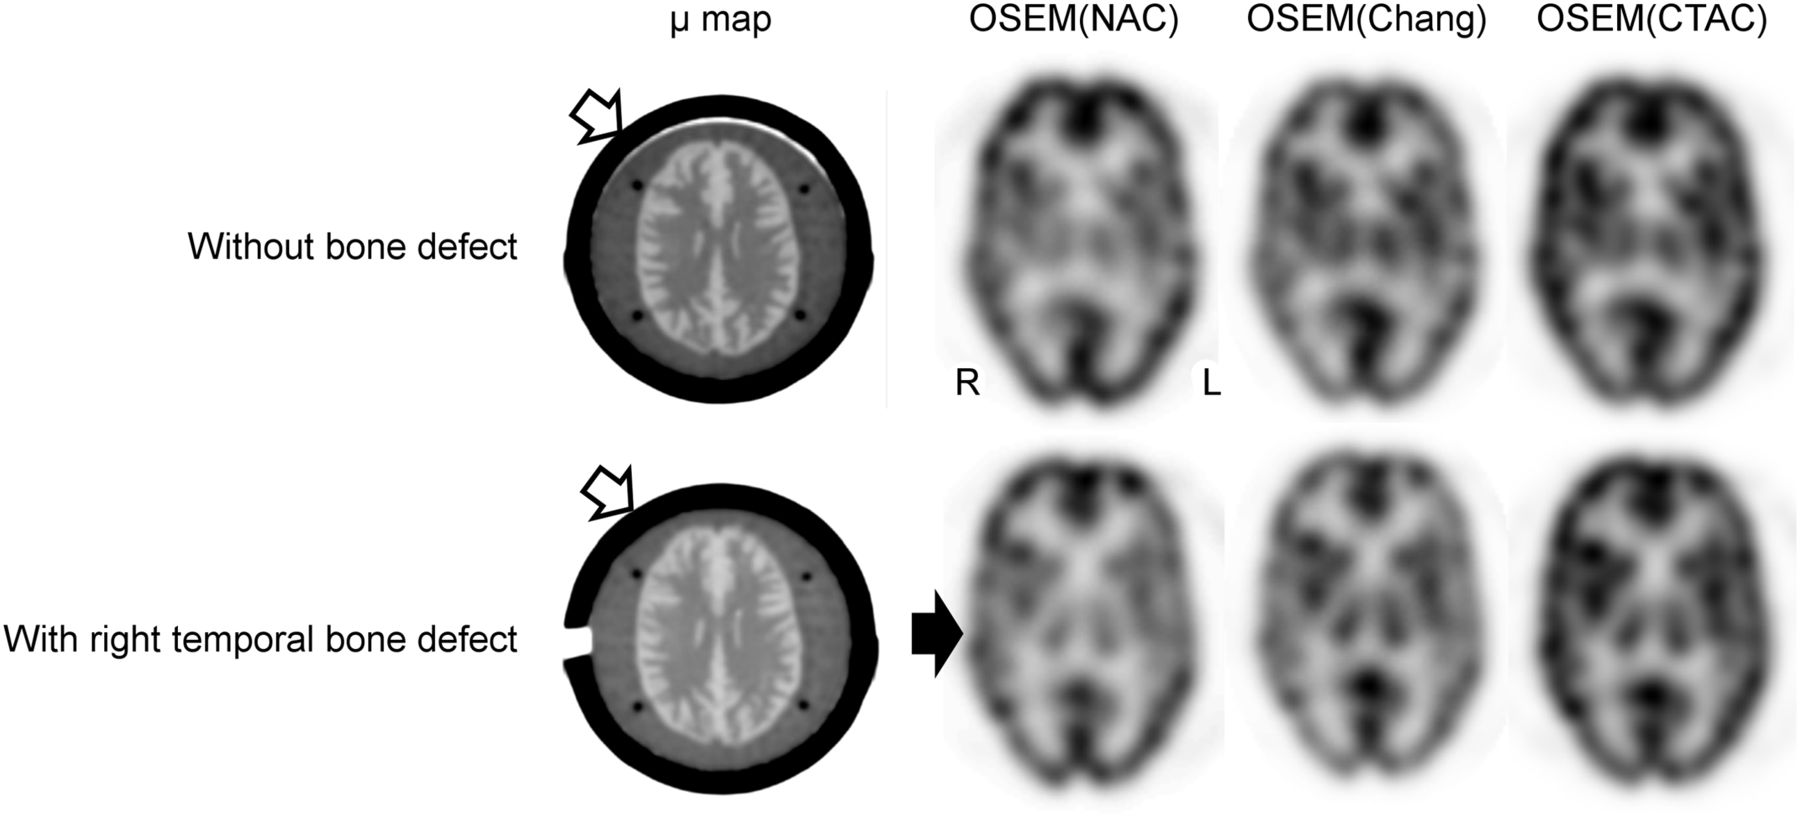
The transversal and μ-map images with and without a right temporal bone defect are shown in Figure 6, and the sagittal and μ-map images with and without a frontal or occipital bone defect are shown in Figure 7.

SPECT images obtained by the 3 methods, and μ-map image with and without a bone defect. Upper and lower images show brain perfusion images without bone defect and with right temporal bone defect. Black and white arrows indicate bone defect area and simulated bone.

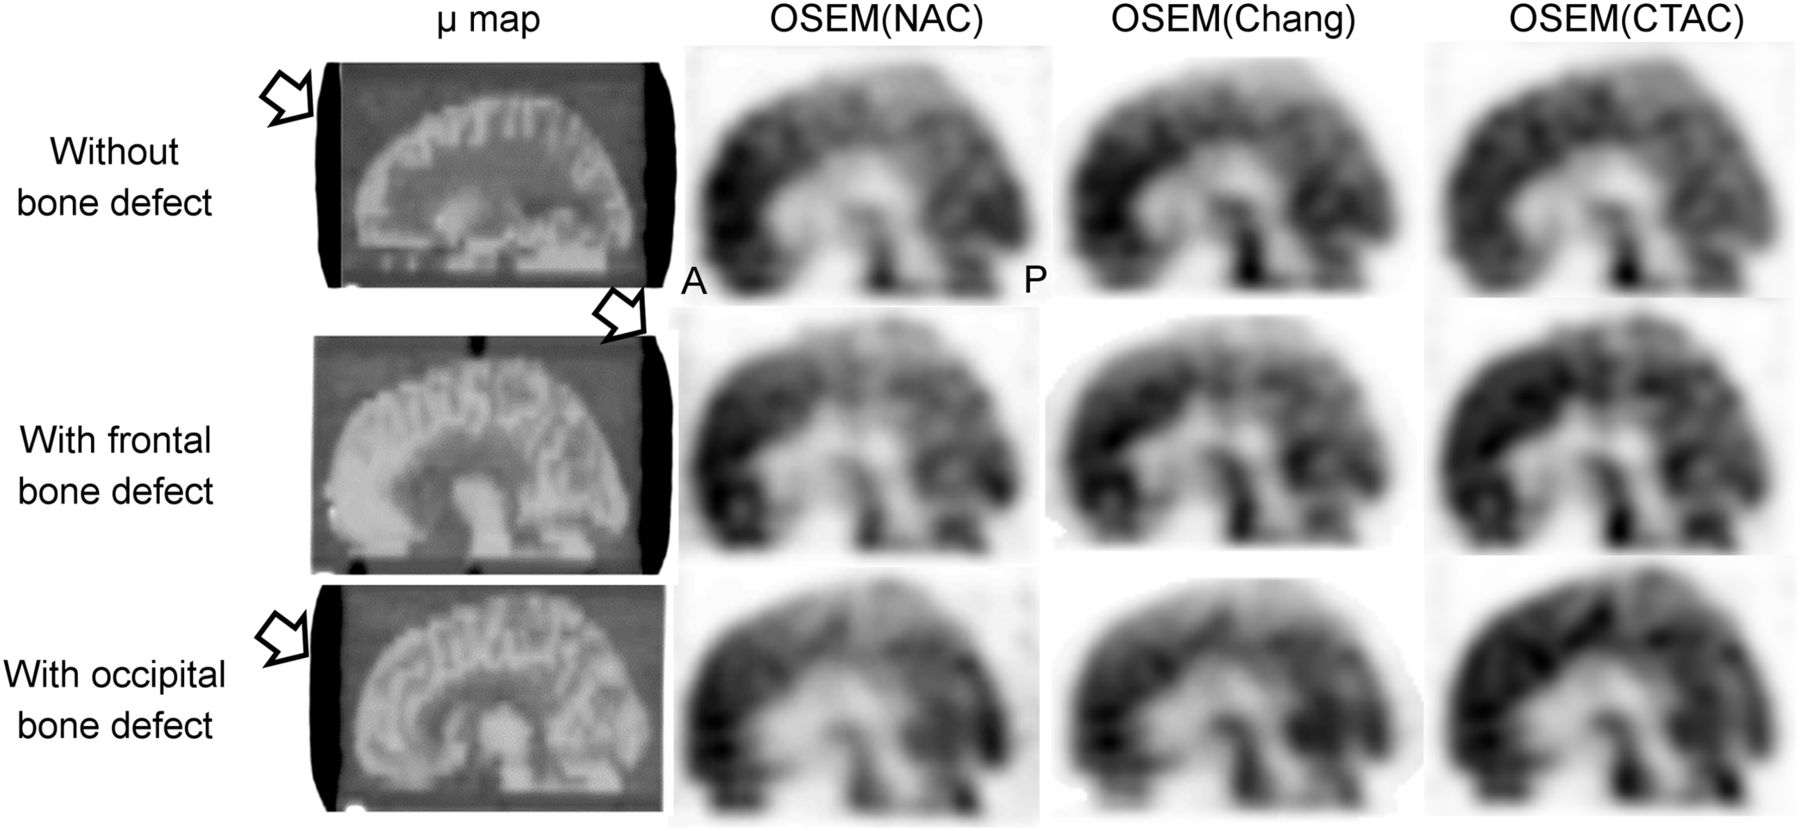
Sagittal SPECT images obtained by the 3 methods, and μ-map image with and without bone defect. Upper, middle, and lower images show brain perfusion images without bone defect, with frontal bone defect, and with occipital bone defect, respectively. Frontal and occipital bone defects are located in entire area of indicated sagittal slice (white arrow).
DISCUSSION
Brain perfusion SPECT images are affected by physical and geometric phenomena, and these phenomena must be corrected to accurately image brain perfusion distribution. Because of the nonuniform structures of head and attenuation material, such as a table or a head holder, the Chang method can cause errors in quantitative accuracy.
CTAC was developed to correct the attenuation of nonuniform structures to improve errors in AC. However, if SPECT and CT images are acquired separately, the regional CBF (rCBF) value may change by the influence of the misregistration artifact. Larsson et al. have reported the registration accuracy of CTAC map and SPECT images using a landmark, and a mismatch of the CTAC map and SPECT image was 1–3 mm, causing the errors in rCBF value up to 6.3% (11). Therefore, the CTAC map and SPECT image have to be correctly registered. A SPECT/CT system combining CT and SPECT scanners is widely used, and thus the misregistration artifact markedly decreased, compared with imaging using separate SPECT and CT scanners. Therefore, we evaluated the influence of attenuation for a brain perfusion SPECT–simulated abnormal cranium after burr-hole surgery using combined a CT and SPECT scanner, and the influence of misregistration was not evaluated.
Normalized counts between phantoms with and without a bone have differences of approximately 7% between OSEM (NAC) and OSEM (Chang). Many previous phantom studies were conducted using brain phantoms without a bone, which may lead to measurement errors during quantitative analysis (20,21). Therefore, a phantom study using a simulated bone structure of a human head was conducted to match parameters evaluated in a clinical study.
When brain counts with and without a bone defect were compared, it was found that brain counts on the bone defect side were 5%–10% higher than those without a bone defect when OSEM (NAC) was used, indicating the impact of a bone defect on brain counts. Brain counts of OSEM (Chang) with and without a bone defect indicated a tendency similar to OSEM (NAC) due to uniform attenuation coefficient correction. Thus, the Chang method did not accurately correct for nonuniform attenuation material such as the bone and gray and white matters; in particular, brain counts with and without a bone defect were strongly affected as shown in Figure 3 (4,8). Furthermore, brain counts of the occipital lobe with OSEM (NAC) and OSEM (Chang) were lower than that of the frontal lobe because of the attenuation of a head holder, which displays a similar tendency as in previous studies (5). However, OSEM (CTAC) generated almost matching brain counts with and without a bone defect; in addition, CTAC could accurately correct attenuation of the head holder. Consequently, OSEM (CTAC) can accurately correct AC for brain counts, regardless of the absence or presence of bone defects. In particular, we recommend brain perfusion SPECT with OSEM (CTAC) correction for the imaging of regions with an abnormal bone structure.
This study had some limitations. First, although our phantom could simulate the bone structure outside the brain, it could not create distinctions of petrous and sphenoid bones such as in the 3-dimensional brain phantom developed by Iida et al. (18), whereas their 3-dimensional brain phantom could not simulate an abnormal bone structure. Therefore, we used a brain phantom covered with calcium sulfate, which has the advantage of changing the location of the bone defect, and we could demonstrate the influence of bone attenuation using brain phantoms simulating frontal, occipital, and right temporal bone defects. Second, we could not conduct a clinical evaluation to validate our findings. The Patlak plot method is widely used in the quantitative analysis of brain perfusion SPECT using a 99mTc agent, and the rCBF value was calculated from brain count ratios of the reference and regional areas using Lassen’s correction algorithm (22–25). If the reference and regional areas had the difference with and without a bone structure, the rCBF calculated from attenuation correction using the Chang method will be uncorrected, whereas it will be corrected using the CTAC method because this method could demonstrate the accurate AC for brain SPECT in a head with an abnormal bone structure. These limitations will need to be addressed, and the results will need to be validated in future research.
CONCLUSION
We conducted a phantom study simulation for brain SPECT in heads with and without a bone defect to demonstrate the influence of brain counts between 2 different AC methods. Although the Chang method did not correct the influence of a bone defect due to the uniform attenuation coefficient, the CTAC method could correctly perform AC regardless of the presence of a bone defect.
DISCLOSURE
No potential conflict of interest relevant to this article was reported.
Footnotes
Published online Jul. 13, 2017.
REFERENCES
- Received for publication March 8, 2017.
- Accepted for publication June 20, 2017.


Jump to section
Related Articles
Cited By...
- No citing articles found.