


Abstract
The purposes of this study were to characterize the performance of a 3-dimensional (3D) ordered-subset expectation maximization (OSEM) algorithm in the quantification of left ventricular (LV) function with 99mTc-labeled agent gated SPECT (G-SPECT), the QGS program, and a beating-heart phantom and to optimize the reconstruction parameters for clinical applications. Methods: A G-SPECT image of a dynamic heart phantom simulating the beating left ventricle was acquired. The exact volumes of the phantom were known and were as follows: end-diastolic volume (EDV) of 112 mL, end-systolic volume (ESV) of 37 mL, and stroke volume (SV) of 75 mL; these volumes produced an LV ejection fraction (LVEF) of 67%. Tomographic reconstructions were obtained after 10–20 iterations (I) with 4, 8, and 16 subsets (S) at full width at half maximum (FWHM) gaussian postprocessing filter cutoff values of 8–15 mm. The QGS program was used for quantitative measurements. Results: Measured values ranged from 72 to 92 mL for EDV, from 18 to 32 mL for ESV, and from 54 to 63 mL for SV, and the calculated LVEF ranged from 65% to 76%. Overall, the combination of 10 I, 8 S, and a cutoff filter value of 10 mm produced the most accurate results. The plot of the measures with respect to the expectation maximization–equivalent iterations (I × S product) revealed a bell-shaped curve for the LV volumes and a reverse distribution for the LVEF, with the best results in the intermediate range. In particular, FWHM cutoff values exceeding 10 mm affected the estimation of the LV volumes. Conclusion: The QGS program is able to correctly calculate the LVEF when used in association with an optimized 3D OSEM algorithm (8 S, 10 I, and FWHM of 10 mm) but underestimates the LV volumes. However, various combinations of technical parameters, including a limited range of I and S (80–160 expectation maximization–equivalent iterations) and low cutoff values (≤10 mm) for the gaussian postprocessing filter, produced results with similar accuracies and without clinically relevant differences in the LV volumes and the estimated LVEF.
Iterative reconstruction algorithms were recently proposed as a new potential tool for increasing the quality of tomographic images in nuclear medicine. Protocols based on ordered-subset expectation maximization (OSEM) have become the dominant iterative reconstruction procedures in SPECT and PET. The performance of OSEM was compared with that of filtered backprojection (FBP) in several experimental and clinical studies (1–5); OSEM was shown to have better noise properties and higher image contrast and resolution. On the other hand, even though iterative protocols were suggested for cardiac SPECT in the recent European Association of Nuclear Medicine/European Society of Cardiology guidelines (6), controversial results were reported when myocardial perfusion and left ventricular (LV) function were assessed by different iterative methods (maximum-likelihood expectation maximization, iterative-weighted, and 2-dimensional OSEM) (7–16). Standardization of these protocols has not been proposed yet.
The aims of this study were to characterize, with a beating-heart phantom having known volumes, the performance of a 3-dimensional (3D) OSEM algorithm with 3D gaussian postreconstruction filtering for the quantification of LV function by 99mTc-labeled agent gated SPECT (G-SPECT) with the QGS program (Cedars-Sinai Medical Center) and various numbers of subsets (S), iterations (I), and filter cutoff values and to optimize the parameters for clinical applications.
MATERIALS AND METHODS
The G-SPECT acquisition of a dynamic heart phantom simulating the beating left ventricle (BSI) was obtained at the Department of Nuclear Medicine, Center Hospitalier Universitaire Vaudois and University of Lausanne, Lausanne, Switzerland. The dynamic heart phantom is part of an anthropomorphic torso phantom and comprises a membrane unit and a pump–control unit. In the membrane unit, the left ventricle of the heart is anatomically simulated by a double elastic membrane that, because of its position, has 2 compartments; the inner one, filled with saline solution, represents the ventricular cavity, and the outer one, enclosed between the 2 flexible silicone membranes, represents the heart wall. The external pump–control unit ensures controlled compression and decompression of the interior membrane, providing a change in the volume of the inner compartment. The pumping frequency is adjustable up to 70 cycles per minute. The pumping event simulates the cardiac cycle, and an appropriate electrocardiographic (ECG) trigger signal is generated. The volumes of the cardiac phantom, as provided by the manufacturer, are as follows: end-diastolic volume (EDV), 112 mL; end-systolic volume (ESV), 37 mL; and stroke volume (SV), 75 mL. The corresponding value for the LV ejection fraction (LVEF) is 67% (Fig. 1]).
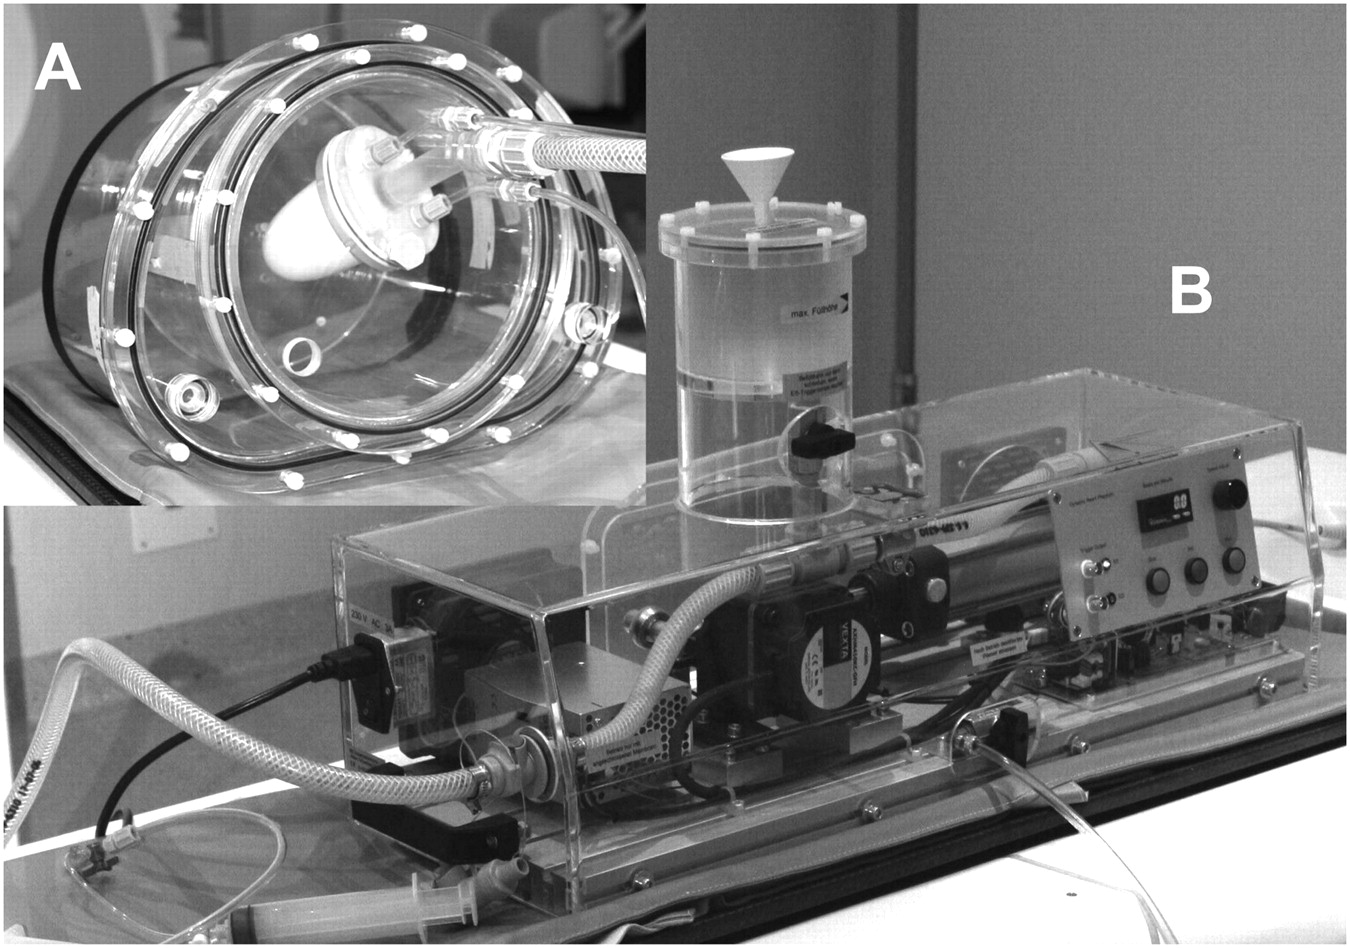
Elements of cardiac phantom used in this study. (A) Torso-anthropomorphic phantom with dynamic insert simulating beating left ventricle. (B) External pump-control unit.
The heart wall chamber of the dynamic heart phantom was filled with 30 MBq of 99mTc. It was imaged by use of a 2-head γ-camera (ECAM; Siemens Medical Systems, Inc.) in 90° geometry and equipped with a low-energy high-resolution parallel-hole collimator. Sixty-four images were obtained from 32 angular positions with a 64 × 64 matrix (pixel dimension, 6.59 mm) and an acquisition time of 40 s per step throughout a 180° arc beginning from the 45° right anterior oblique projection and ending at the 45° left posterior oblique projection. The ECG G-SPECT acquisition was performed at a heartbeat frequency of 60 beats per minute with 8 frames per RR interval at each angular step. The protocol was the same as that used in our clinical applications, but the acquisition time was increased and tailored to collect from the cardiac area several counts similar to those routinely obtained in patients (1.5–2.8 kilocounts per frame for the different angular steps). Because of the absence of extracardiac activity, the images of the thorax phantom had heart-to-background count ratios that were higher than those obtained in clinical scenarios but had comparable myocardial wall–to–ventricular cavity count ratios.
Tomographic reconstructions were performed on an E-Soft system workstation (Siemens Medical Systems, Inc.) at the Department of Nuclear Medicine and PET/CT Centre, Oncology Institute of Southern Switzerland, Bellinzona, Switzerland. Transaxial slices with a thickness of 6.59 mm were reconstructed with 3D OSEM–based protocols and postfiltered with a symmetric 3D gaussian function (17). Tomographic reconstructions were obtained with different parameters (10, 12, 15, and 20 iterations; 4, 8, and 16 subsets; and FWHM filter cutoff values of 8, 10, 12, and 15 mm) to determine the best combination for the correct estimation of the phantom parameters (Fig. 2). In OSEM reconstructions, the effects of subset and iteration numbers should be additive over the image characteristics (18). Thus, for simplification purposes, we chose to describe the different (I and S) combinations by using the expectation maximization–equivalent (EM-equivalent) iterations (defined as the product of iterations times subsets [I × S product]). The same angles for cardiac reorientation were maintained during all reconstruction processes.
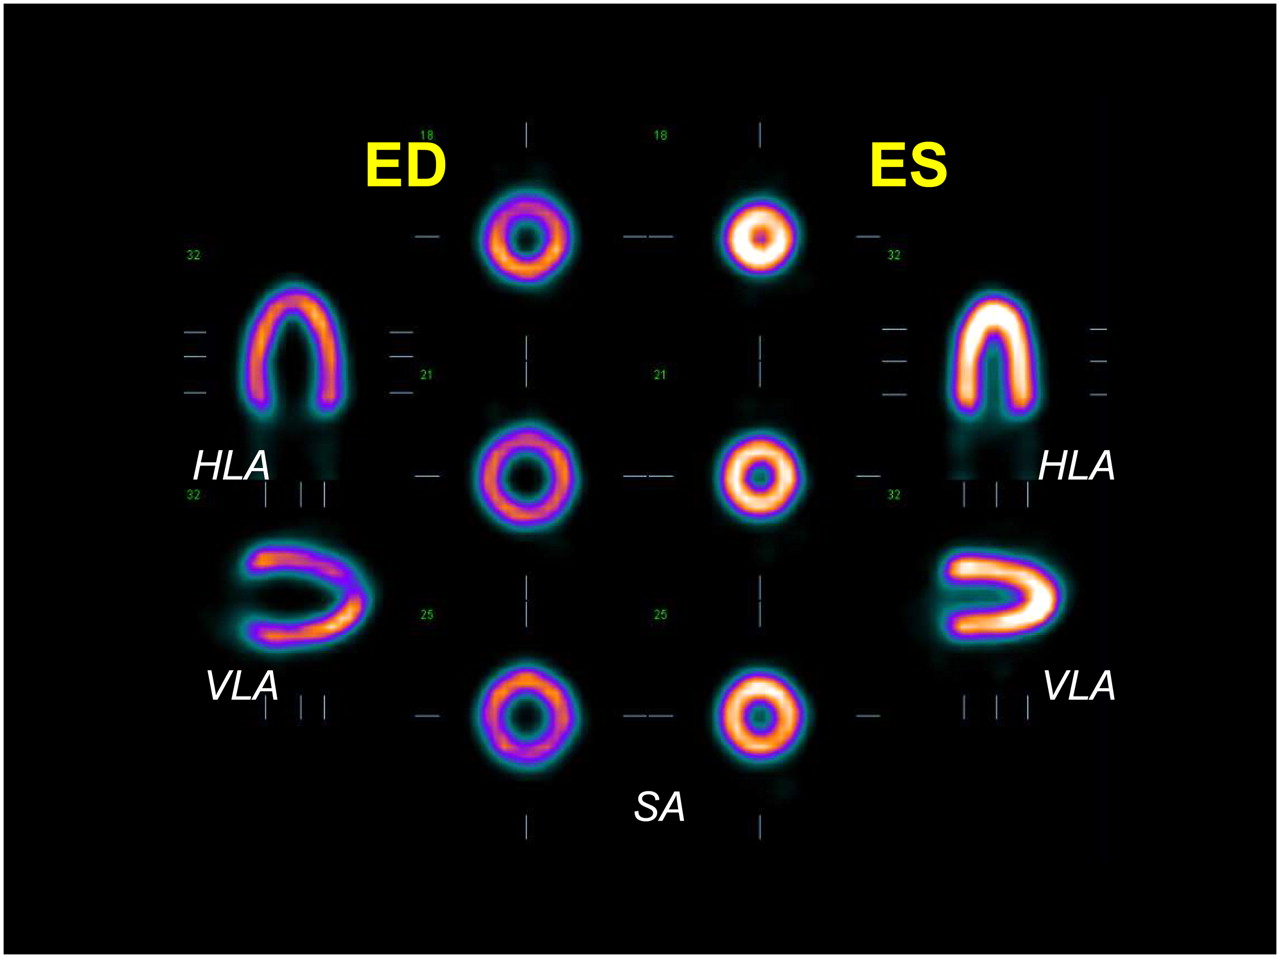
End-diastolic (ED) and end-systolic (ES) representative tomographic slices reoriented along major cardiac axes (short axis [SA], vertical long axis [VLA], and horizontal long axis [HLA]) obtained from reconstruction of G-SPECT phantom study with 3D OSEM iterative protocol.
The standard QGS program (version 2007-0.0.6.5.9.1) was used to measure the cardiac volumes and estimate the ejection fraction from each set of reconstructed gated images. The EDV, ESV, SV, and LVEF were automatically calculated. To better analyze the effects of the various combinations of OSEM parameters on the characteristics of the reconstructed images, we estimated the noise level in the myocardial wall and the contrast obtained between the ventricular wall and cavity as follows.
Noise
The mean myocardial counts (M) and corresponding SDs (SD) were determined from a ring-shaped, 3-pixel-thick region of interest (ROI) placed over the myocardium. Noise was assessed as the percentage root-mean-square [100 × (SD/M)] (18). The same midventricular end-diastolic (frame 1) short-axis slice was selected for each set of reconstructed data.
Contrast
On the same midventricular end-diastolic (frame 1) short-axis slice, a second ROI (3 × 3 pixels) was drawn at the center of the ventricular cavity. The signal and background counts were defined as the average pixel values in the myocardial (ring-shaped) ROI and in the ventricular cavity ROI, respectively. Contrast was defined as (signal − background)/background.
The results were expressed as mean ± SD.
RESULTS
The number of EM-equivalent iterations of the various combinations of parameters ranged from 40 (4 S × 10 I) to 320 (16 S × 20 I). An increase in the number of EM-equivalent iterations produced higher contrast and increased the noise level in the myocardial wall (Fig. 3). Contrast and noise showed an almost linear relationship over lower EM-equivalent iterations; this relationship became quite flat at higher EM-equivalent iterations.
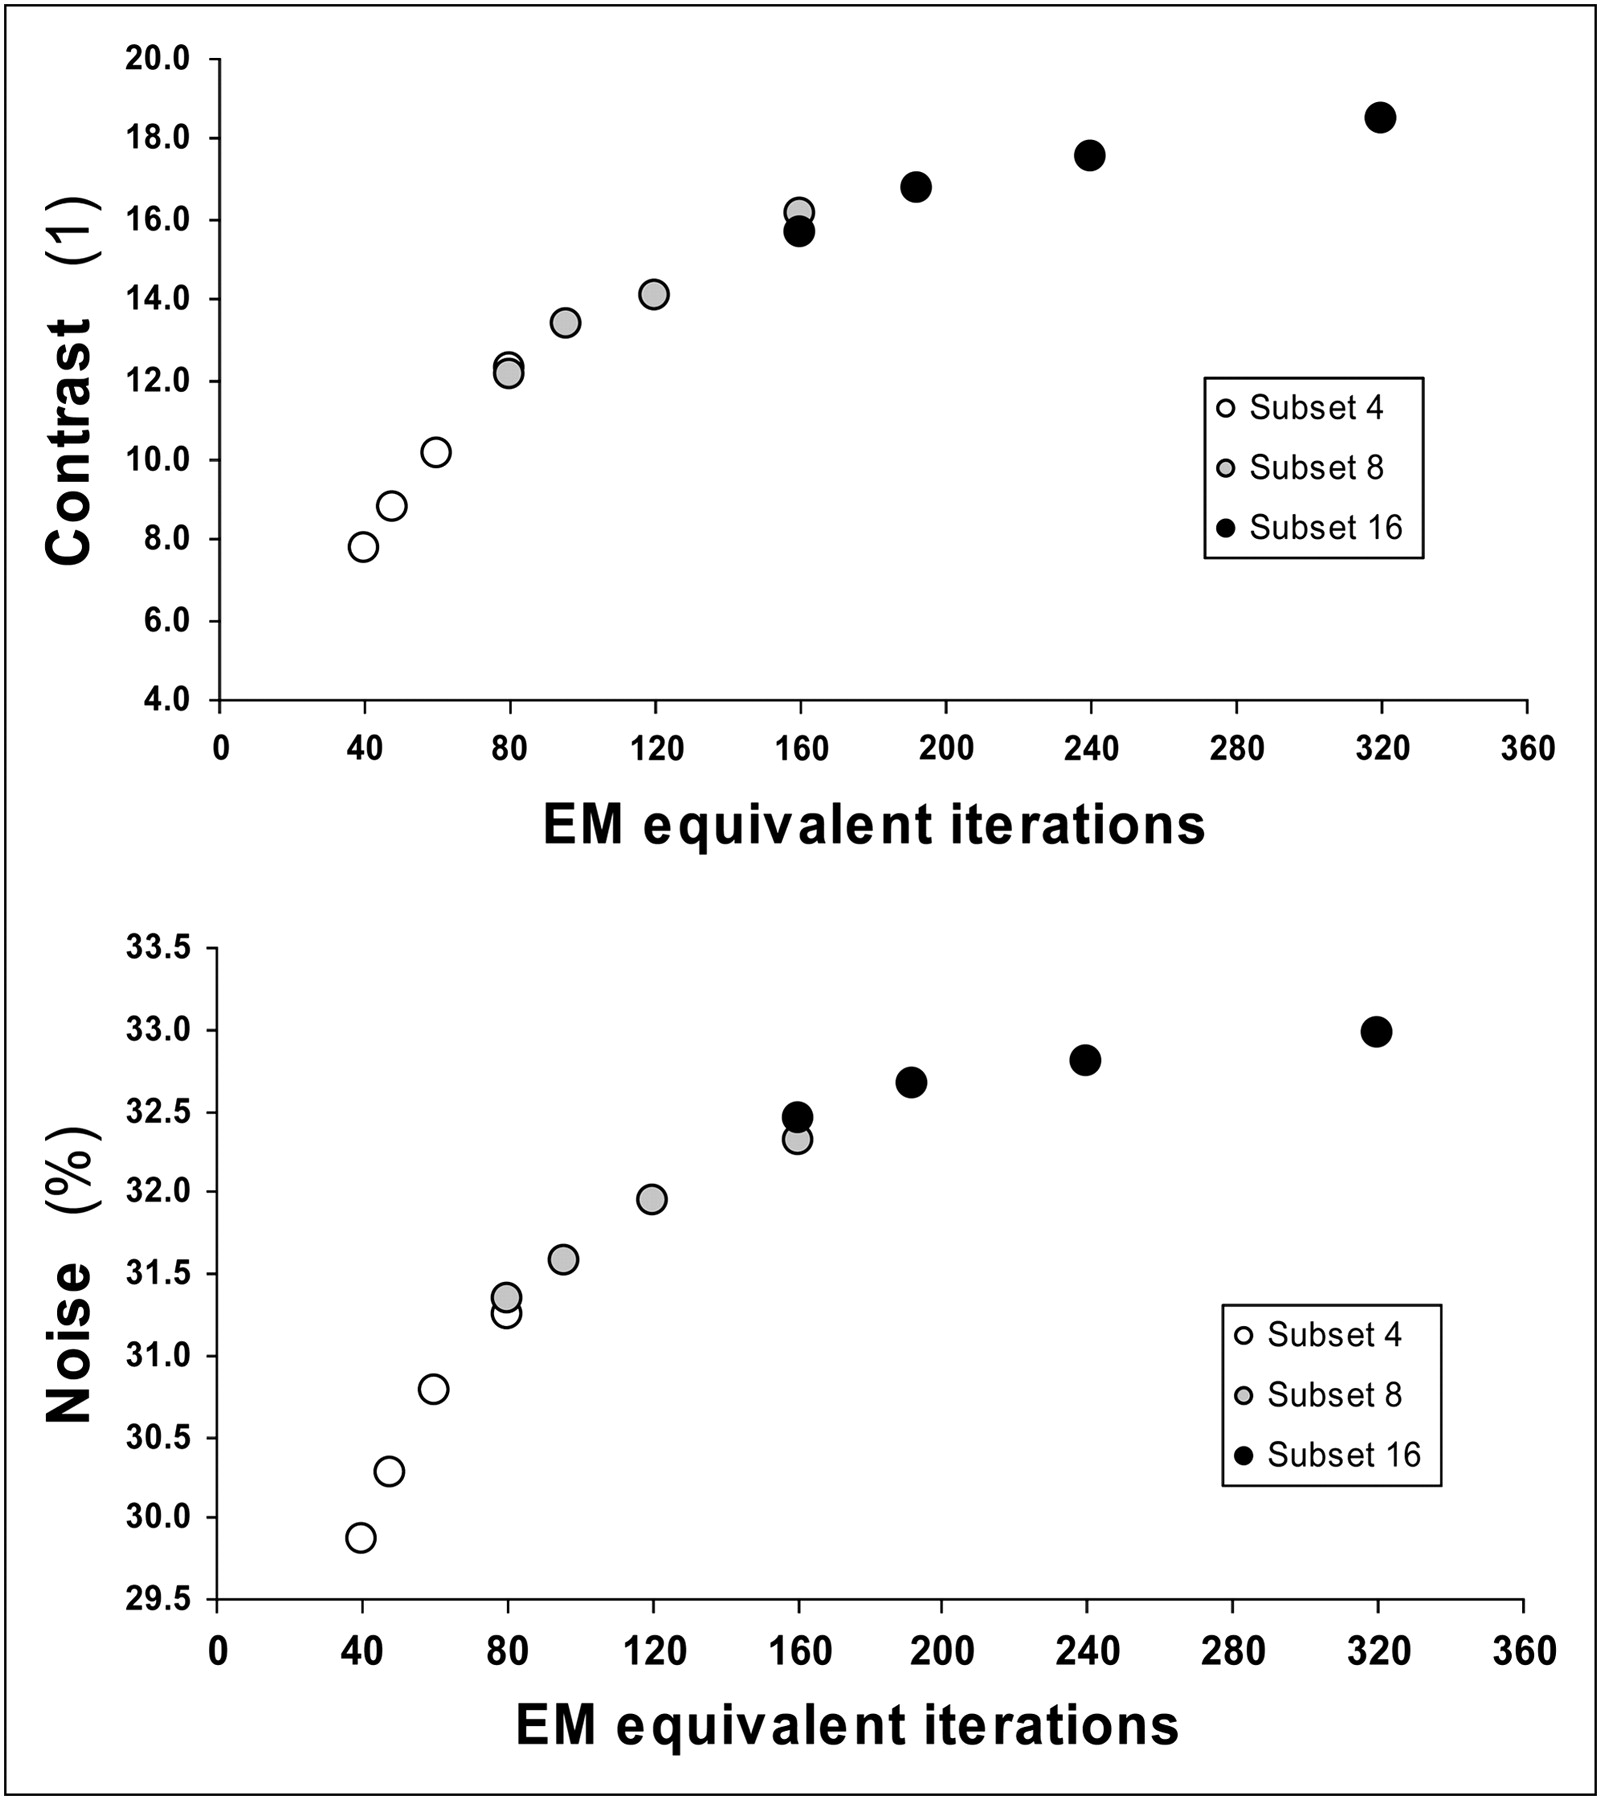
Measured contrast and noise for various EM-equivalent iterations (I × S product) with fixed gaussian postprocessing filter FWHM value of 10 mm.
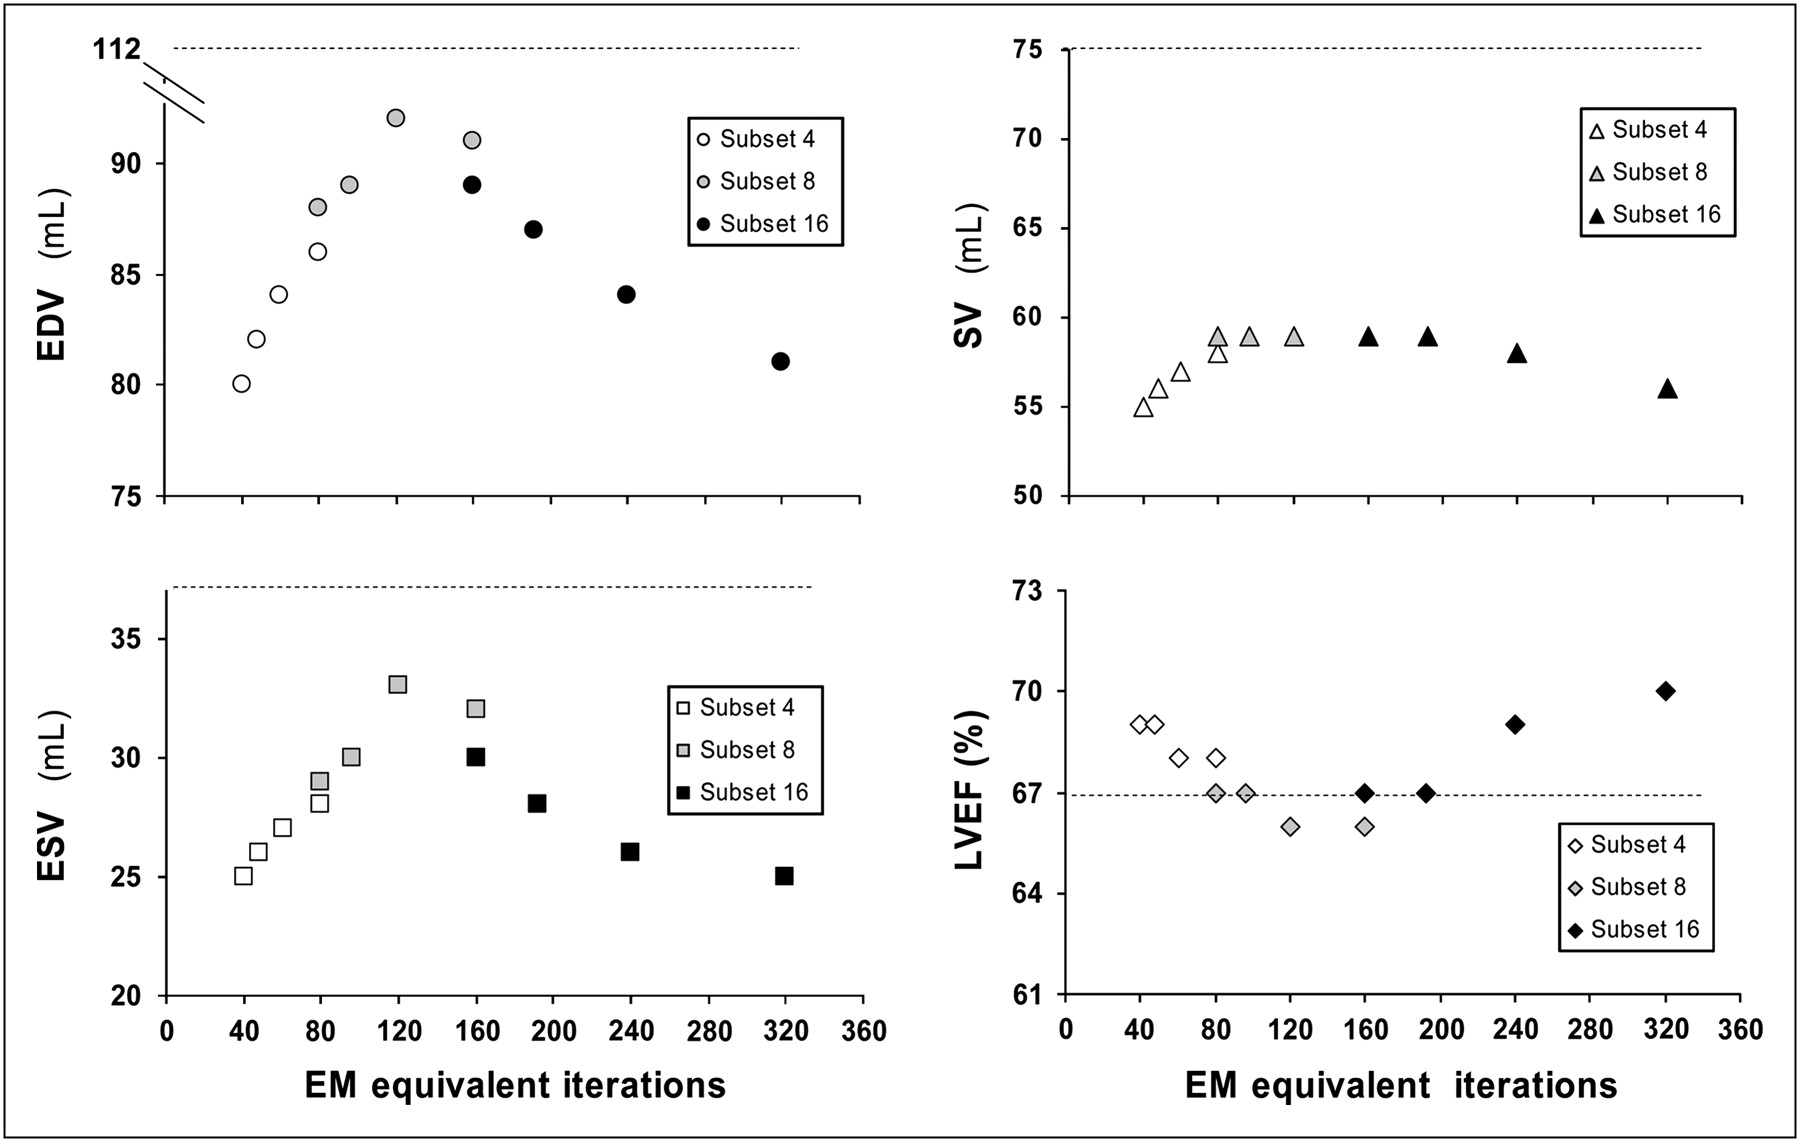
The LV function results obtained with the QGS software demonstrated a systematic underestimation of the LV volumes, with values ranging from 72 to 92 mL (differences of −36% to −18% with respect to the true volumes) for EDV, from 18 to 32 mL (differences of −51% to −14%) for ESV, and from 54 to 63 mL (differences of −28% to −16%) for SV. The plot of the measures of the 3 volumes revealed a bell-shaped curve, with higher values at the intermediate range of EM-equivalent iterations (80–160), as shown in Figure 4. Within this range of EM-equivalent iterations, we found comparable results without important differences among the combinations (EDV, 91 ± 2 mL; ESV, 30.5 ± 1.5 mL; SV, 60 ± 1.7 mL) and obtained a correct calculation of the LVEF (67% ± 0.5%). The calculated LVEF ranged from 65% to 76% and was represented by a U-shaped curve with respect to the LV volumes, with lower central values and relative overestimations at the extremes of the EM-equivalent iterations used (Fig. 4).

Measured EDV, ESV, SV, and corresponding LVEF with various EM-equivalent iterations (I × S product) and fixed gaussian postprocessing filter FWHM value of 10 mm. Dotted lines represent actual values for EDV, ESV, SV, and LVEF of cardiac phantom.
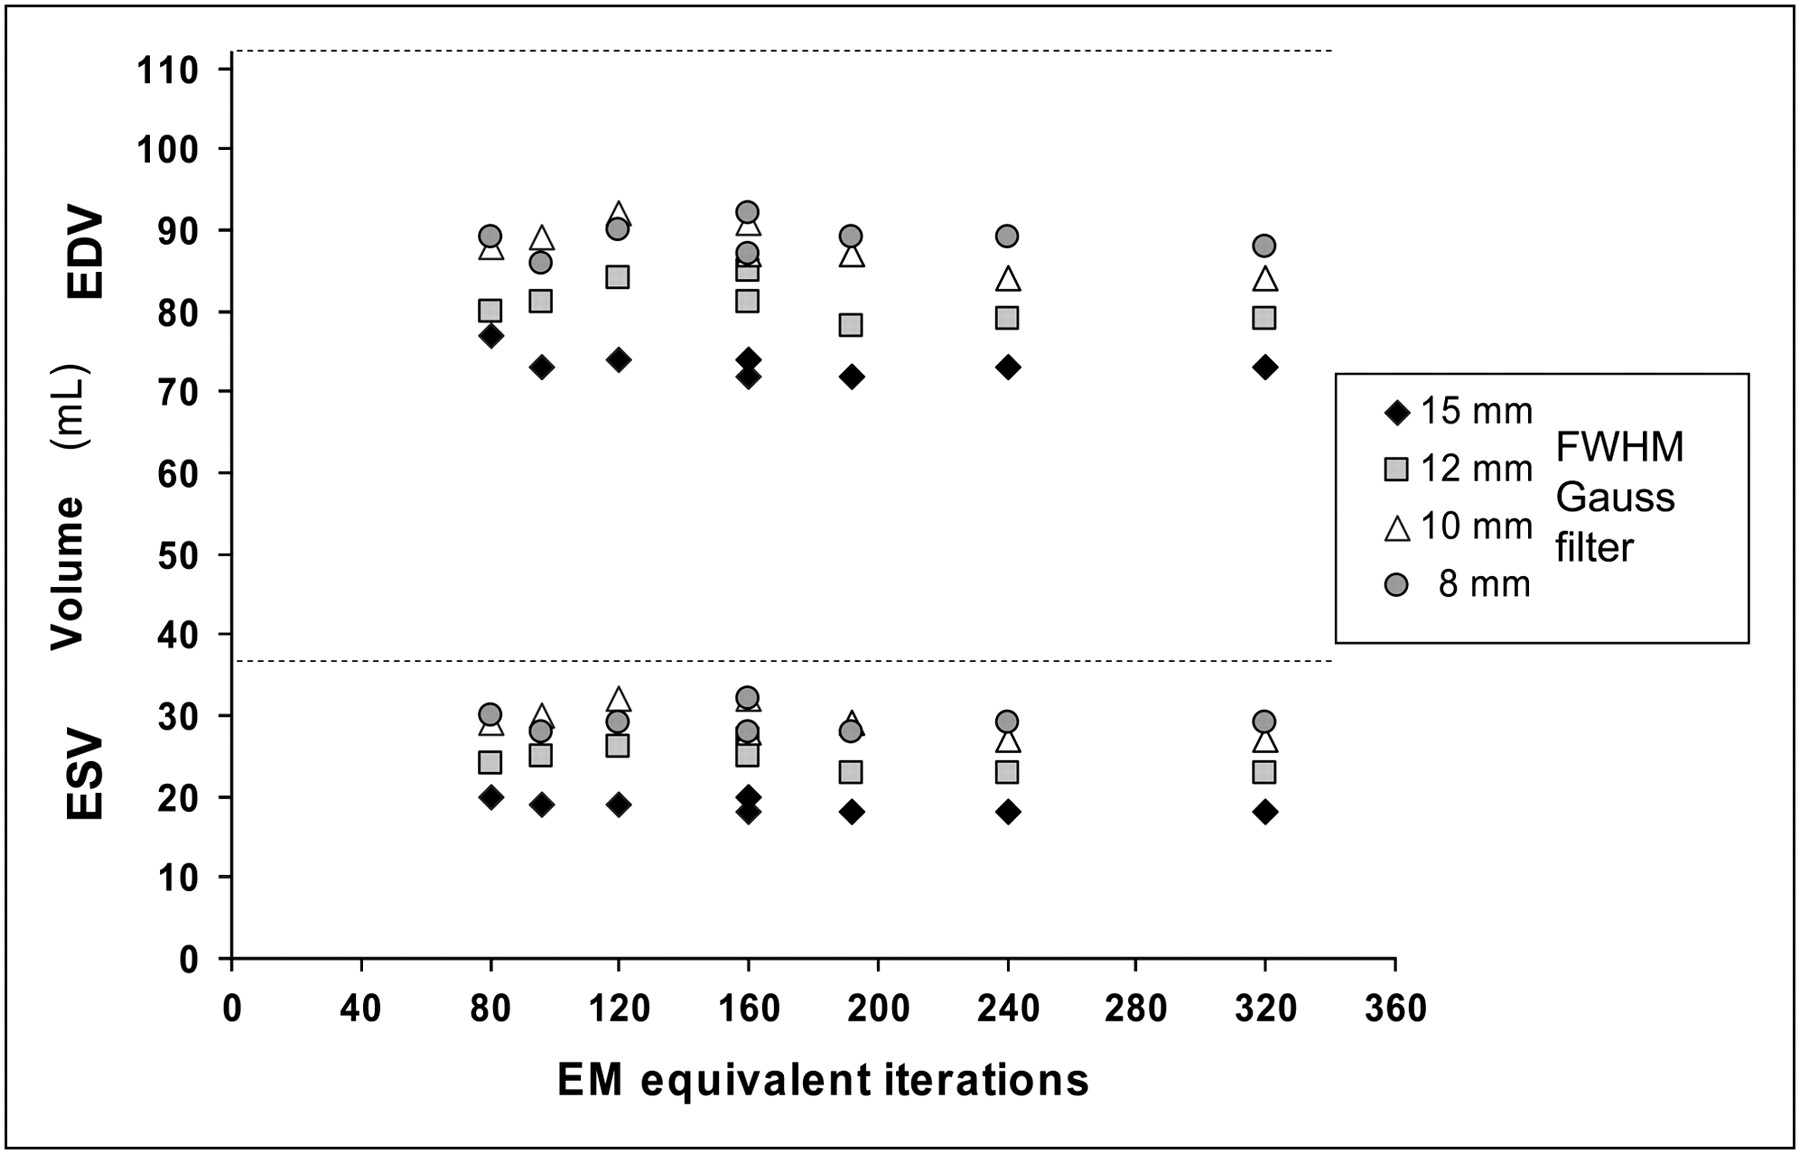
The cutoff value for the gaussian filter significantly affected the underestimation of the cardiac volumes. FWHM values of 8 and 10 mm had similar effects, whereas increasing the FWHM values to 12 and 15 mm resulted in progressive reductions in the calculated LV volumes regardless of the combinations of S and I used (Fig. 5). Moreover, FWHM values exceeding 10 mm caused a clear overestimation of the LVEF (Fig. 6).

Measured LV volumes (EDV and ESV) with different gaussian postprocessing filter FWHM values for various EM-equivalent iterations (I × S product). Dotted lines represent actual values for EDV and ESV of cardiac phantom.
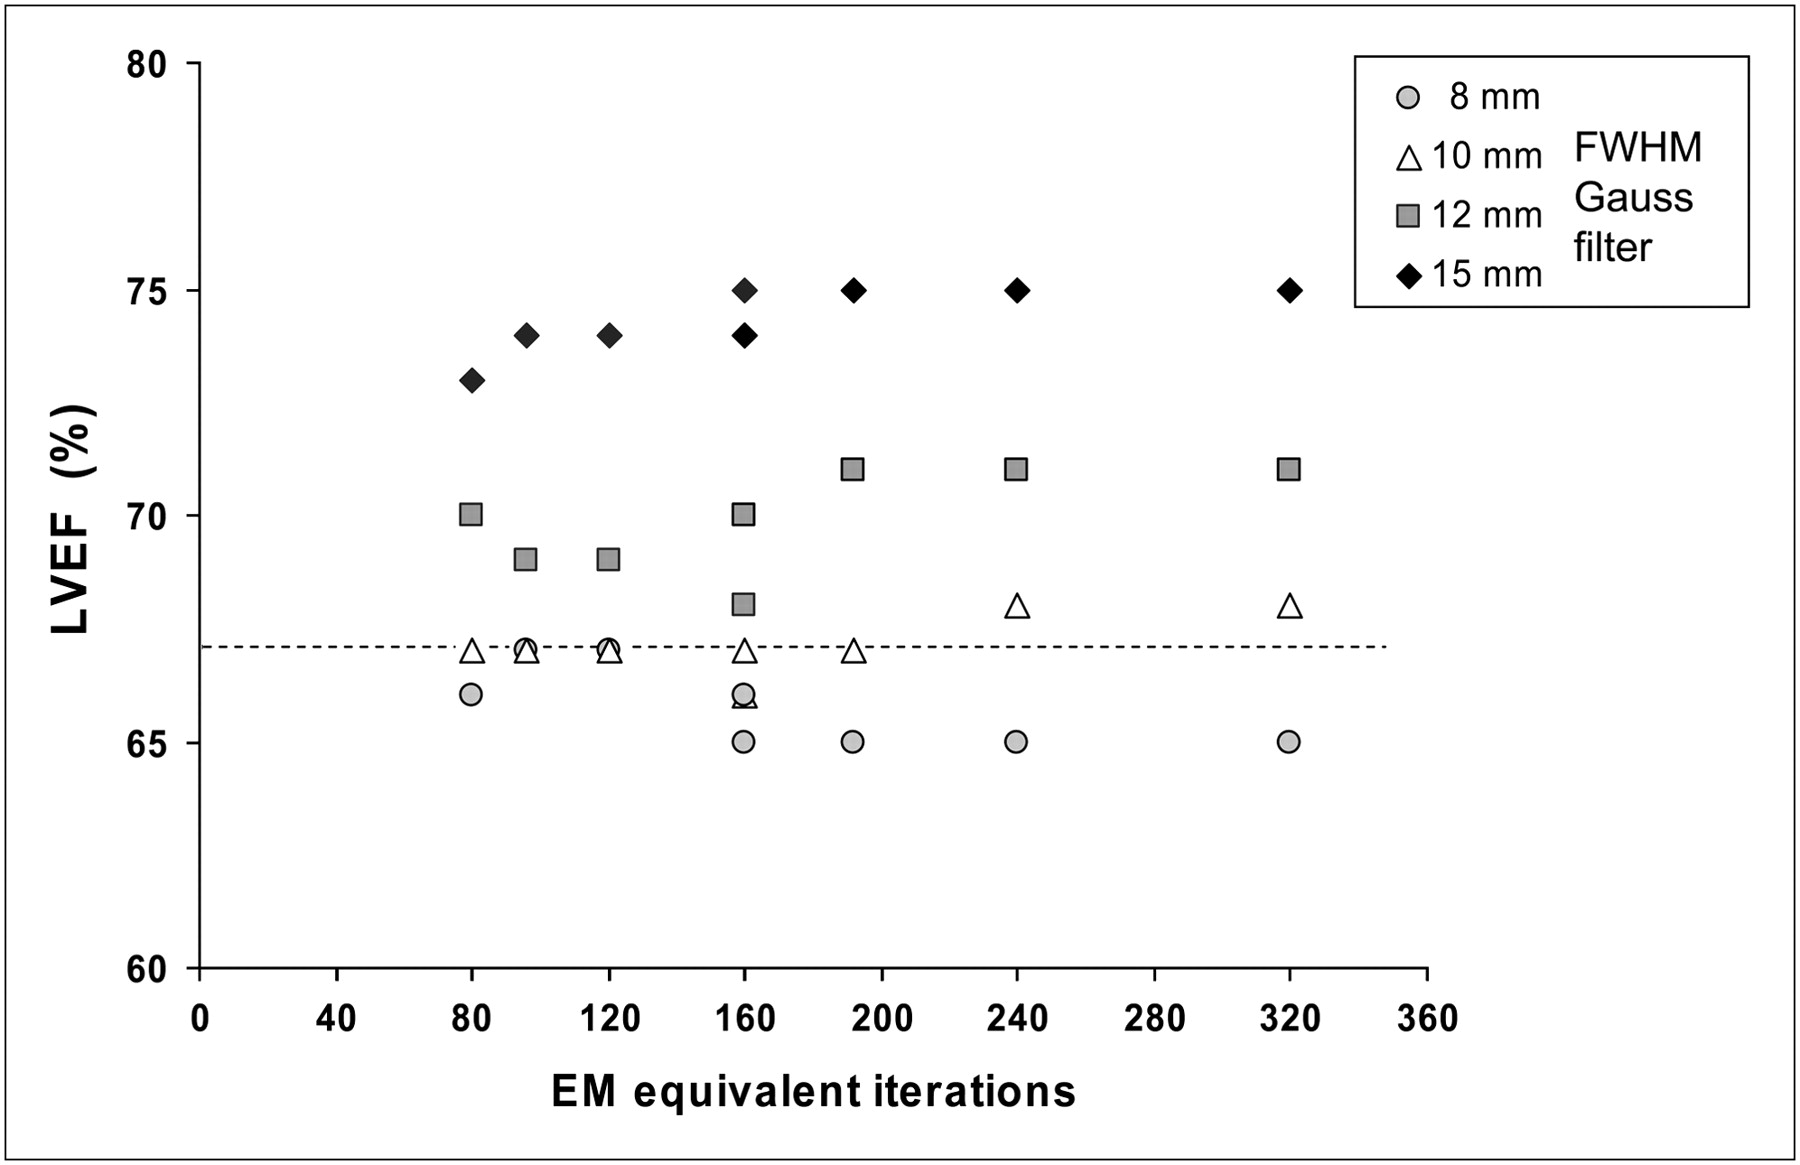
Calculated LVEF with different gaussian postprocessing filter FWHM values for various EM-equivalent iterations (I × S product). Dotted line represents actual value for LVEF of cardiac phantom.
Overall, the combination of 10 I, 8 S, and a gaussian filter cutoff value of 10 mm produced the most accurate results, with an EDV of 89 mL (difference of −20.5% with respect to the true value), an ESV of 29 mL (difference of −21.6%), an SV of 60 mL (difference of −20%), and an LVEF of 67% (no difference).
DISCUSSION
To our knowledge, this is the first study using a dynamic cardiac phantom to characterize a 3D OSEM iterative protocol for the estimation of LV function and LV volumes with 99mTc-labeled agent G-SPECT. A few comparative analyses of quantitative data obtained from defined OSEM protocols and FBP for clinical populations or obtained with other methods (such as cardiac MRI and radionuclide ventriculography) as standards of reference have been published, but no systematic analysis of the effects of OSEM reconstruction parameters in a dynamic cardiac phantom study had been performed yet (10–16).
We tested different combinations of I and S and postprocessing filter cutoff values to define the best protocol configuration for maximizing the accuracy of 3D OSEM in association with the QGS program for calculation of the LVEF and LV volumes. Our results showed that after G-SPECT reconstruction with optimized 3D OSEM, the QGS program was able to correctly calculate the LVEF of the cardiac phantom but provided an underestimation of the LV volumes of about −20%. The data demonstrated that the underestimation decreased progressively with the initial increase in EM-equivalent iterations and then the underestimation increased again for higher values (EM-equivalent iterations exceeding 160), as depicted by the bell-shaped distribution of the estimated values. This behavior can be explained by the interactions between the different levels of contrast and noise of the images and the QGS algorithm of myocardial contour detection.
As the EM-equivalent iterations increased, they resulted in a progressive improvement in the contrast between the myocardial wall and ventricular cavity and a decrease in spatial blur. Nevertheless, at the same time, statistical noise in the count distributions in the ventricular wall grew. The higher statistical noise led to more indeterminate count profiles in the ventricular wall, causing an increase in the width of the bell-shaped gaussian fitting applied in the QGS program to identify the wall thickness and the ventricular edges. This factor resulted in a shift between estimated and actual endocardial edges that produced the underestimation for the ventricular cavity (19,20). On the other hand, the bell-shaped distribution of the calculated ventricular volumes suggested that for EM-equivalent iterations ranging from 80 to 160, the opposite effects of noise and contrast seemed to be balanced and induced only slight changes in the QGS measurements.
The growing noise level due to the increasing S and I values can be corrected by postfiltration; we used a gaussian 3D postreconstruction filter because this was the only choice available in our software system. Postfiltration had a strong impact on the calculated LV volumes at FWHM values exceeding 10 mm, bringing about an increase in the underestimation for all the I × S combinations used in 3D OSEM. This effect is a clear consequence of the cutoff of the higher spatial frequencies that, reducing noise, reintroduced blur in the images, deteriorating the myocardial edge definition by the LV function quantification algorithms. Therefore, the type and level of postfiltration must be considered to be integral parts of the 3D OSEM algorithm applied.
A similar underestimation of LV volumes has been demonstrated in other cardiac phantom studies performed with standard or optimized FBP protocols (with Butterworth and Wiener prefiltration) and the QGS program (21,22). These findings have also been confirmed in different clinical studies comparing 99mTc-labeled agent G-SPECT reconstructed with FBP and quantified with the QGS program, contrast left ventriculography, and MRI (23–26).
Few data on OSEM filters have been published. Daou et al. (16) found a systematic underestimation of the LV volumes with OSEM (8 S and 2 I = 16 EM-equivalent I), the QGS program, and 201Tl G-SPECT relative to left ventriculography, but they found comparable values for the LVEF. The same authors reported an increase in the LV volumes after the introduction into the iterative protocol of a depth-dependent resolution recovery algorithm without a significant modification of the LVEF.
Marie et al. (15) obtained a comparable underestimation of the LV volumes with 99mTc sestamibi G-SPECT relative to cardiac MRI. In that study, the same OSEM protocol (8 S and 2 I, with a depth-dependent resolution recovery algorithm) was tested with temporal Fourier filtering, and similar lower LV volumes were obtained with G-SPECT than with MRI. However, apart from the different strategies used for reconstruction, the underestimation of the LV volumes generally occurring with G-SPECT seemed to be related to the intrinsic limit of SPECT spatial resolution, which does not allow accurate estimation of the absolute values for thickness and thickening of the myocardial wall (usually <20 mm) and, therefore, to a lesser degree, correct LV volume measurements, especially in small left ventricles.
We used an 8-frame G-SPECT acquisition; this solution, which is largely applied in clinical practice because of the better count statistics with respect to the higher number of frames, may have further affected the underestimation of the LV volumes. Some published studies demonstrated that a temporal sampling of at least 16 frames per cardiac cycle is needed for accurate LVEF and LV volume measurements, particularly with the QGS program (25,27–30). Nevertheless, human studies based on the reframing of G-SPECT images acquired with higher framing rates have produced conflicting results. A phantom study did not demonstrate a clear superiority of a 16-frame acquisition over an 8-frame acquisition, with a similar underestimation of the LV volumes and a slight overestimation of the LVEF with the 16-frame solution (21). Moreover, a recent study comparing the quantitative data obtained with the QGS program from the 2 framing solutions (8 frames and 16 frames) acquired simultaneously showed only minor differences of questionable clinical value (31).
High correlations have been demonstrated in comparative studies of the LV volumes and LVEF estimates obtained by different methods of quantification, particularly in patients with a normal-size hearts (25,32,33). Nevertheless, because of inherent algorithm differences, it has been suggested that the interchangeable use of different software packages should be avoided. Likewise, although the effects of the OSEM protocols on the characteristics of images were the same, the parameters were optimized for the QGS program and therefore should be applied with caution to other programs for quantification. A dedicated study should be performed for each program.
CONCLUSION
Our phantom study showed that the QGS program was able to correctly estimate the LVEF when used in association with an optimized 3D OSEM algorithm but underestimated by about 20% the LV volumes. The 3D OSEM protocol showed the best overall performance when applied with 8 subsets, 10 iterations, and a gaussian function FWHM value of 10 mm. However, various combinations of technical parameters, such as an intermediate number of EM-equivalent iterations (80–160) and an FWHM value of less than or equal to 10 mm for gaussian postfiltration, allowed similar accurate results without clinically relevant differences in the LV volumes and the LVEF estimates.
Acknowledgments
We are greatly indebted to Gilles Allenbach, Luca Modolo, and Didier Maillard for performing the phantom acquisitions. This study was supported by an Academic Research Award from the Leenaards Foundation, Lausanne, Switzerland.
Footnotes
-
COPYRIGHT © 2010 by the Society of Nuclear Medicine, Inc.
References
- Received for publication September 3, 2009.
- Accepted for publication December 28, 2009.


