


Abstract
During routine myocardial perfusion imaging, a common observation is that patients with normal cardiac function and small hearts, in particular small women, have higher left ventricular ejection fractions (LVEFs), as measured by quantitative gated SPECT (QGS) software, than anticipated, often markedly so. The goal of this project was to determine if the QGS LVEF varies with the change in end-diastolic left ventricular volume (EDV) and in particular to verify that the clinically observed phenomenon of falsely elevated QGS LVEF in patients with small hearts is actually occurring. Methods: A series of mathematically defined left ventricles (LVs) was produced by varying the EDV and targeted LVEF (tLVEF). These were created using concentric hemiellipsoids with nine different EDVs. The tLVEF was varied from 15% to 75% by 5% increments for a total of 13 different ejection fractions. These datasets were then smoothed, creating a total of 234 sets. The smoothed and unsmoothed images were then processed using QGS software. The LVEFs and EDVs were recorded. Results: For lower LVEFs the agreement between the QGS LVEF and the tLVEF is good. A marked overestimation occurs when the EDVs are low and the ejection fractions are in the higher range. This effect is greater in the smoothed images. Conclusion: An artifactual increase in the LVEF can occur when measurements are made with the QGS software. These data argue against using QGS LVEF for monitoring the LVEF in patients with small hearts. Our data imply that a mildly decreased LVEF may still appear to be in the normal range when measured by QGS software.
The major goal of myocardial perfusion imaging is the mapping of the relative myocardial perfusion at stress and rest. 201T1 chloride was used initially with planar imaging. Although this alone provides significant noninvasive information about the heart, incremental advancements in gamma camera technology, computers, and radiopharmaceuticals now allow significant additional information to be obtained. Although we know this additional information is clinically important, nonperfusion data were ignored previously because they were neither technically nor economically feasible to routinely obtain. With the approval of the 99mTc-based agents, routine quantification of left ventricular ejection fraction (LVEF) and left ventricular volumes became practical. This in turn stimulated the development of automated quantification software of left ventricular function and its subsequent commercial release. The Cedars-Sinai quantitative gated SPECT (QGS) software package provides a standardized automated method for rapidly determining the LVEF and volume as well as other parameters in a consistent and reproducible manner in the clinical setting (1). Although this software application is a significant advancement, limitations are apparent with routine use. These include inappropriate regions of interest (ROIs) when there is overlapping bowel activity and less well-documented, falsely elevated LVEF measurements in patients with small hearts (2).
MATERIALS AND METHODS
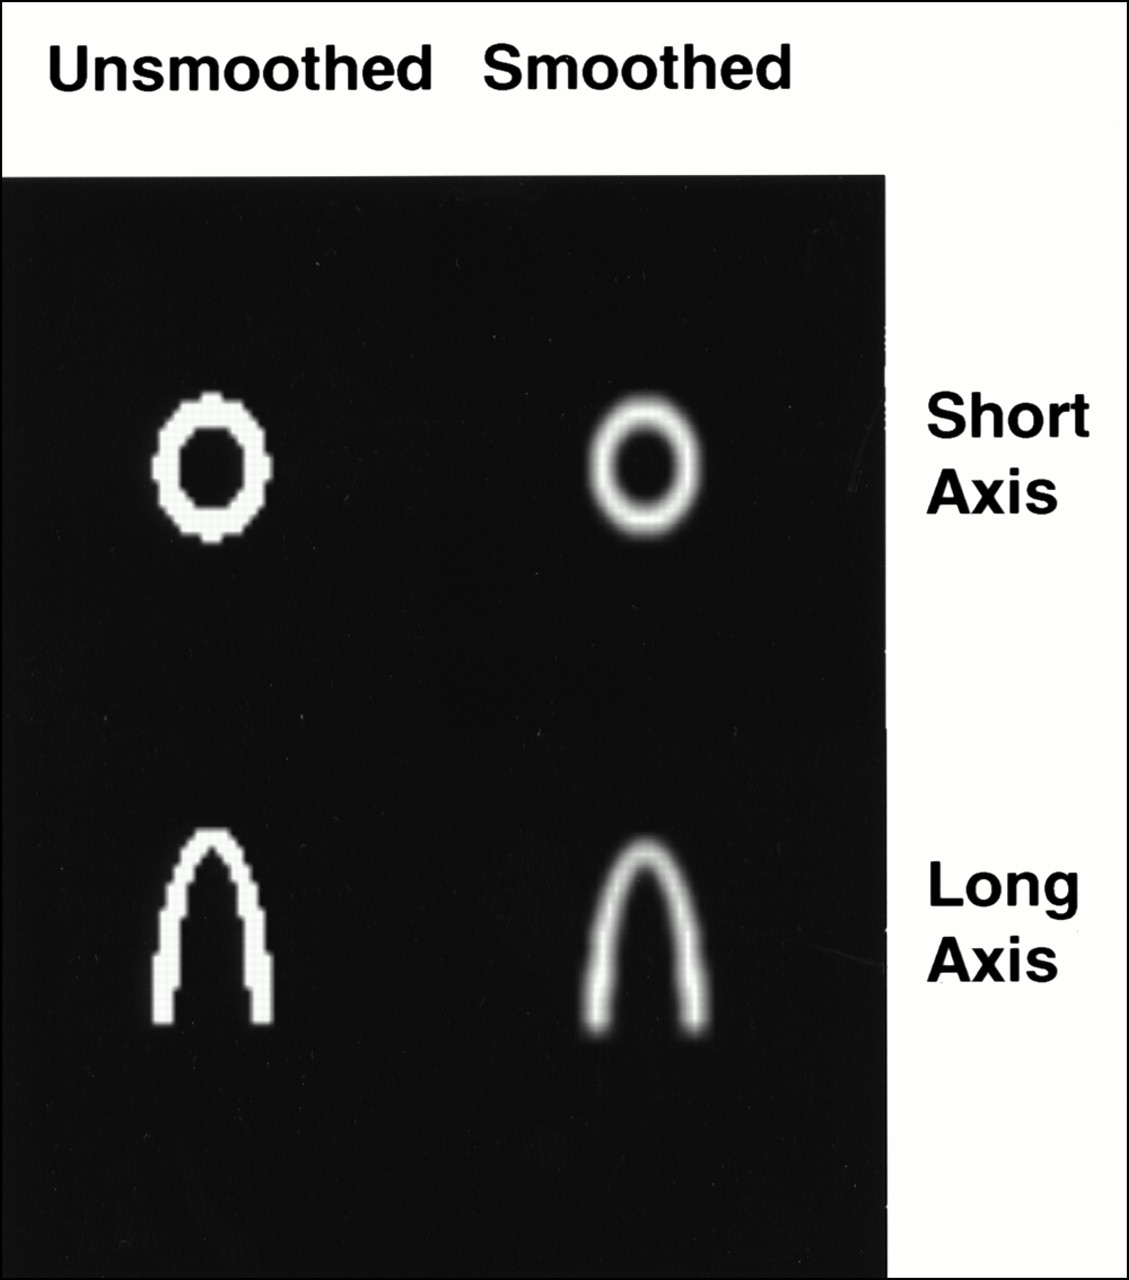
Although commonly observed, the falsely elevated LVEFs cannot be confirmed as easily as are inappropriate ROIs. To verify our anecdotal observation, a set of simple mathematic (digital) cardiac left ventricular phantoms was created (Fig. 1). The left ventricle (LV) was modeled using two concentric hemiellipsoids. The short axes were made equal, thus forming a circle in the short-axis projection. A constant ratio was maintained between the short and long axes throughout the cardiac cycle. The different volumes were created by varying the long-axis dimension of the smaller hemiellipsoid, which represents the border of the endocardium, from 14 to 22 pixels, by 1-pixel increments. The myocardial intensity was set as constants. This is unlike the clinical setting in which the myocardial intensity waxes and wanes throughout the cardiac cycle. The myocardial mass, or volume, was also held constant throughout the cardiac cycle. The myocardial volume equals the volume of the hemiellipsoid determined by the outer axes volume minus the inner axes volume. Targeted LVEFs (tLVEFs) were chosen to range from 15% to 75% in 5% increments for a total of 13 tLVEFs. The eight frames of the cardiac cycle, used by the software, were created by fitting the change in volume to a single cycle of a cosine wave, which represent the first harmonic of the volume curve. The formula used was: (tLVEF(cos(iπ/4) − 1)/2 + 1), where i ranges from 0 to 7. The LVEF, the inner radii of the hemiellipsoid, was varied to create the different volumes for each phase of the eight-frame cardiac cycle. The first frame, where i equals 0, was identical for a targeted end-diastolic left ventricular volume (EDV). These data were then smoothed with a two-dimensional filter using a boxcar average with a width of 3 pixels, creating a total of 234 smoothed and unsmoothed datasets. Each set consisted of a 64 × 64 × 25 × 8 array, containing the digital LV in the format required by the software. Before transferring the files to the Marconi Odyssey V7.2.3 (Marconi Medical Systems, Cleveland, OH), an appropriate Marconi header was appended to these datasets. The files were then named appropriately and transferred. The Marconi Odyssey does not use a single file but, rather, eight separate files representing each position in the cardiac cycle. The files were then processed using the automatic mode of the QGS ODYSSEY option package, which was developed by Cedars-Sinai Medical Center (Los Angeles, CA). The LVEF and EDV were recorded along with the tLVEF and relative volumes. These data were then plotted in two and three dimensions and were analyzed. Using JMP version 3.2.6 (SAS Institute, Inc., Cary, NC), a linear model fit using least squares was performed with the tLVEF and average EDVs, for a given set of volumes, as the effects in the model to predict the QGS LVEF. Residual and Passing–Bablok plots (3) of the tLVEF, unsmoothed datasets, and smoothed datasets were also created.

Short-axis and long-axis slice examples of digitally created left ventricles.
RESULTS
When the cardiac volume is large, the QGS LVEF closely approximates the tLVEF in the smoothed and unsmoothed data. As the relative cardiac volume decreases, the QGS LVEF rises faster than does the tLVEF (Fig. 2). The effect becomes pronounced for the smoothed data when the EDV is <70 mL and the tLVEF is >40%. In the setting in which the QGS LVEF is independent of the volume, the statistical model created using the JMP software would show no effect from the volume variable. As anticipated, the tLVEF has a strong effect on the QGS LVEF as indicated by its high F ratio because this is what the QGS software is measuring. (Table 1). Because the probability that the volume does not have an effect is P < 0.0001, this is very strong evidence that the volume is affecting the QGS LVEF.
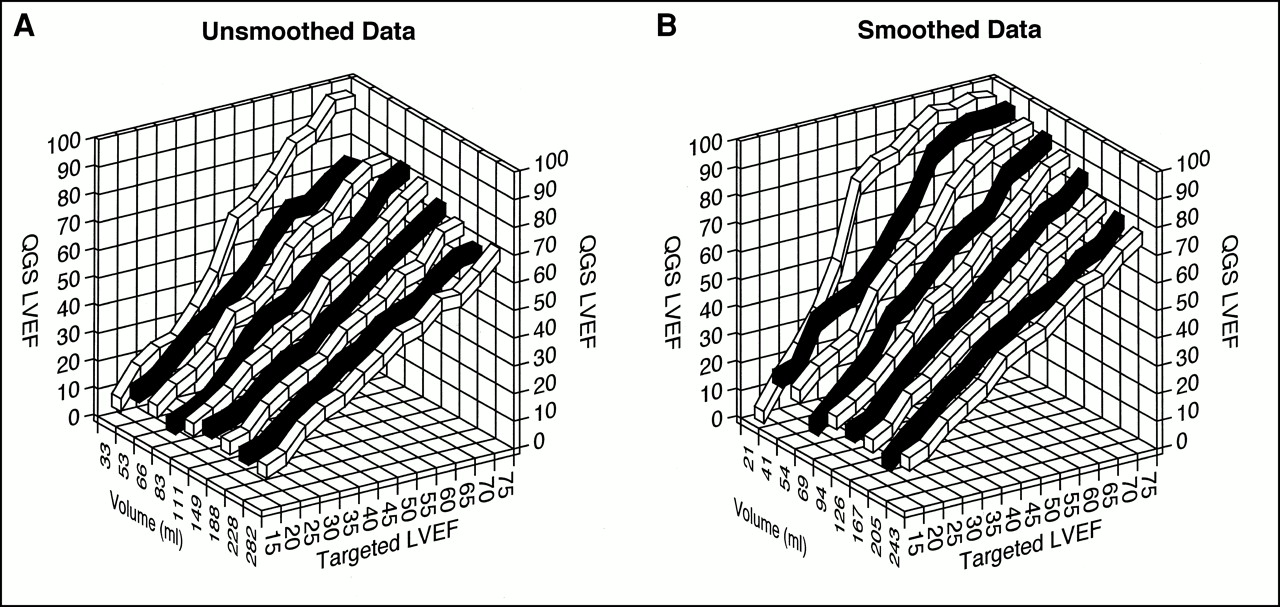
Graphs of QGS LVEF for unsmoothed (A) and smoothed (B) datasets vs. targeted LVEF (tLVEF) and average end-diastolic volume (EDV) clearly show that QGS LVEF is greater than tLVEF when EDV is small.
Results of Linear Least-Squares Model Fit Using JMP Software
The Passing–Bablok graphs show plots of the two ends of volume of the smoothed data’s LVEF versus the tLVEF with the line of unity superimposed (Fig. 3). When the volume is low there is a significant discrepancy compared with the line of unity and, conversely, good agreement with the larger volumes. Even with the divergence of the low EDV QGS LVEF from the line of unity there is a good correlation (r = 0.937). The correlation coefficient is inappropriate to use in this situation because r measures the strength of the relationship, not the agreement. There will be perfect correlation along any straight line but perfect agreement only along the line of unity. In addition, with perfect agreement, a plot of the slopes of the QGS LVEF data versus the average EDVs would equal 1. Figure 4A shows that as the EDVs decrease, the slope increases, indicating lack of agreement, even though there is very good correlation.
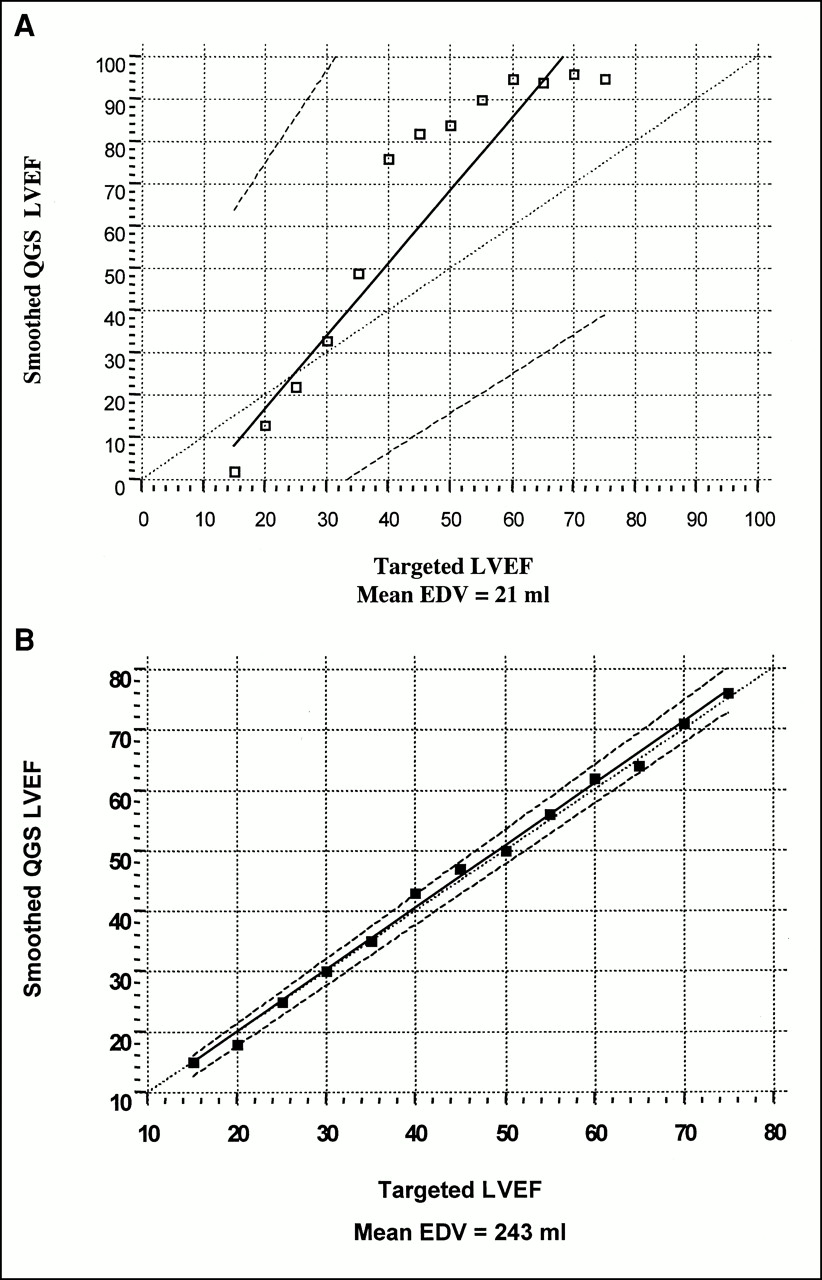
Passing–Bablok graphs of smoothed data’s QGS LVEF vs. tLVEF for smallest (A) and largest (B) volumes. (Same data are present at ends of graph in Fig. 2B.) Slope and y-intercept are calculated with their 95% confidence interval. Confidence intervals are used to determine whether there is only a chance difference between slope and 1 and between y-intercept and 0. Plots show poor agreement when volume is small and good agreement with larger volumes.
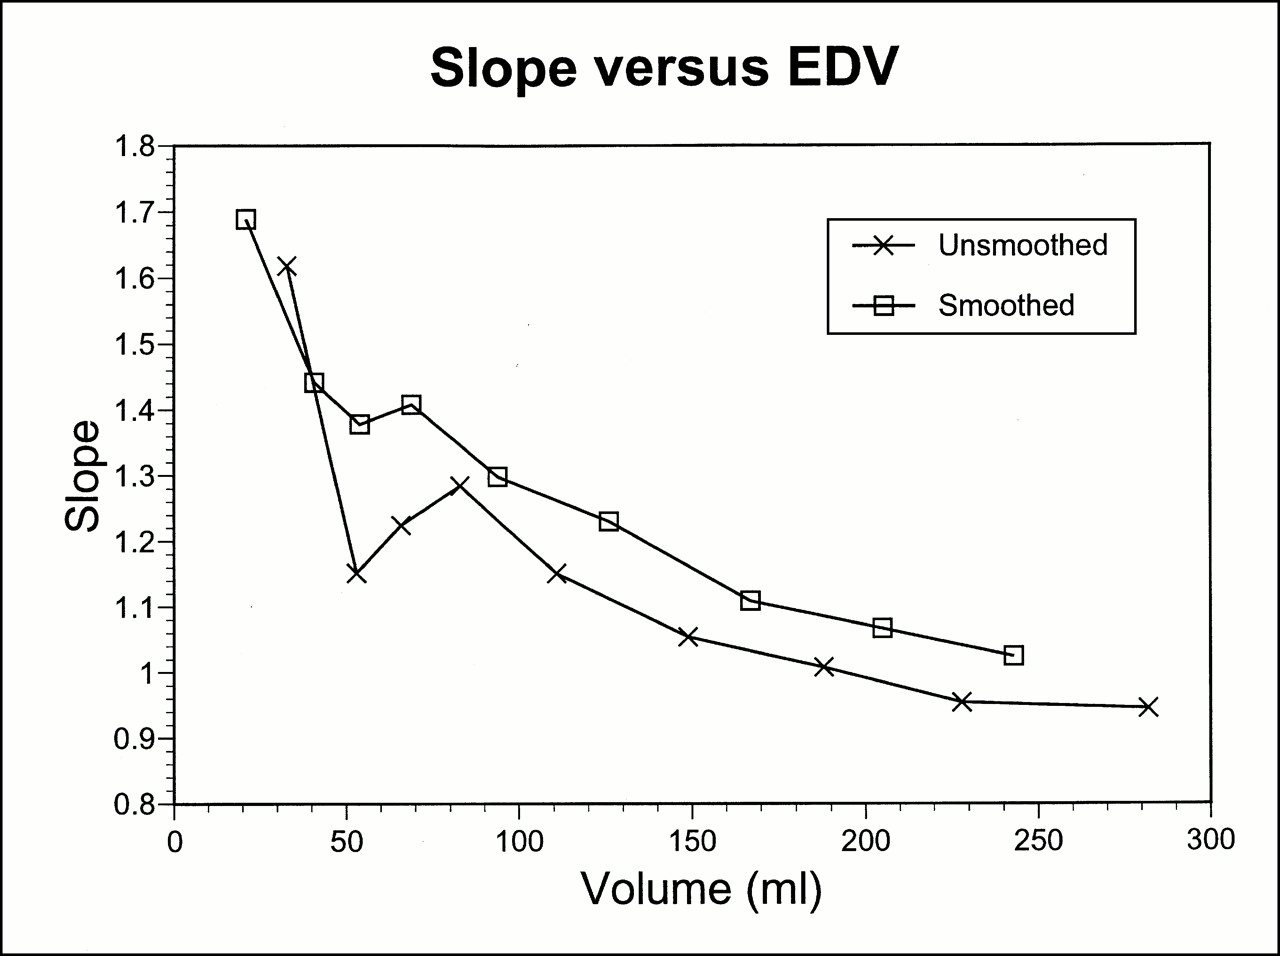
Plot of slopes from linear fits of QGS LVEF vs. tLVEF for each given volume. With perfect agreement, slope values would equal 1.
The residual plot graphically shows the divergence of the QGS LVEF from the tLVEF (Fig. 5). For lower LVEFs the agreement is good. A marked overestimation of the LVEF occurs when the EDVs are low and the ejection fractions are in the upper range (i.e., the ESV is too low). This effect is greater in the smoothed images. For the unsmoothed and smoothed data, the Shapiro-Wilk W test for normality indicates that P < W is 0.001. This finding indicates that the data are skewed (i.e., not normally distributed).
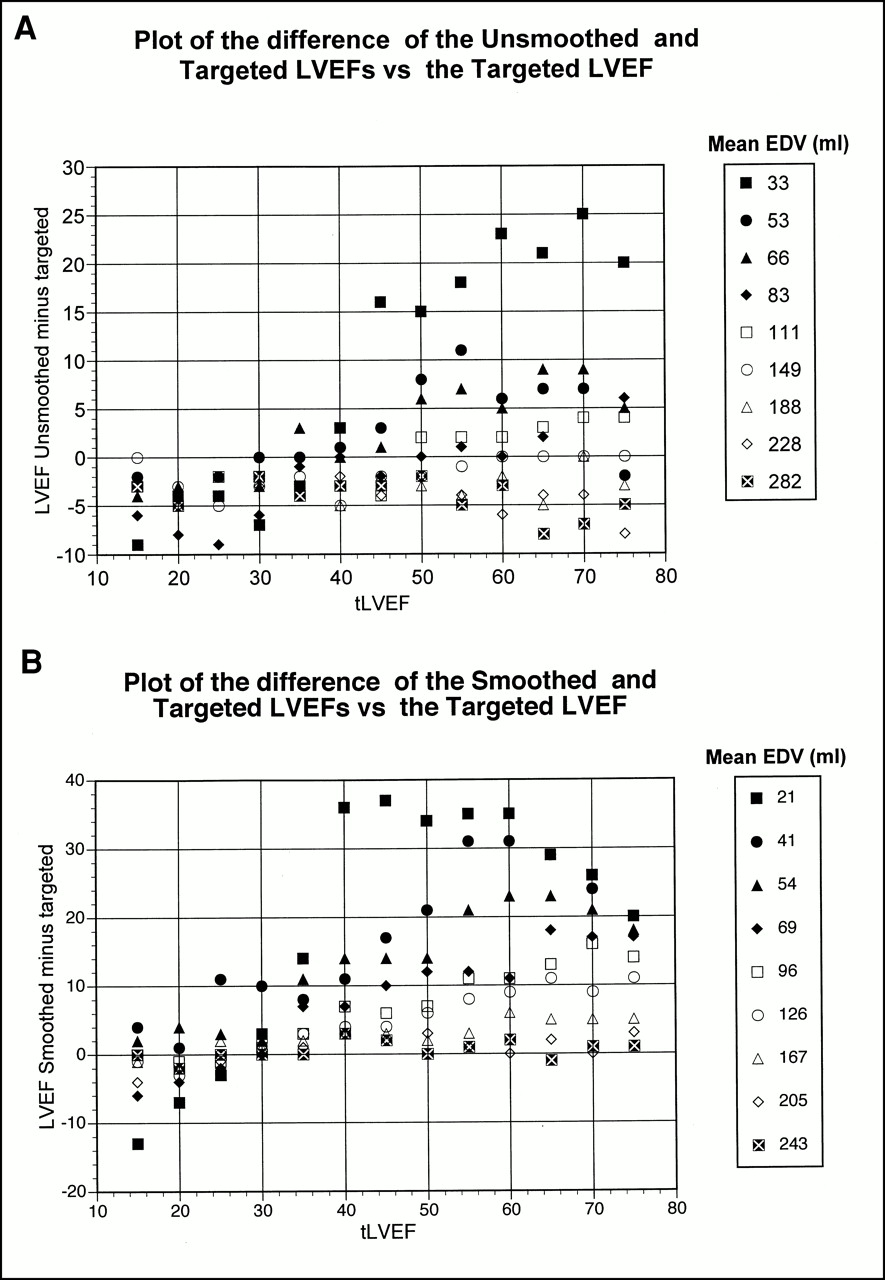
Residual plots show differences of expected and observed values vs. corresponding expected value. If fit was adequate, a normal distribution with mean of 0 would be found. Graphs show divergence of QGS LVEF from tLVEF when EDV is low and ejection fractions are in upper range for unsmoothed (A) and smoothed data (B), worse for smoothed data.
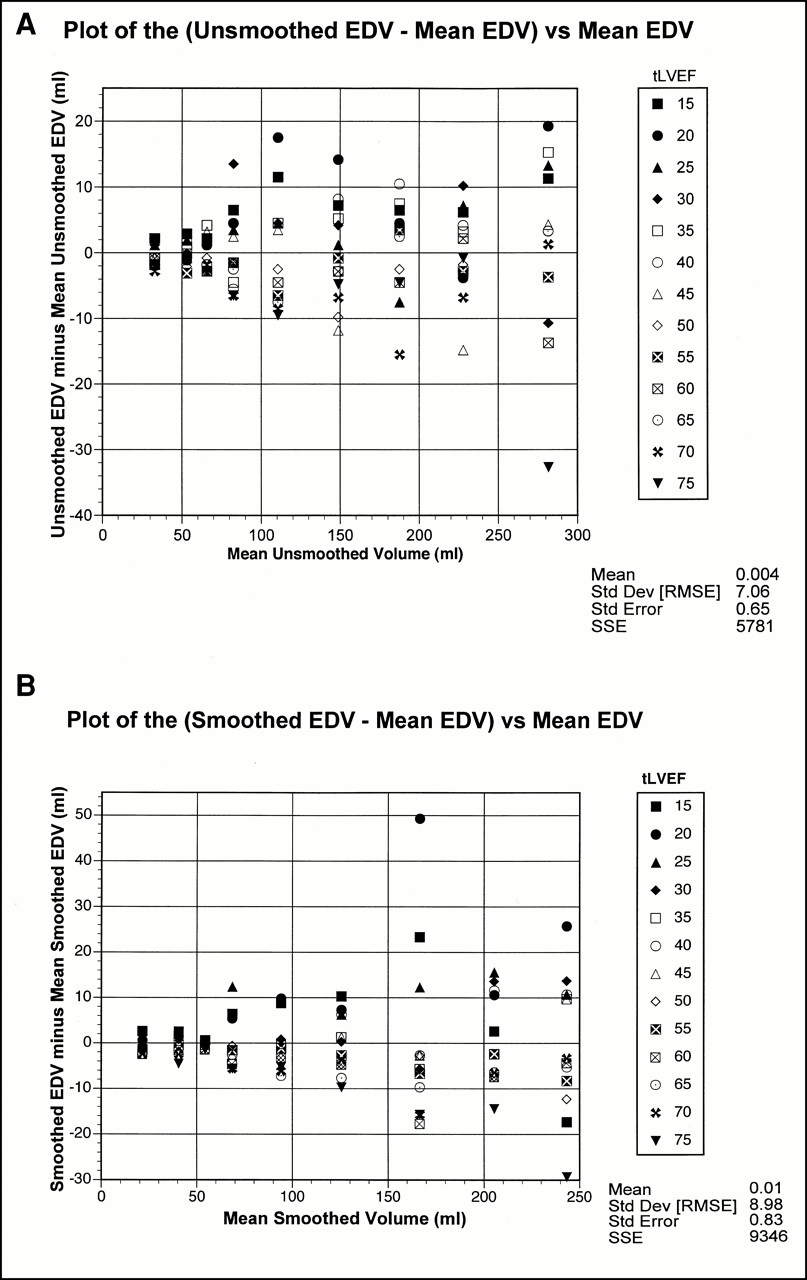
An expected finding was that the volumes of the smoother data were lower than those of the unsmoothed data. However, an unexpected finding was that the EDVs were not constant (Fig. 6). This is unexpected because the EDV was initially set, and the end-systolic volume and intermediate volumes were then calculated.

Plots of differences of measured EDV vs. mean EDV for unsmoothed (A) and smoothed data (B). Anticipated plot would show no variance because maximal volume was set in model and then intermediate values were calculated.
DISCUSSION
In attempting to verify that QGS LVEF overestimates the true LVEF with small-volume hearts, there are several choices, each of which has its advantages and disadvantages. The most obvious advantage is using actual patients or real data. An advantage of real data is that these are the actual data that we are interested in. Disadvantages include the quality of the gold standard used for comparison; obtaining the comparison; multiple variables that change from patient to patient and, possibly, from day to day; the variables being evaluated are not independent of each other; and the limited availability of datasets. For a mechanical phantom, an advantage is that physical measurements are known and are controllable. Disadvantages include obtaining gated SPECT quality phantoms in sufficient numbers to cover the range of LVEFs and EDVs of interest and gamma camera characteristics that affect acquisition such as uniformity and center of rotation. The advantages of the simple mathematic or digital phantom are that EDV and LVEF, the variables of interest, can be controlled independently and the lack of noise with an ideal target-to-background ratio and with no extraneous activity in the bowel or adjacent structures. In addition, various physical factors that can cause artifacts are bypassed, such as patient motion, attenuation, arrhythmias, variance in the radius of rotation, and uniformity. Potential disadvantages include the following: the simple model of the LV may ignore important physiologic features that are incorporated into the software model; an abrupt step artifact by the voxels being either on or off, which is partially alleviated by smoothing; and the software may perform subpixel evaluation that is not accounted for in this simple model. An example of this is that LV myocardial thickening is not measured directly because of the low resolution but is seen as a change in the LV intensity that increases with contraction. We believed that the advantages of the mathematic model—in which the LVEF and EDV can be varied independently, large numbers of sets with known indices could be created, and the lack of interfering noise and relative ease of obtaining those data—outweighed its disadvantages.
As the data clearly show, our observation that QGS LVEF is elevated in patients with small hearts was duplicated. Our hypothesis as to why this occurs is based on the limited spatial resolution of the system in which, in a small heart, each voxel represents a considerable portion of the LV volume. As the myocardium moves inward, there can be an abrupt change because the LV endocardial edge is either represented by a voxel or not represented, in effect quantizing its value. This effect may be more dramatic in our unsmoothed data but is also present in smoothed data. In fact, the smoothed data EDVs are, as expected, smaller. As in a patient’s heart, the less distinct boundaries, or partial-volume effect, may contribute to overestimation of the LVEF because the edges may be smeared together at end systole.
Case et al. (4) reported this phenomenon, stating that the elevated LVEFs were associated with the filtering during reconstruction. Pratt et al. (5) reported that a significant problem in commercially available software is caused by the partial-volume effect with inaccurate determination of the inner boundary at the apex on the end-systolic images.
The finding that the EDV was not constant but changed with tLVEF was unexpected. The cause of this finding is undetermined at this time and requires verification. A possible cause is that the formula used to create the volume curve is limited to eight frames and, to reach the tLVEF, the last frame does not return to baseline. If the software chooses frame 0, the volume will be at its maximum, whereas if the software chooses frame 7, the EDV will be lower and will vary as a function of the LVEF. The phenomenon of the last frame in a volume curve not returning to the baseline level is also observed clinically and may be associated with changes in the heart rate. This finding is of concern in that the volume calculation could potentially vary significantly more than the true EDV in a patient over time. Previous investigators may not have observed this finding because either physical phantoms or real patient data with a smaller sample size were used and, therefore, the phenomenon was too subtle to see.
Although the introduction of automated quantitative analysis programs such as QGS has been a major advancement in clinical practice, problems still exist. The end-user needs to be aware of the system’s limitations when reporting clinical information. There is the potential that in patients with small hearts, such as small women and children, a significant drop in the LVEF could be missed when the QGS LVEF is normal.
CONCLUSION
An artifactual increase in the LVEF in patients with small hearts, in our model with an EDV of <70 mL, can occur when measurements are made with the QGS software. These data argue against using QGS LVEF for monitoring the LVEF in patients with small hearts. Our data imply that a patient may have a mildly decreased LVEF that still appears to be normal by the QGS LVEF. Although the linear model created by the JMP software could apply a correction factor, the problem is more complex than can be adequately modeled by fitting it to a line. A more complex model could be created; however, this does not necessarily mean we could extrapolate from our data to the clinical setting without verification by other means. Also, although patching the output may fix a population’s data, correcting the underlying cause should be more accurate for an individual patient.
The question has been raised by our data as to the accuracy of the EDV. The design of this experiment was not to evaluate the individual volume measurements but to bracket the volumes seen clinically; therefore, the recorded data are insufficient to determine the cause. Further investigation is warranted for verification or rejection of this observation.
Acknowledgments
None of the authors has a financial interest in any cardiac software package. This report did not receive any support from any vendor or cardiac software producer.
Footnotes
Received Apr. 12, 2000; revision accepted Oct. 5, 2000.
For correspondence or reprints contact: Patrick V. Ford, MD, Department of Nuclear Medicine, St. Luke’s Episcopal Hospital, MC3-261, 6720 Bertner Ave., Houston, TX 77030.


