


Abstract
In 2-dimensional cardiac PET/CT, misregistration between the PET and CT images due to respiratory and cardiac motion causes tracer uptake to appear substantially reduced. The resolution and quality of the images have been considerably improved by the use of 3-dimensional (3D) PET acquisitions. In the current study, we investigated the impact that misregistration between PET and CT images has on myocardial 13N-ammonia uptake in images reconstructed with 3D ordered-subset expectation maximization combined with time-of-flight and point-spread-function modeling. Methods: Eight healthy volunteers (7 men and 1 woman; mean age ± SD, 53 ± 19 y) underwent 13N-ammonia cardiac PET/CT at rest. First, any misregistration between the PET and CT images was manually corrected to generate reference images. Then, the images were intentionally misregistered by shifting the PET images from the reference images by a degree of 1, 2, 3, 4, 5, 10, and 15 mm along both the x-axis (left) and the z-axis (cranial). For each degree of misregistration, the PET images were reconstructed using the CT-attenuation images. The left ventricular short-axis PET/CT images were divided into 4 segments: anterior wall, inferior wall, lateral wall, and septum. The erroneous decrease in myocardial uptake in basal, mid, and apical slices was visually graded using a 4-point scale (0 = none, 1 = mild, 2 = moderate, and 3 = severe). Wall-to-septum uptake ratios were evaluated for the anterior, inferior, and lateral walls in the basal, mid, and apical slices. Results: A statistically significant reduction in myocardial 13N-ammonia uptake in the anterior (P < 0.01) and lateral (P < 0.05) walls was observed when misregistration was 10 mm or more. The uptake ratios for the anterior, lateral, and inferior walls in the reference images were 1.00 ± 0.04, 0.96 ± 0.08, and 0.91 ± 0.03, respectively. The ratios for the anterior and lateral walls significantly decreased when misregistration exceeded 10 mm (anterior wall, 0.80 ± 0.06, P < 0.0001; lateral wall, 0.82 ± 0.07, P < 0.01), whereas the ratio for the inferior wall was relatively small at all 7 degrees of misregistration (0.86 ± 0.05 at 15-mm misregistration, P = 0.06). Conclusion: In PET/CT images reconstructed with 3D ordered-subset expectation maximization combined with time-of-flight and point-spread-function modeling, we found a statistically significant artifactual reduction in tracer uptake in heart regions overlapping lung when misregistration between PET and CT exceeded 10 mm.
Myocardial perfusion PET/CT with pharmacologic stress detects coronary artery disease by identifying regional reductions in tracer uptake (1). Accurate and reliable assessment of these regional reductions is essential for early detection and therapy when coronary artery disease is suspected (1,2). The CT data acquired in myocardial perfusion PET/CT studies are commonly used for attenuation correction (3). However, misregistration between PET-emission and CT-transmission data may occur up to 40% of the time (4). Studies using 2-dimensional (2D) PET/CT scanners have found that a misregistration of more than 5 mm causes a statistically significant artifactual reduction in myocardial uptake and inaccurate quantification of myocardial blood flow, predominantly in the anterior and lateral walls, due to errors in attenuation correction (4–8).
Recently, the use of 3-dimensional (3D) PET in clinical PET/CT scanners has been facilitated by improvements in detectors and scatter correction techniques (9). 3D PET has higher sensitivity than 2D PET, substantially improving the signal-to-noise ratio in PET images (9). Image reconstruction using 3D ordered-subset expectation maximization (OSEM) improves both spatial resolution and contrast-to-noise ratio in comparison with filtered backprojection reconstruction (10–12). In addition, recent 3D PET/CT scanners use time-of-flight (TOF) and point-spread-function (PSF) modeling, further improving spatial resolution, signal-to-noise ratio, and contrast-to-noise ratio (12–18). Therefore, cardiac PET/CT using 3D OSEM combined with TOF and PSF modeling might be more susceptible than conventional 2D PET/CT to misregistration between PET-emission and CT-attenuation images, potentially affecting the accuracy with which myocardial uptake is estimated. To the best of our knowledge, the impact of PET/CT misregistration on myocardial uptake has not yet been fully investigated using 3D PET/CT. The purpose of this study was to determine this impact.
MATERIALS AND METHODS
Subjects
Eight healthy volunteers (7 men and 1 woman; mean age ± SD, 53 ± 19 y; mean body mass index, 23.4 ± 1.73 kg/m2) were included in the study, which was approved by the local ethics committee. All subjects gave written informed consent to participate.
Protocol
Imaging was performed on a 64-slice Discovery 690 VCT PET/CT scanner (GE Healthcare) equipped with a lutetium yttrium orthosilicate scintillator (14). The PET data were acquired in 3D mode, with an axial field of view of 15.7 cm and a transverse field of view of 50 cm. The subjects were positioned supine on the examination table such that the heart was accurately centered in the scanning field. A 20-cm-wide belt was wrapped around the abdomen in expiration to suppress breathing-related motion of the diaphragm. Through a right antecubital intravenous line, 600–800 MBq (mean, 738 ± 146 MBq) of 13N-ammonia were administrated. Ungated static PET images were acquired for 15 min during normal breathing, starting 6 min after administration of the 13N-ammonia. For attenuation correction, a fast helical low-dose CT acquisition was performed during a breath-hold at shallow expiration after the PET acquisition. The CT images were acquired using a 0.4-s rotation, a total scanning time of 1.57 s, a 3.75-mm slice thickness, 30 mA, 120 kVp, and a dose–length product of 20.3 mGy⋅cm. Both the CT and the PET images were acquired with the subject’s arms up.
Image Reconstruction
PET images were reconstructed with 3D OSEM combined with TOF and PSF modeling. The data were corrected for random coincidences, geometry, normalization, dead-time losses, scatter, and attenuation. The coincidence time window and TOF time resolution averaged over all crystals after timing offset were 4.9 ns and 555 ps, respectively. The 3D OSEM reconstruction parameters were 16 subsets and 3 iterations. The full width at half maximum of the gaussian filter was 5 mm. The CT images were processed using the standard vendor algorithm for conversion to a linear attenuation coefficient at 511 keV, from which the PET attenuation correction factors were reprojected.
To create a reference, manual rigid-body registration was visually performed by interactively moving the PET image over the CT image in the coronal, sagittal, and transaxial views (Fig. 1) using vendor-supplied quality-assurance software (ACQC; GE Healthcare) and taking care to ensure that LV myocardial uptake in PET did not overlap lung parenchyma in CT (Fig. 2A) (4,8). Afterward, 8 sets of PET/CT images were reconstructed for each subject: 1 set with no artificial misregistration (the reference set) and 7 sets with artificial misregistration ranging from 1 to 15 mm along both the x-axis (left) and the z-axis (cranial) such that the lung parenchyma in CT overlapped the anterior and lateral LV walls in PET (Figs. 2B–2H). Attenuation-corrected short-axis PET images based on the reconstructed transaxial PET/CT images were then generated: 1 set for the reference and 1 set for each of the 7 degrees of misregistration.
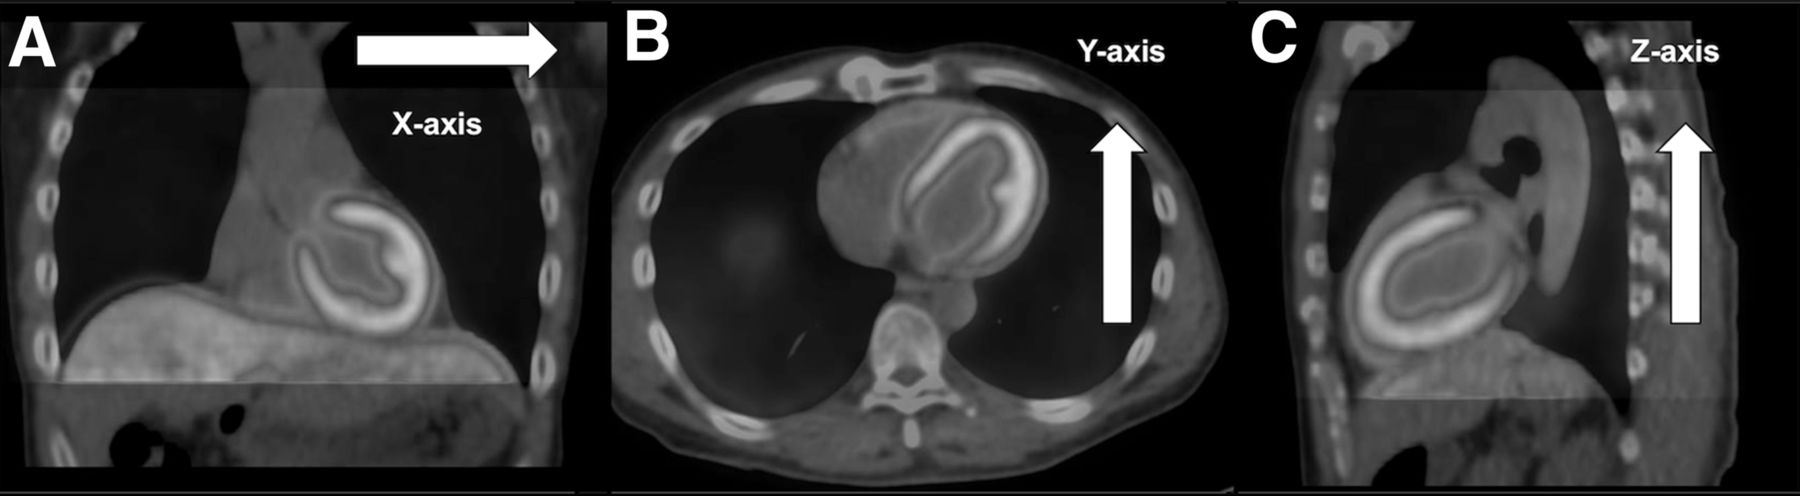
Manual registration of PET and CT-attenuation images. PET image was moved over CT image in transaxial (A), coronal (B), and sagittal (C) views with special attention to preventing LV myocardial uptake in PET from overlapping lung parenchyma in CT. A color version of this figure is available as a supplemental file at http://tech.snmjournals.org.
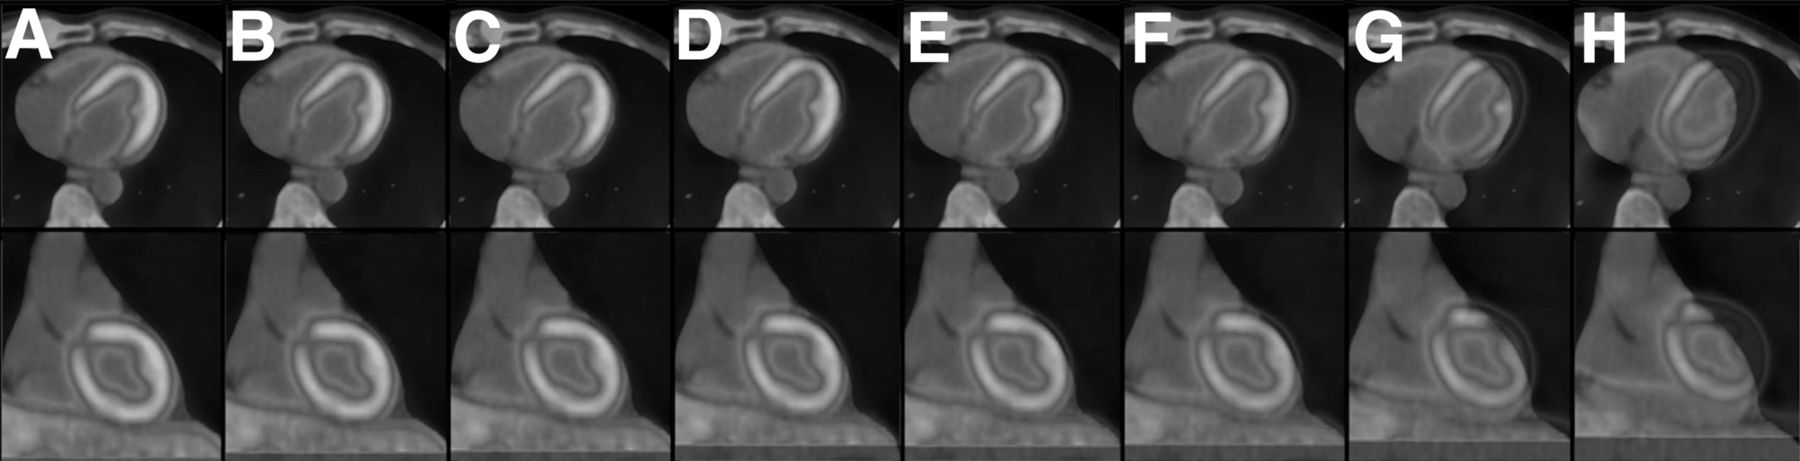
Eight sets of cardiac PET/CT images, including reference without misregistration (A) and 7 different degrees of artificial misregistration between PET and CT images in both x- and z-directions (1-mm [B], 2-mm [C], 3-mm [D], 4-mm [E], 5-mm [F], 10-mm [G], and 15-mm [H]). Top and bottom sets of images are transaxial and coronal, respectively. A color version of this figure is available as a supplemental file at http://tech.snmjournals.org.
Image Analysis
Visual Assessment
Four LV segments (anterior wall, inferior wall, lateral wall, and septum) were visually assessed in short-axis basal, mid, and apical PET/CT slices (12 segments total) (7,19) in random order by 2 board-certified nuclear medicine specialists, who worked in consensus and did not know the degree of misregistration applied to each dataset. The erroneous decrease in uptake was graded using a 4-point scale (0 = none, 1 = mild, 2 = moderate, and 3 = severe). The highest score among the 3 slices for each of the 4 segments was recorded.
Quantitative Assessment
Myocardial counts for the entire left ventricle were measured and analyzed using cardiac image analysis software (Carimas; Turku PET Centre (20)). Myocardial segmentation was performed semiautomatically using transaxial images, and regions of interest in the myocardium were automatically defined. Using the American Heart Association 17-segment model, the mean myocardial counts in the basal, mid, and apical slices were obtained for the anterior wall (1, 7, and 13, respectively), inferior wall (4, 10, and 15, respectively), lateral wall (5–6, 11–12, and 16, respectively), and septum (2–3, 8–9, and 14, respectively). To assess myocardial inhomogeneity, wall-to-septum uptake ratios were evaluated for the anterior, inferior, and lateral walls of the basal, mid, and apical slices because the septum is relatively far from the lung and minimally affected by any error in the attenuation map due to misregistration between PET and CT images (6,7,19). The smallest uptake ratio among the 3 slices for each of the 3 walls was recorded. The uptake ratios for the 3 walls at all 7 degrees of misregistration were compared with those of the reference images.
Statistical Analysis
Statistical analysis was performed using JMP, version 10.0 (SAS Institute Inc.). For all continuous variables, the results are given as mean ± SD. Because erroneous-decrease scores are discrete variables, nonparametric statistics were applied. To detect statistically significant differences in erroneous-decrease scores between PET/CT images with and without misregistration, the method of Steel was used for multiple comparisons with the reference. The wall-to-septum uptake ratios are continuous variables. Normal distribution and equality of variance for the wall-to-septum uptake ratios were confirmed using the Shapiro–Wilk test and the Bartlett test, respectively. Variables at each degree of misregistration versus the reference were compared using 1-way repeated-measures ANOVA, combined with the Dunnett test for post hoc analysis. Agreement in erroneous-decrease scores between the two observers was analyzed using the Cohen κ-statistic. All tests were 2-tailed, and a P value of less than 0.05 was considered to indicate a statistically significant difference.
RESULTS
Myocardial 13N-ammonia PET/CT images were successfully obtained for all subjects. No adverse reaction occurred at any time during the imaging process, and all subjects tolerated the abdominal belt throughout.
Visual Assessment
Table 1 demonstrates inhomogeneity in myocardial 13N-ammonia uptake in visual analysis. The erroneous reduction in regional uptake was statistically significant when misregistration was 10 mm or more in the anterior wall (P < 0.01 with both 10-mm and 15-mm misregistrations) and in the lateral wall (P < 0.05 with 10-mm misregistration and P < 0.01 with 15-mm). However, uptake was not significantly altered in the inferior wall (P = 0.40) or septum (P = 0.29), even when misregistration was 15 mm (Table 1; Fig. 3). The erroneous-decrease scores agreed well between the two observers, with a κ-value of 0.76.
Visual Assessment of Erroneous Decrease in Myocardial Uptake in PET/CT Images*
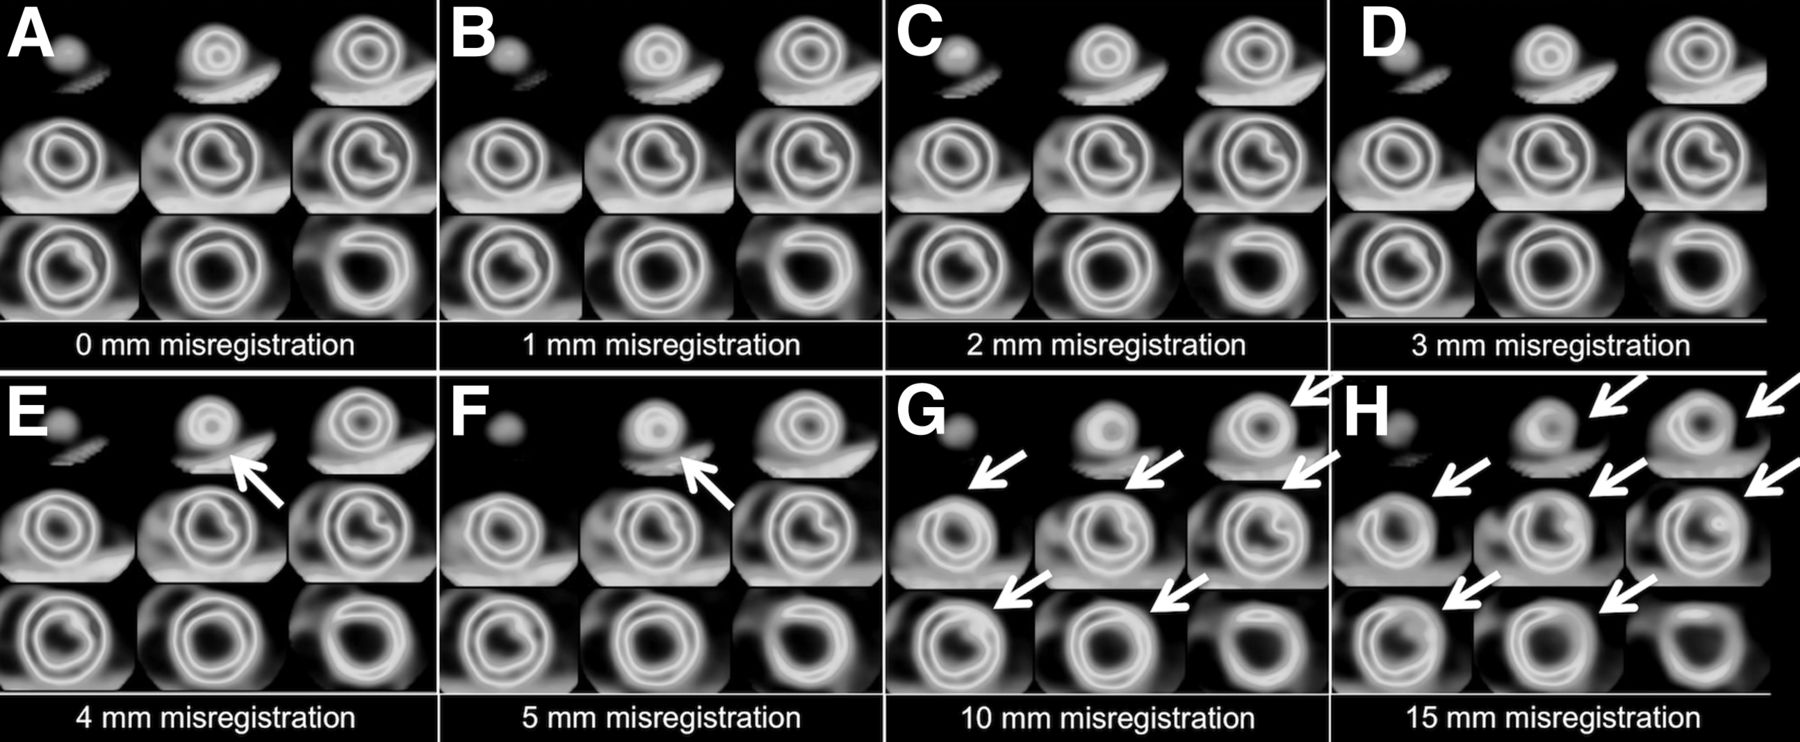
Myocardial 13N-ammonia PET images demonstrating effects of no misregistration (A) and of 1-mm (B), 2-mm (C), 3-mm (D), 4-mm (E), 5-mm (F), 10-mm (G), and 15-mm (H) misregistration in both x- and z-directions in representative case (61-y-old man). When greater than 10 mm, misregistration had noticeable effect on inhomogeneity of LV short-axis PET/CT images. Artifactual reduction in uptake is prominent in anterior and lateral walls of heart. A color version of this figure is available as a supplemental file at http://tech.snmjournals.org.
Quantitative Assessment
The reference-image uptake ratios for the anterior, inferior, and lateral walls were 1.00 ± 0.04, 0.91 ± 0.03, and 0.96 ± 0.08, respectively (Fig. 4). The anterior-wall ratio decreased significantly when misregistration was 4 mm or more (0.93 ± 0.04 with 4-mm misregistration, P < 0.01), and the lateral-wall ratio decreased significantly when misregistration was 10 mm or more (0.82 ± 0.07 with 10-mm misregistration, P < 0.01). However, the decrease in the inferior wall ratio was relatively small at all 7 degrees of misregistration (0.86 ± 0.05 with 15-mm misregistration, P = 0.06).
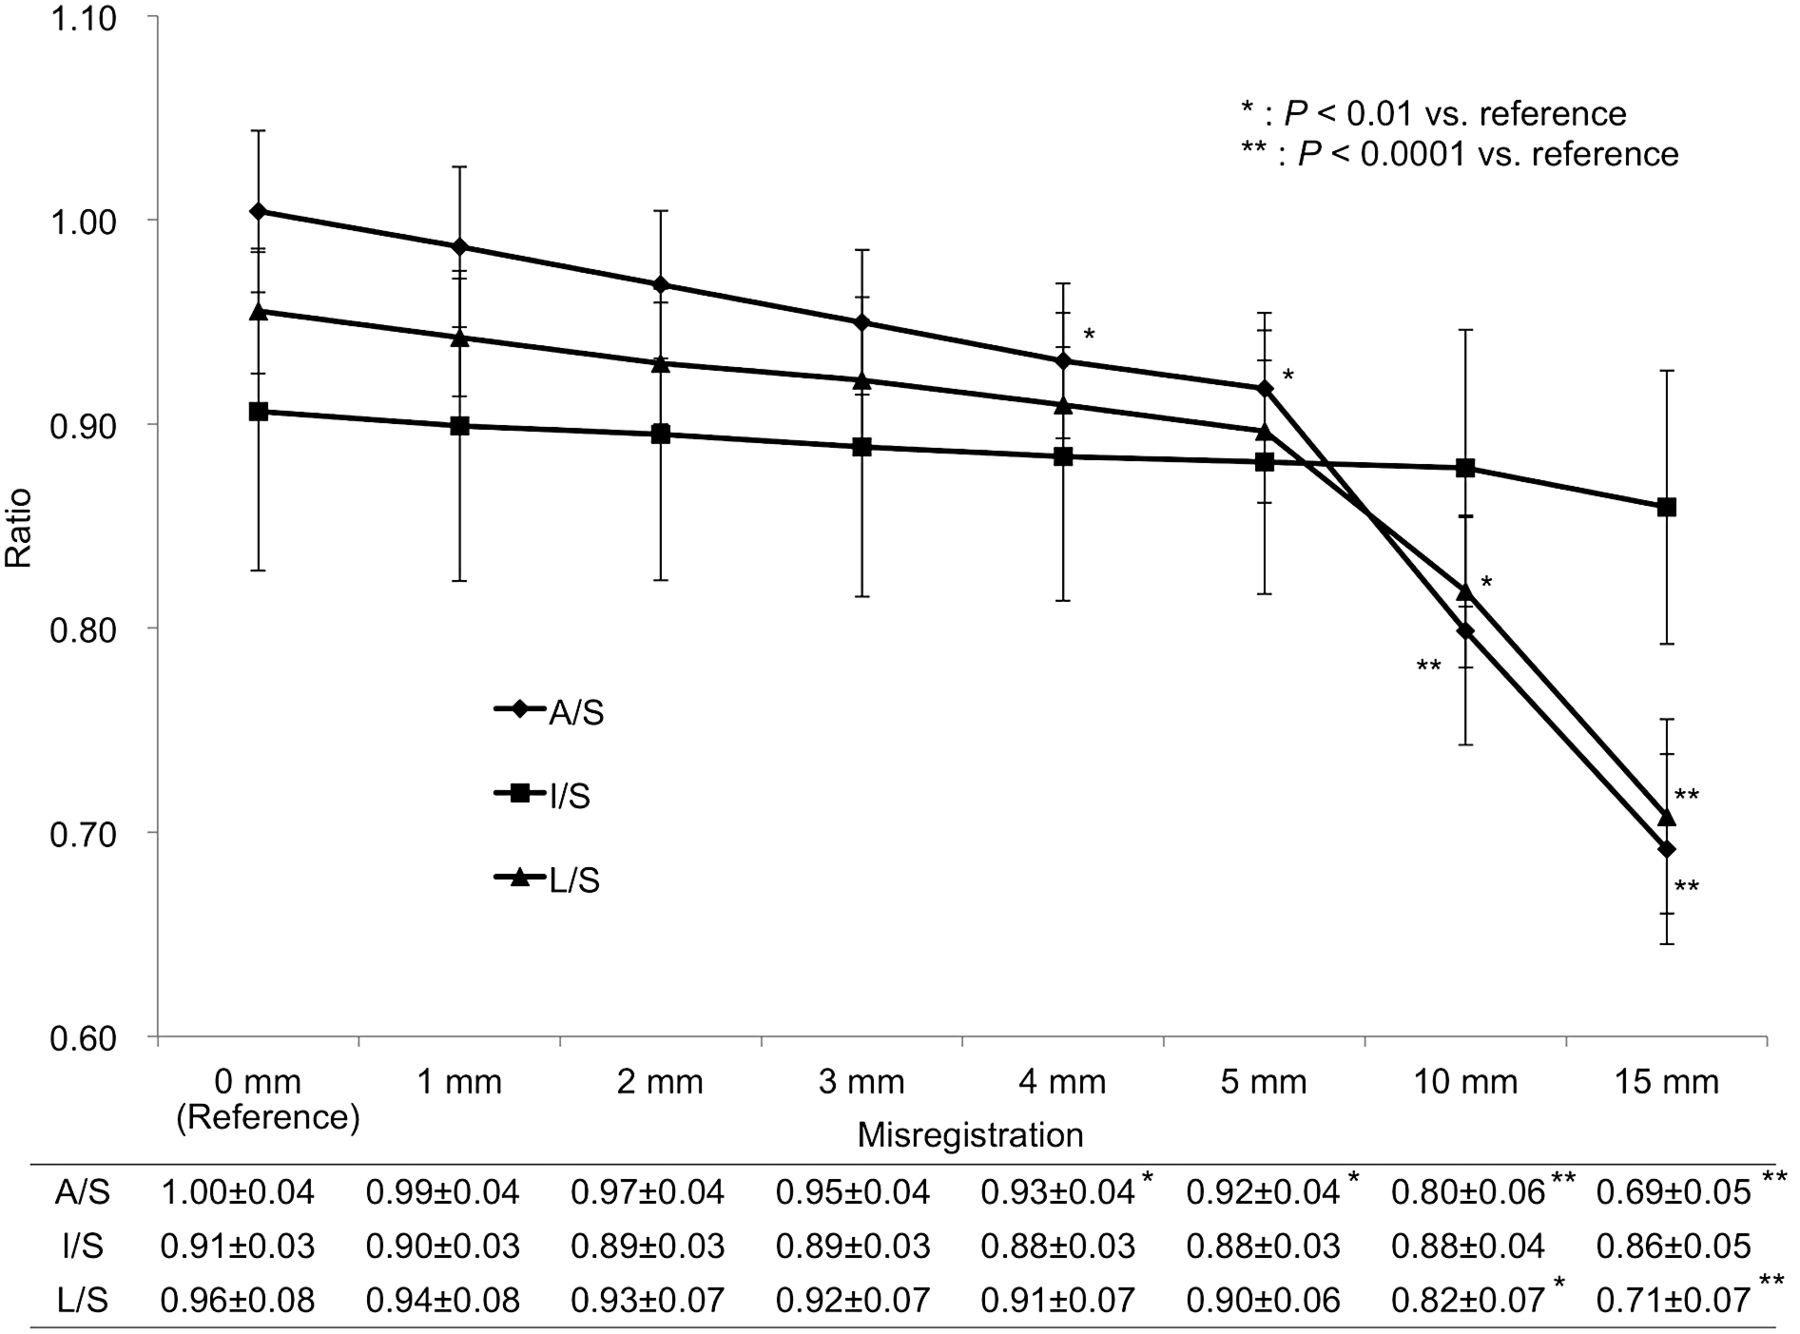
Uptake ratios of anterior, inferior, and lateral walls with respect to septum (A/S, I/S, L/S, respectively) as function of misregistration degree. Error bars indicate SD.
DISCUSSION
In this study of the effect of misregistration on myocardial 13N-ammonia uptake using PET/CT with 3D OSEM combined with TOF and PSF modeling, our main finding was a statistically significant artifactual reduction in the anterior and lateral walls when misregistration was 10 mm or more.
Previous 2D PET/CT studies demonstrated that artifactual defects occurred predominantly in the LV anterior and lateral walls (4,5,7), which have the largest surface area in common with the lung. When there is a substantial overlap between lung and heart, the marked difference in attenuation factors between lung and heart is considered a main reason for the observed changes in measured uptake (6). Motion from the head to the feet—the main direction of breathing motion—has been mentioned as the major component of misregistration of the common surface area between lung and heart (21). Moreover, the LV wall has a larger surface area in common with the lung in the left–right direction than in the anterior–posterior direction, excepting the head–foot direction (Fig.1). Therefore, misregistration along the left–right, head–foot direction can be the key to creating maximal overlap between lung and heart. Rajaram et al., in their 2D PET/CT study evaluating the impact of emission–transmission misregistration on myocardial blood flow quantification, artificially created 5- and 10-mm misregistrations along both the x-axis (left) and the z-axis (cranial) such that the lung parenchyma in CT overlapped the anterior and lateral LV walls in PET (6). PET/CT systems with 3D OSEM combined with TOF and PSF modeling have been shown to significantly improve PET image quality (9–18,22–26). However, it is still unknown whether the influence of PET/CT misregistration on myocardial uptake is greater for 3D PET/CT than for 2D PET/CT. In the current study, a misregistration scheme similar to that of Rajaram et al. was used to evaluate the effect of misregistered 3D PET and CT-attenuation images on myocardial uptake of 13N-ammonia (6).
Our study found that misregistration of greater than 10 mm causes a statistically significant artifactual error in uptake. Gould et al. found in their 2D PET/CT study that transaxial misregistration of greater than 6 mm frequently causes mild artifactual defects and that the severity increases as the misregistration increases from a range of 6–10 mm to more than 10 mm (4). Lautamäki et al. also performed a 2D PET/CT study and found that misregistrations of 10 and 14 mm resulted in up to a 19% and −25% change in relative uptake in the septum and the lateral wall, respectively, whereas a 5-mm misregistration had no noticeable effect on uptake (8). Our results are in line with the results of those 2D PET/CT studies (4–8), indicating that the influence of misregistration on altered uptake is similar between 3D PET/CT and 2D PET/CT.
We acknowledge that this study had several limitations. First, relatively few subjects were included, and only one was female. Second, there is no true gold standard for the uptake in this study. Therefore, manually registered PET/CT images were used as a reference according to a previous study (6). Third, we did not compare the influence of PET/CT misregistration on uptake between breath-hold and free-breathing CT-attenuation images. Further investigation is required of how the different CT-attenuation schemes affect PET/CT misregistration. Fourth, the impact of misregistration was evaluated only in the resting state. The degree of relative uptake might change with stress-related high rates of blood flow. In this regard, a further investigation is needed. Fifth, the subjects were healthy and did not have coronary artery disease.
CONCLUSION
Visual assessment of PET/CT images obtained with 3D OSEM combined with TOF and PSF modeling showed a statistically significant erroneous decrease in 13N-ammonia uptake in the anterior and lateral myocardial walls when misregistration was 10 mm or more. Quantitative assessment showed a statistically significant decrease in the anterior wall–to–septum uptake ratio when misregistration was 4 mm or more and in the lateral wall–to–septum ratio when 10 mm or more.
DISCLOSURE
No potential conflict of interest relevant to this article was reported.
Acknowledgments
We thank the volunteer subjects and Akira Kamigiri, RT, Tsuyoshi Yamada, RT, and Hiroaki Maki, RT, at the Central Division of Radiology, Mie University Hospital, for their helpful assistance.
Footnotes
Published online Apr. 21, 2016.
REFERENCES
- Received for publication January 19, 2016.
- Accepted for publication March 22, 2016.


