


Abstract
18F-FDG PET/CT has emerged as one of the fastest-growing imaging modalities. A shorter protocol results in a lower target-to-background ratio, which can increase the challenge of identifying mildly 18F-FDG–avid lesions and differentiating inflammatory or physiologic activity from malignant activity. The purpose of this study was to determine the delay between radiotracer injection and imaging that optimizes target-to-background ratio while maintaining counts high enough to ensure scan sensitivity. Methods: The study included 140 patients (66 male and 74 female; age range, 42–95 y) with suspected hepatic lesions as seen on an 18F-FDG PET scan. SUV was determined as region-of-interest activity/(dose/total body weight). Results: The mean injected dose was 610 ± 66.6 MBq (16.5 ±1.8 mCi), with a mean glucose level of 107 ± 26.6 mg/dL (standardized to 90 mg/dL). The uptake time before imaging ranged from 61 to 158 min, with a mean of 108.8 ± 24.8 min. The P values for the correlation of SUV to time were 0.004, 0.003, and 0.0001 for malignant lesions, benign lesions, and background hepatic tissue, respectively. Conclusion: An approximately 90-min time window from 18F-FDG injection to PET imaging would significantly improve target-to-background ratio and, thus, quantitation and visual interpretation. This benefit outweighs the minimal loss in patient throughput.
Integrated 18F-FDG PET/CT has emerged as one of the fastest-growing imaging modalities. The recent expansion of coverage from the Centers for Medicare and Medicaid Services has made its use even more feasible for community-based hospitals and independent imaging centers. To maximize throughput, many of these centers use a 50- to 60-min uptake time after 18F-FDG injection while arguing that the counting statistics are improved using this protocol (1–3). However, this shorter protocol results in a lower target-to-background ratio, which can increase the challenge of identifying mildly 18F-FDG–avid lesions and differentiating inflammatory or physiologic activity from malignant activity (4–6).
The purpose of this study was to determine the delay between radiotracer injection and imaging that optimizes target-to-background ratio while maintaining counts high enough to ensure scan sensitivity. Hepatic lesions and background hepatic tissue were chosen as the test and control tissues because 18F-FDG has a relatively predictable parabolic uptake pattern in the liver (7,8). Additionally, the heterogeneous or mottled appearance of the liver often presents a challenge during image interpretation by producing areas of benign focal uptake or masking uptake within a malignant lesion (6).
MATERIALS AND METHODS
The study was approved by the human investigation committee at William Beaumont Hospital (study 2012-226). The population comprised 140 patients (66 male and 74 female; age range, 42–95 y) with suspected hepatic lesions as seen on an 18F-FDG PET scan. All enrolled patients had a primary malignancy and either had been referred for initial staging or had completed their most recent therapy at least 4 wk previously. The primary tumor could be any type and, in the enrolled population, included colorectal cancer, lung cancer, breast cancer, melanoma, lymphoma, and squamous cell cancer of the head and neck. All 140 lesions were biopsy-proven, with 93 being positive for malignancy and 47 negative. All were considered metastatic. The most suggestive and accessible liver lesion was used for the biopsy even when there was more than one lesion. Only the lesions that underwent biopsy were used in the final kinetic analysis. The number of diabetic patients in the study was not tracked.
Image Acquisition
Imaging was performed on a mobile 16-slice PET/CT unit (ECAT EXACT or Biograph 40; Siemens) after the patients had been injected with 370–740 MBq (10–20 mCi) of 18F-FDG. Patients with a serum glucose level of greater than 200 mg/dL at the time of injection were not included in the dataset. The typical imaging protocol called for a delay of 60–90 min between injection and imaging; however, this interval varied significantly because of dual-time protocols, throughput requirements, and external workflow factors. The patients were imaged from the base of the skull to the middle of the thighs using 6 bed positions. A similar reconstruction method, ordered-subsets expectation maximization, was used for all images. Concomitant CT with oral contrast medium was performed using 140 kVp, 120–200 mA, 0.8 s per rotation, a 1.75:1 pitch, and a 3-mm slice thickness, and the data were applied for attenuation correction of the PET images. SUV was calculated as region-of-interest activity/(dose/total body weight).
Image Analysis
A 3-dimensional region of interest was drawn over each suspected lesion to obtain its SUVmax. The mean of 5 regions of interest 10 mm in diameter over normal liver, measuring average SUV, was used to obtain the SUV representative of physiologic liver activity. All SUV measurements were then corrected for the patient’s individual serum glucose variation to 90 mg/dL, using the method described by Thie et al. (9).
Statistical Analysis
Second-order polynomial regression was used to individually plot the glucose-corrected SUVs of malignant lesions, benign lesions, and background hepatic tissue over time (by restraining the origin to zero) (10). Each data point was logarithmically interpolated using the Patlak method to generate time–activity curves with 95% confidence intervals (11). The P values of the SUV of each tissue type as a function of time were determined from the Pearson correlation coefficients.
RESULTS
The mean injected dose of 18F-FDG was 610 ± 66.6 MBq (16.5 ±1.8 mCi), and the mean glucose level was 107 ± 26.6 mg/dL (standardized to 90 mg/dL). The uptake time before imaging ranged from 61 to 158 min, with a mean of 108.8 ± 24.8 min. The P values for the correlation of SUV to time were 0.004, 0.003, and 0.0001 for malignant lesions, benign lesions, and background hepatic tissue, respectively. Regression analysis of the cohort showed that the SUV of background hepatic tissue decreased rapidly between 60 and 90 min after injection, reaching its nadir around 110 min and then staying relatively stable (Fig. 1). Malignant and benign lesions overlapped significantly in SUV at 60 min and would have been difficult to distinguish from each other before 90 min, when the mean SUVs reached divergence by at least a factor of 2. The SUVs of malignant lesions correlated positively with time, whereas the SUVs of benign lesions correlated negatively.
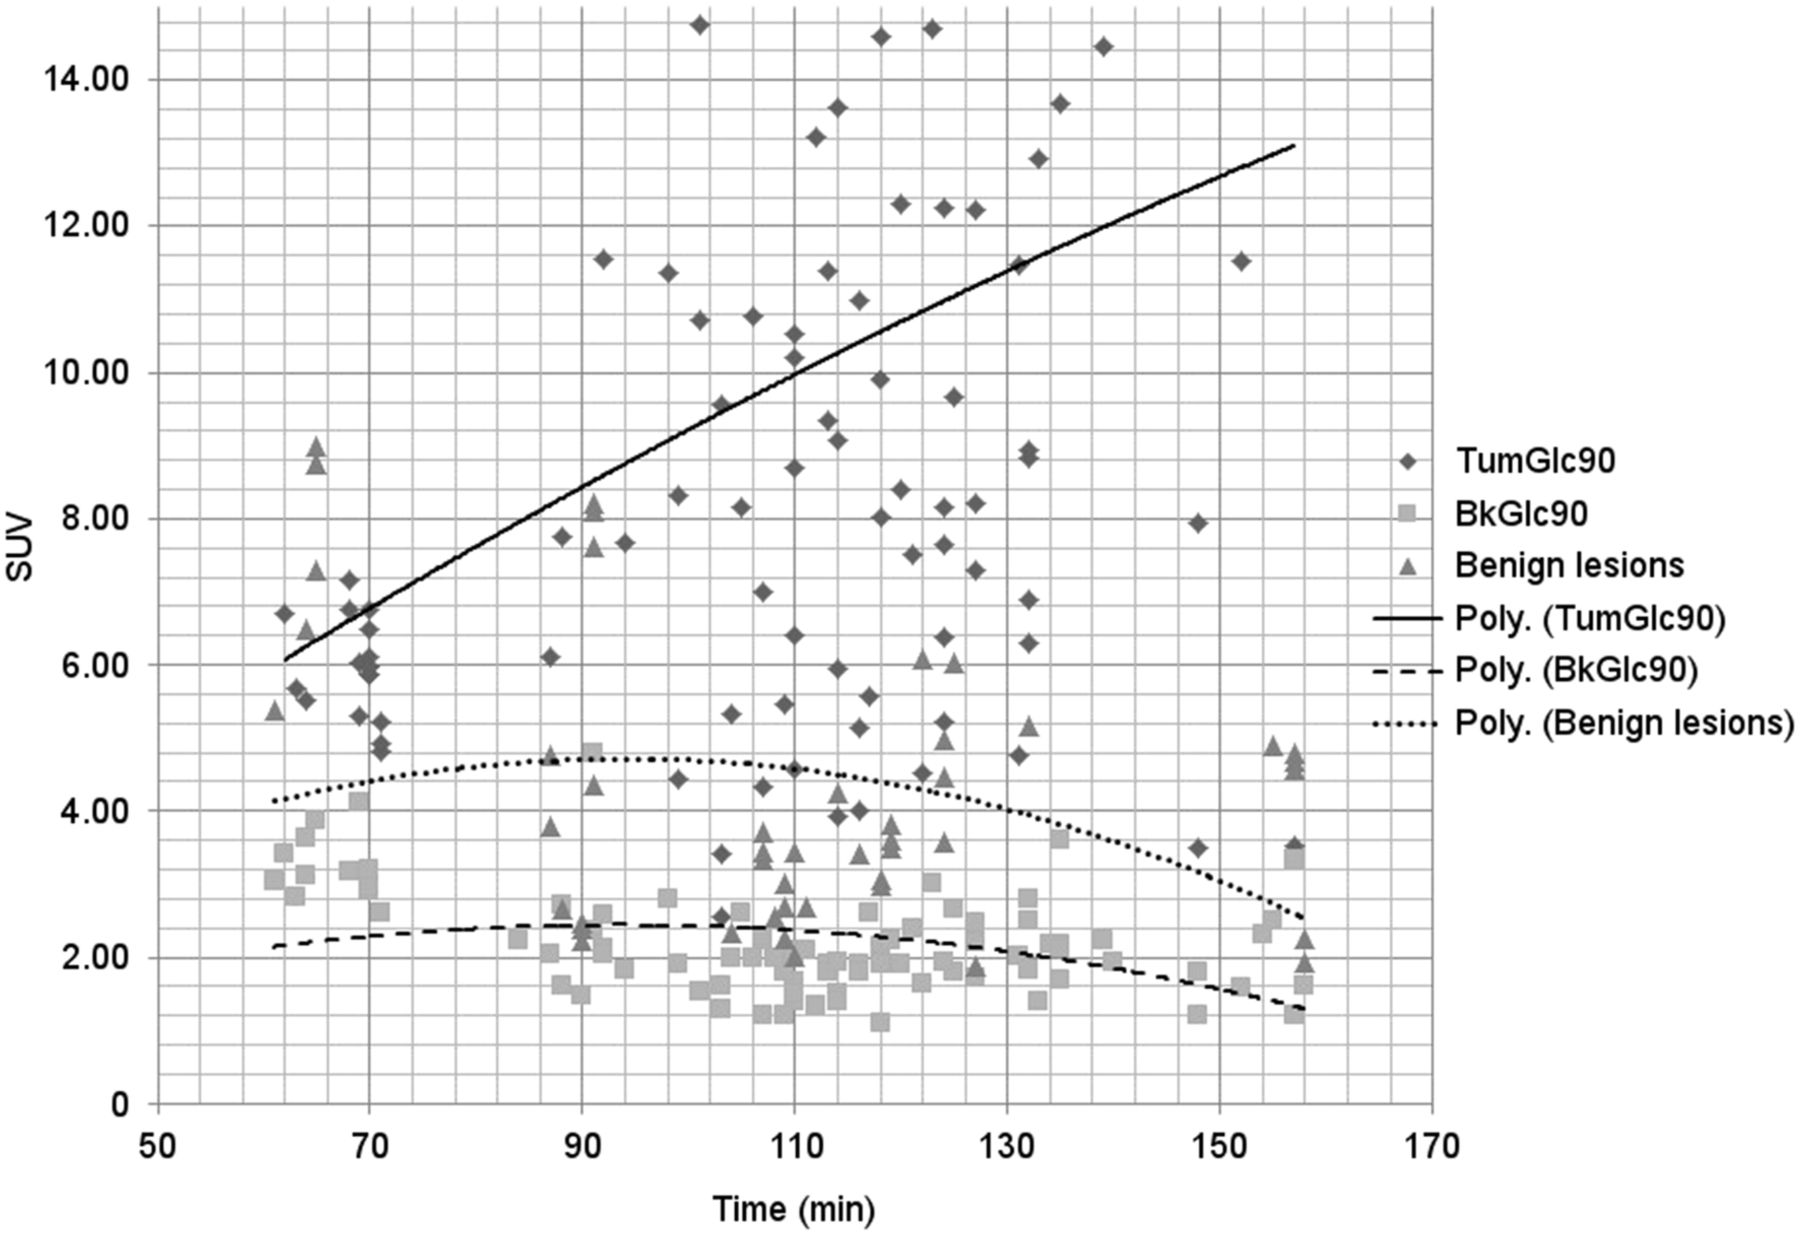
Polynomial (Poly.) regression plot (by restraining origin to zero) of SUVs standardized to a 90 mg/dL glucose level for each lesion (TumGlc90) and its background hepatic tissue (BkGlc90) as a function of time.
The logarithmic-scale time–activity curves generated using the Patlak model for each tissue type (malignant, benign, and background hepatic) are shown in Figure 2. The SUV was still increasing at 60 min for all 3 types, began to level off at around 80–90 min for background hepatic tissue and benign lesions, and continued to increase rapidly until plateauing at around 130 min for malignant lesions. The divergence of malignant from benign lesions occurred later than the divergence of either type of lesion from background hepatic tissue.
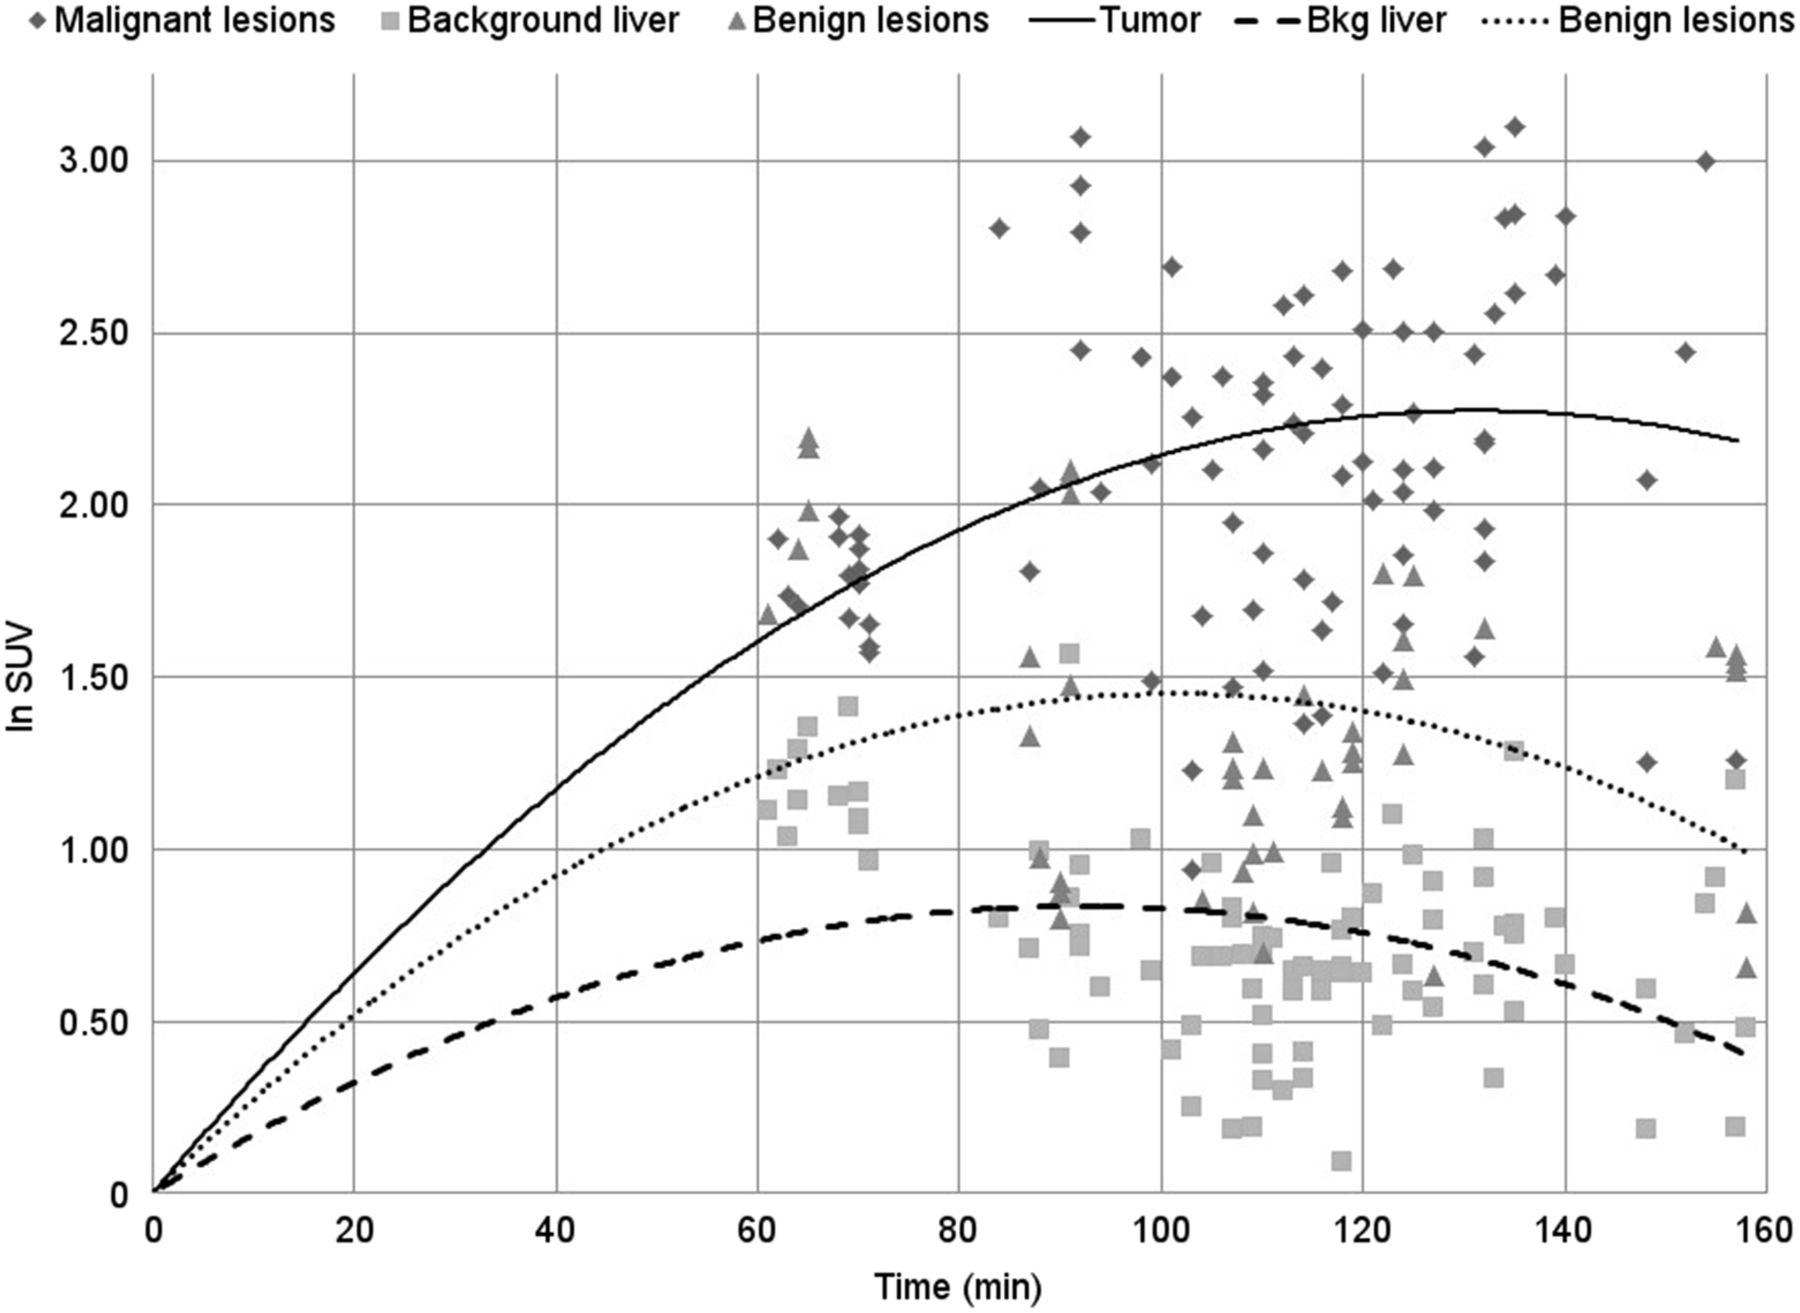
SUV vs. time-interpolated data over the entire period. Time–activity curves for each tissue type based on modeled data show similar uptake at 60 min. SUV of malignant tumors diverges at around 80 min.
DISCUSSION
The results demonstrate the significant effect that the time between radiotracer injection and imaging has on activity in malignant versus benign or normal tissue. With background hepatic tissue serving as the control tissue, the time–activity curve of benign hepatic lesions closely followed that of normal liver except for having a higher starting activity. The SUV of the 3 tissue types did not begin diverging until 80 min, when the signal from benign and background tissue began to plateau whereas that from malignant tissue continued to increase. The modeled time–activity curves also accurately reflected the decreased retention index of metabolically active normal tissue (e.g., hepatocytes, inflamed tissue, and granulation tissue), compared with metabolically active tumors (12,13). The decreased separation in activity caused by imaging too soon after radiotracer injection will affect quantitative image analysis, particularly when using methods that rely on contrast from background hepatic tissue for comparison. On the other hand, prior studies have shown that imaging beyond 2 h after injection has little benefit and that imaging beyond 3 h may lead to confounding results (13,14). Figure 2 also supports the results of those studies, as the SUV of malignant lesions plateaus at around 2 h.
Additionally, a short uptake time before imaging can cause a noisier image that can be more challenging to interpret (13). Another finding of our study was that some metastatic lesions were masked by high background activity due to a short uptake time and became apparent only on delayed imaging. In contrast, a short uptake time produced heterogeneous activity, with an area that appeared more focal. However, on delayed imaging this area washed out and became similar to background hepatic tissue. This marked change in target-to-background contrast may lend credence to many dual-time imaging protocols that have been proposed to improve 18F-FDG characterization of liver lesions (15,16).
This study demonstrated that a shorter delay results in higher background activity, which has been proven to reduce overall PET sensitivity and accuracy (17). Any loss of patient throughput by adopting a 90-min delay could be mitigated by appropriately staggering injection times. Standardization of imaging protocols across different facilities would have many benefits. The comparability of studies and cross-correlation of SUV would be simplified, which becomes important when the care of patients is transferred to a different institution and their treatment response needs to be established (18). Additionally, many data collection studies and quantitative image analysis techniques would have greater universal applicability, which might help advance PET applications more rapidly (19). A longer uptake time before imaging would lead to fewer misleading SUV measurements and likely less misidentification and equivocation. However, it appears that dual-time protocols comprising imaging at 60 and 120 min after injection would be most appropriate to elicit a difference in retention index between benign and malignant lesions.
CONCLUSION
An approximately 90-min time window from 18F-FDG injection to PET imaging would significantly improve target-to-background ratio and, thus, quantitation and visual interpretation. This benefit outweighs the minimal loss in patient throughput.
DISCLOSURE
No potential conflict of interest relevant to this article was reported.
Acknowledgments
We thank Robert Ceruti, CNMT, and William Weifeng Wong, Cranbrook Educational Community, for their help with the figures.
Footnotes
Published online Mar. 10, 2016.
REFERENCES
- Received for publication November 16, 2015.
- Accepted for publication February 12, 2016.


Jump to section
Related Articles
Cited By...
- No citing articles found.