


Article Figures & Data
Figures
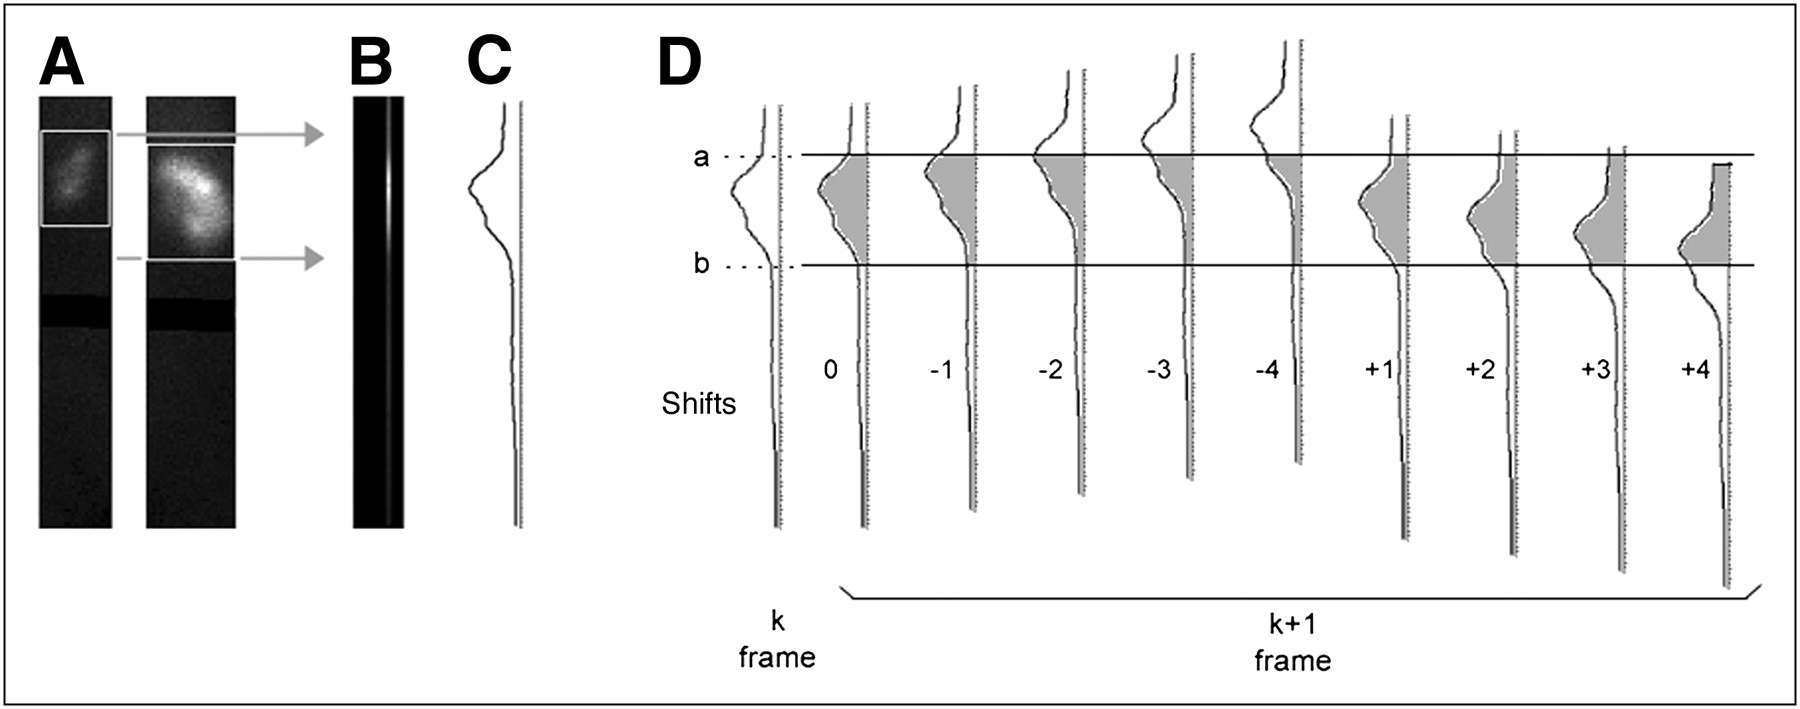
- FIGURE 1.
(A) Columns of pixels are summed across width of each whole-kidney box, 128 pixels from top to bottom of image matrix. (B and C) Area of 2 kidneys is bounded by top of uppermost box and bottom of lowermost box, as shown by gray arrows. Pixel columns are summed into single column (B), in which brightest area reflects counts from both kidneys. Summed column can be represented by count profile (shown vertically in C), and profile for each frame is then compared. (D) Frame-to-frame shift detection takes place, with frame k as initial reference frame. Height of kidneys, from a to b, defines area under curve representing total counts in kidneys in this frame. Using same a and b locations, frame k + 1 is shifted upward 0–4 pixels and downward 1–4 pixels, in 0.25-pixel increments. Count total is taken from a to b and compared with total from k. Shift amount (lag) corresponding to total that most closely matches k gives shift of k + 1. Because lag can be as small as 0.25, predicted location of frame k + 1 is determined to within 0.25 pixel. k + 1 then becomes reference for frame k + 2, and sequence is repeated.
- FIGURE 2.
Detection of shifts in original images.
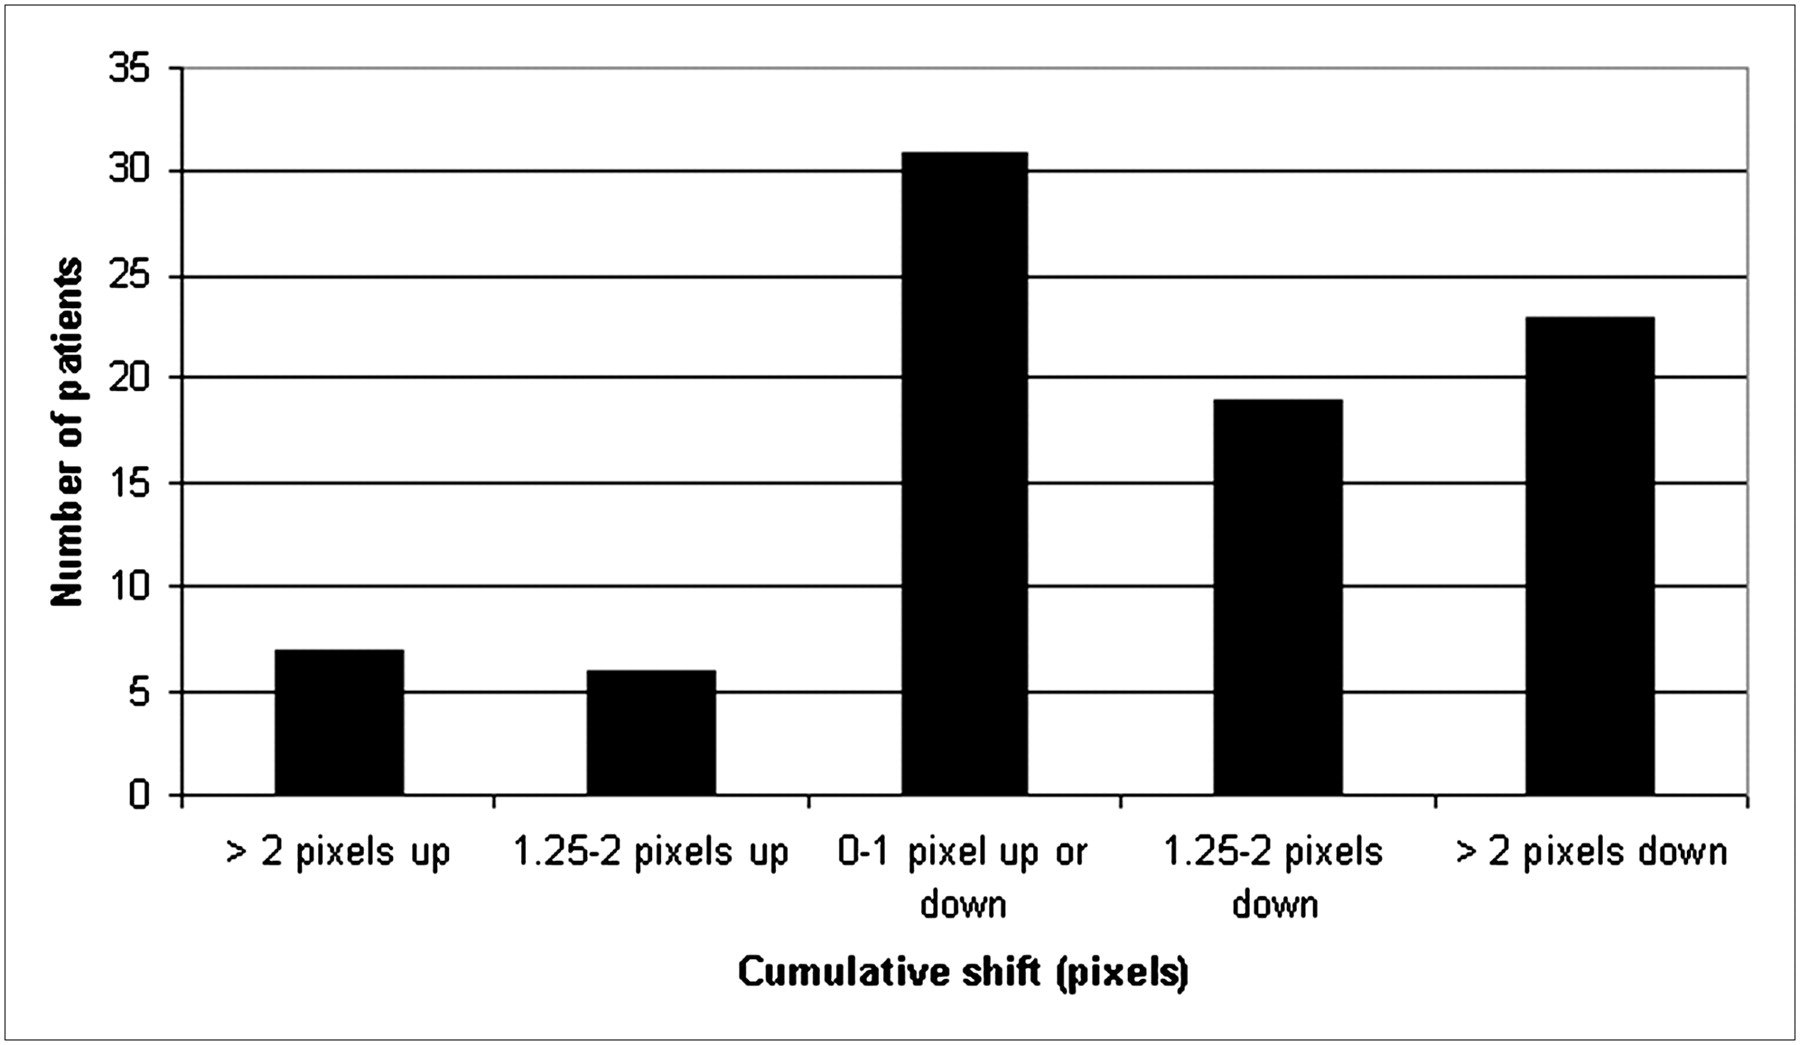
- FIGURE 3.
Detection of cumulative shift over any range of frames in original data.
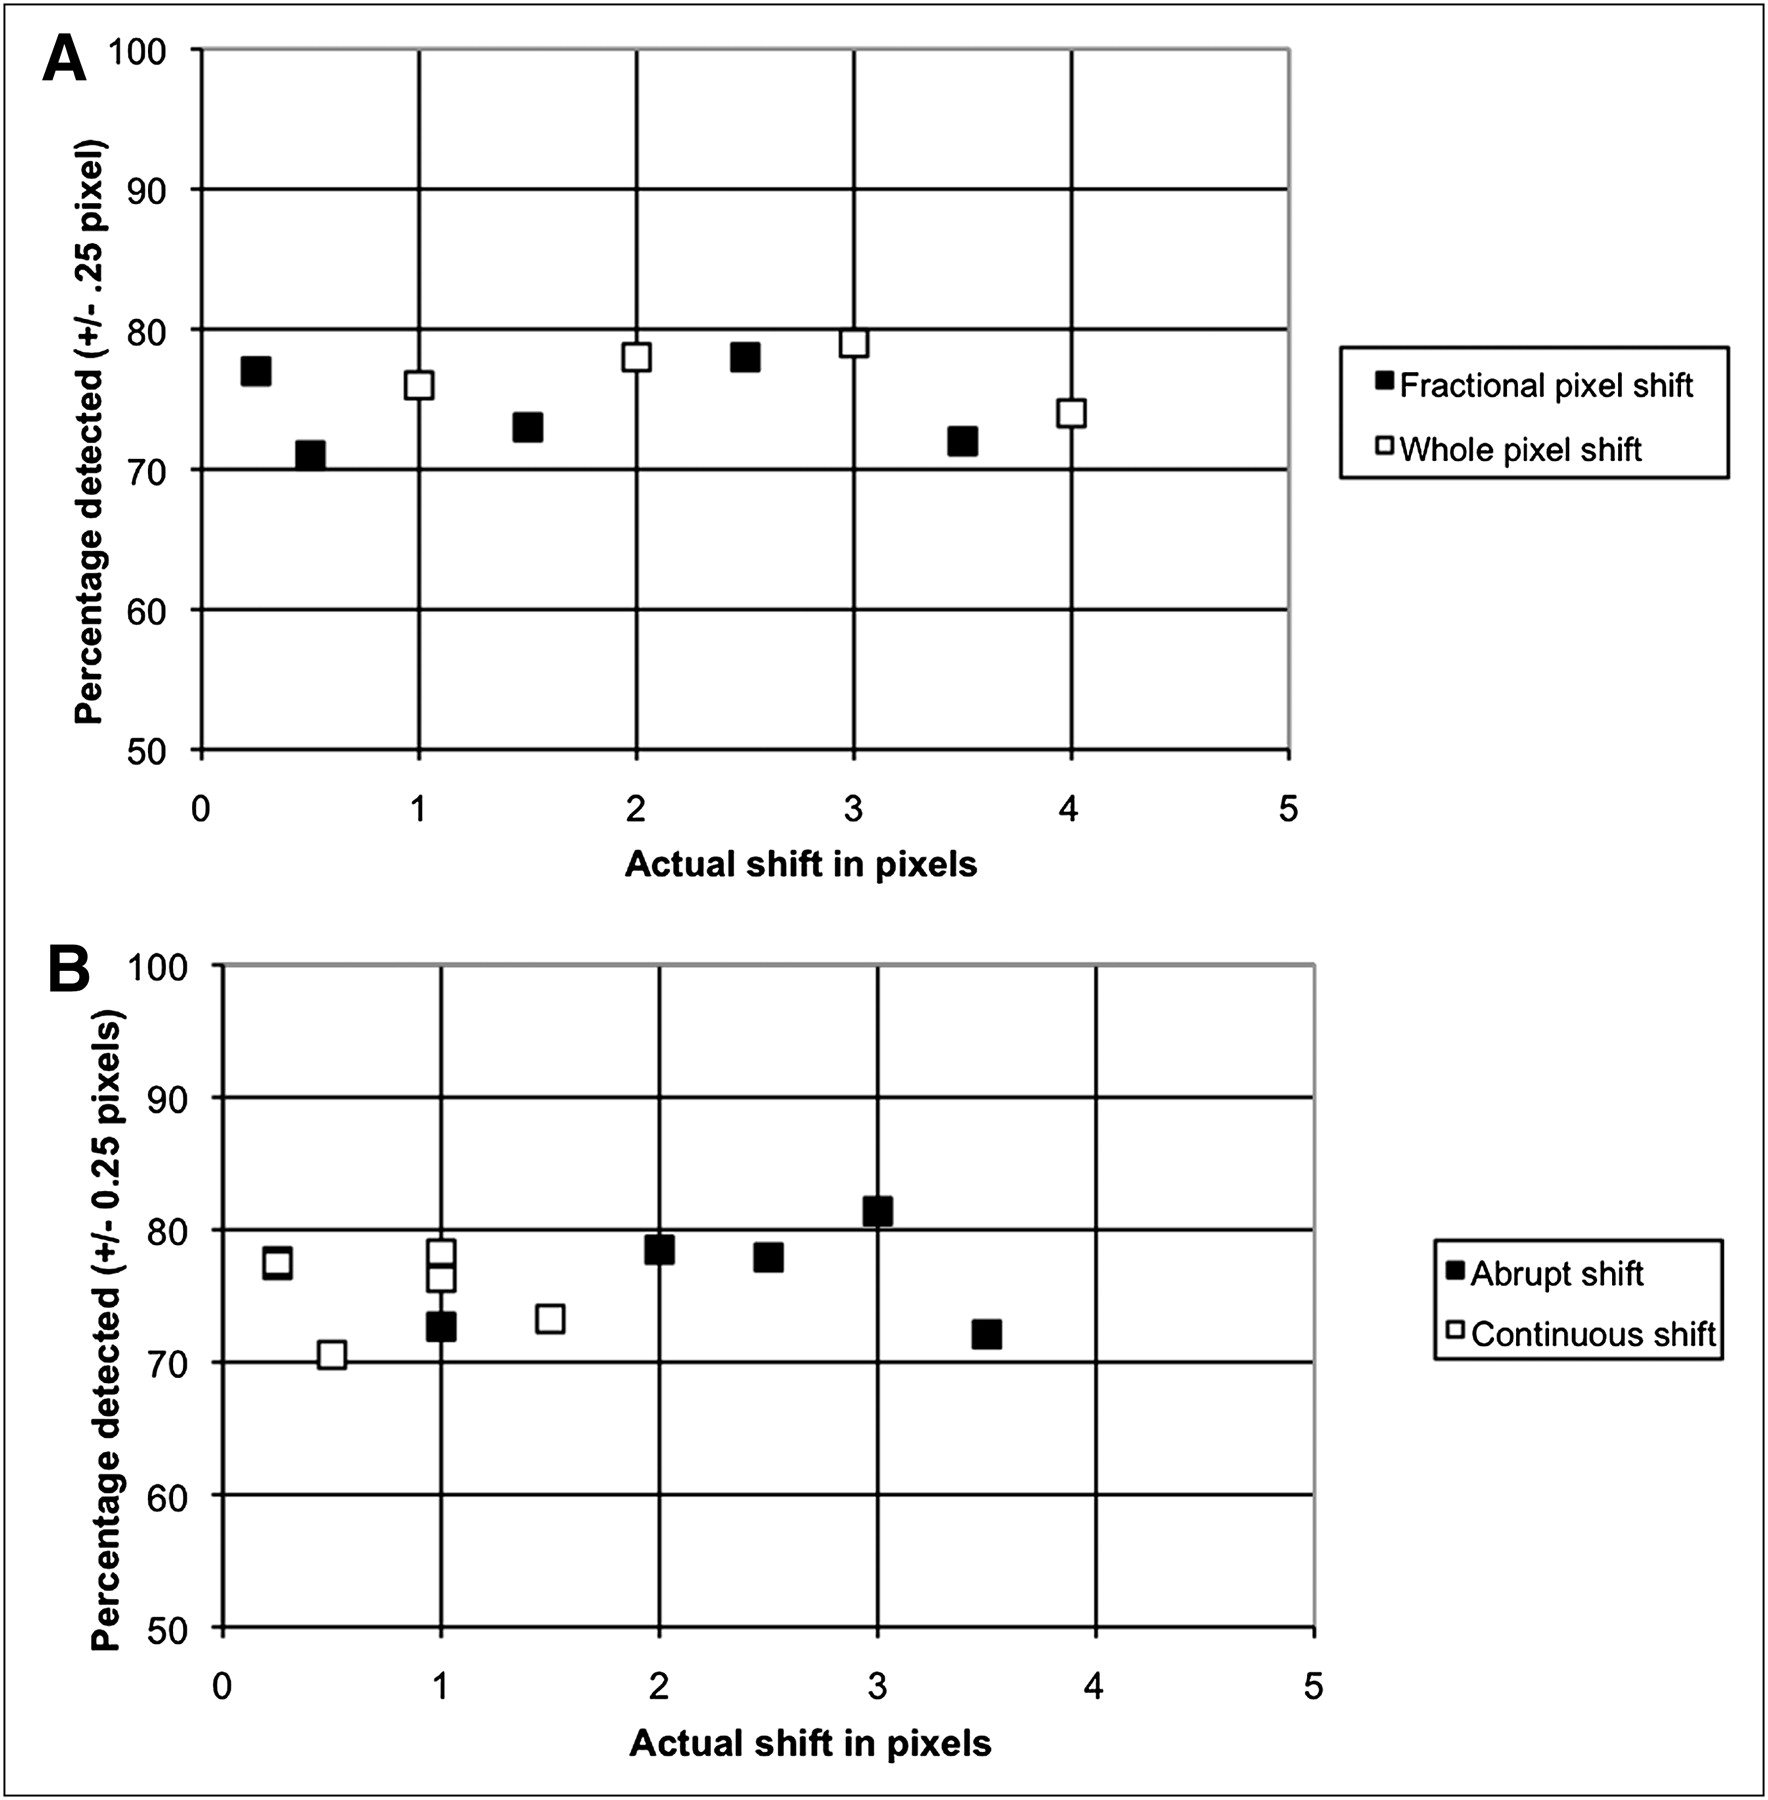
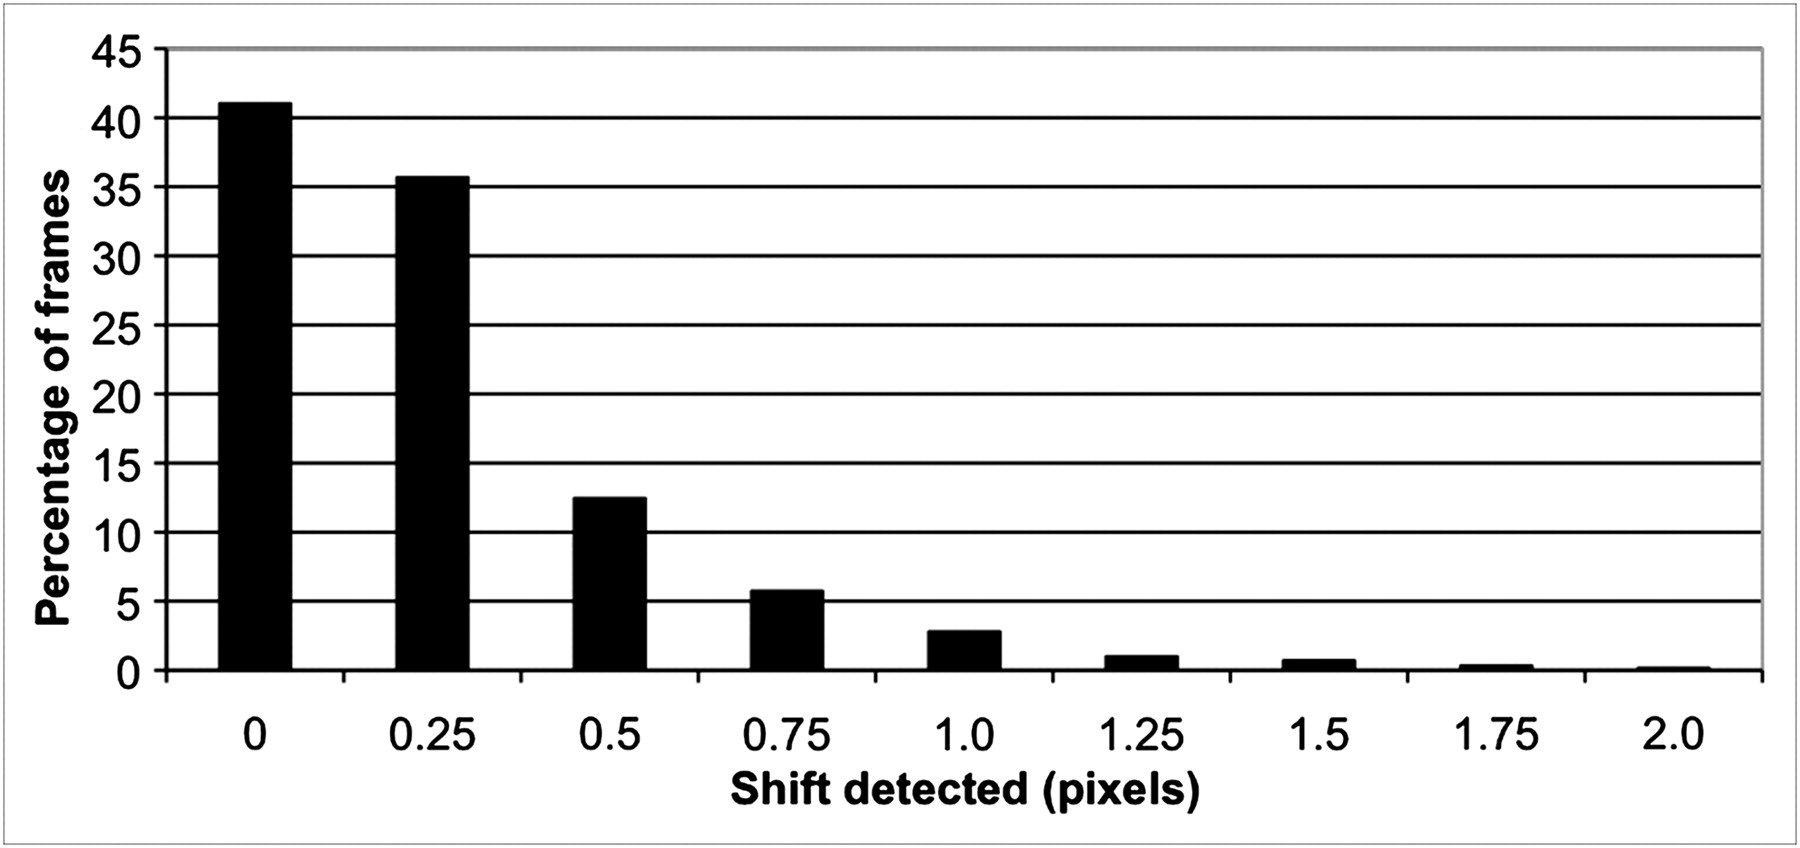
- FIGURE 4.
Detection of simulated shifts of various types and magnitudes. Shifts that are present in original data are not subtracted. (A) Plot of percentage motion detected for fractional- and whole-pixel shifts. (B) Plot of percentage motion detected for abrupt and continuous shifts.
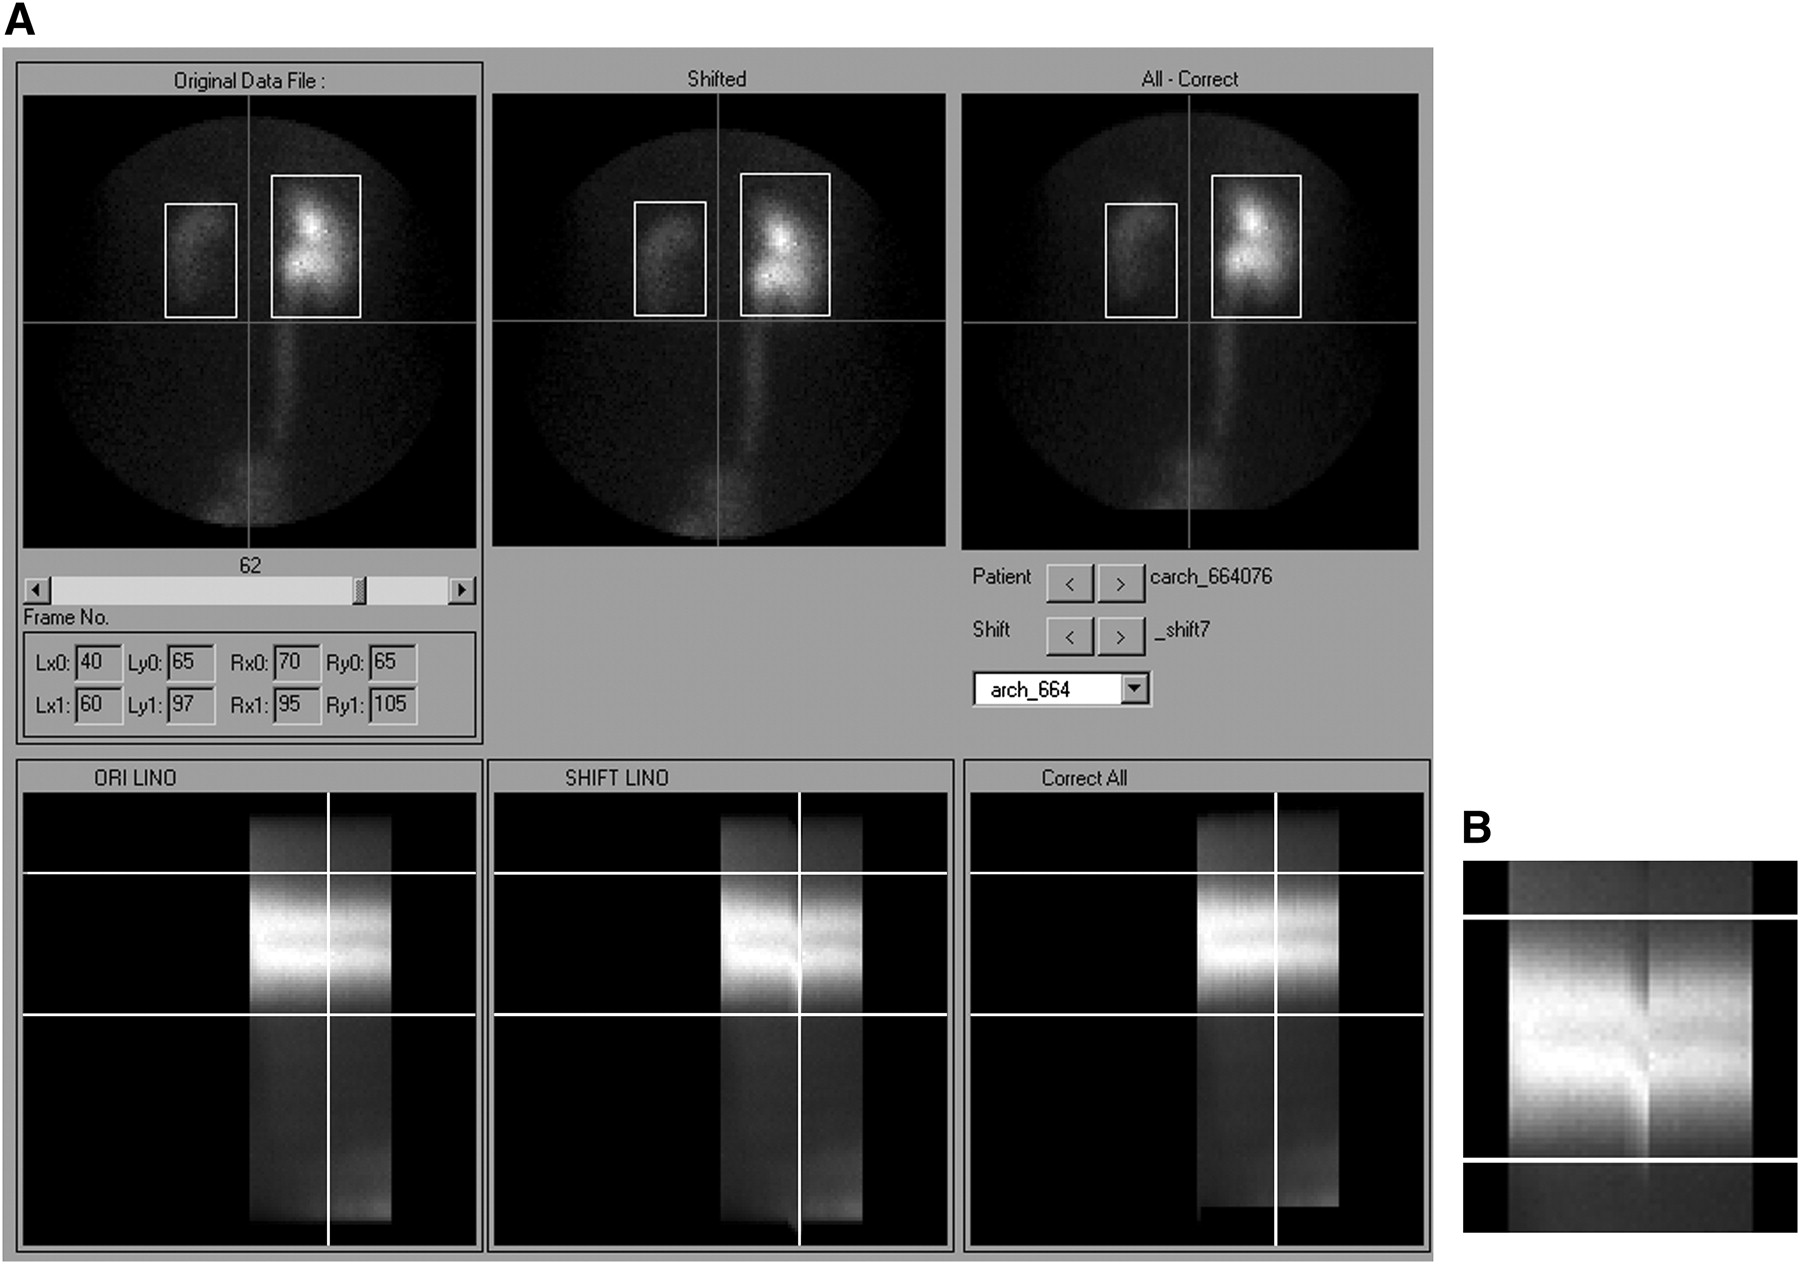
- FIGURE 5.
Example patient study shown in visual motion review tool. (A) Below each kidney image is corresponding linogram for original images (left column), images with simulated shift (center column), and motion-corrected images (right column). Slider control allows review of any image frame, and current frame position is indicated by vertical line on all linograms. (B) Enlarged view of linogram with image shifts, without vertical line marker. This tool allows user to select any of 86 patients, and any of 10 artificial shifts, for visual comparison of uncorrected and corrected images and linograms.
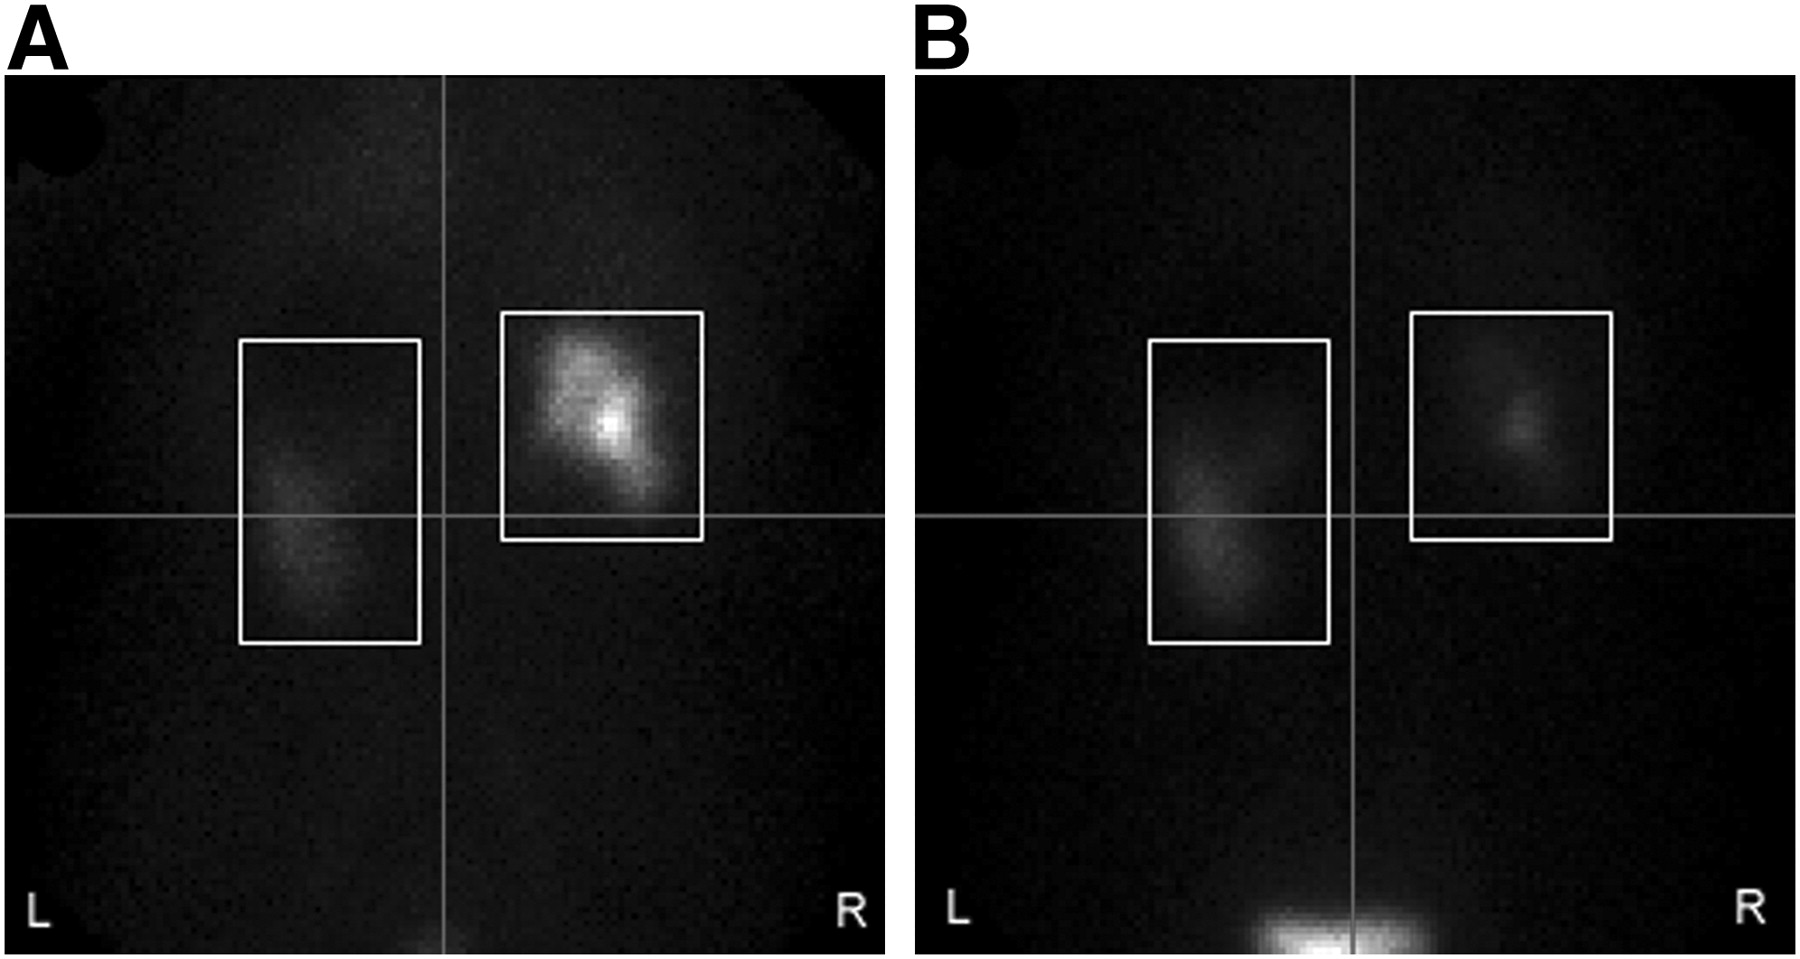
- FIGURE 6.
Image frames 4 min (A) and 24 min (B) after injection of 99mTc-MAG3. (A) First frame of range that underwent motion detection. This patient shows little uptake of 99mTc-MAG3 in left kidney at 4 min. In profile generated by summing pixel columns in both kidneys, most counts are contributed by right kidney, causing higher profile peak. (B) At 24 min, right kidney has excreted 99mTc-MAG3 into bladder, and more counts in profile are contributed by left kidney, which retains 99mTc-MAG3. Because profile peak is thus lower than in A, vertical motion may be falsely implied.

Tables
Shift Minimum shift Maximum shift Start frame Number of frames Initial shift Return shift Abrupt Whole-pixel 1 1 44 7 ↑ ↓ 3 3 59 2 ↓ ↑ 2 2 64 7 ↑ ↓ Fractional 2.5 2.5 59 7 ↓ ↑ 3.5 3.5 78 2 ↑ ↓ Gradual Whole-pixel 1 4 59 5 ↓ ↑ 1 3 69 4 ↑ ↓ Fractional 0.25 1.5 59 7 ↑ ↓ 0.5 3 49 7 ↑ ↓ 0.25 1 59 5 ↓ ↑ ↑ = shift up; ↓ = shift down.
Type of shift Magnitude y y + x Fractional 0.25 77 76 0.5 71 70 1.5 73 73 2.5 78 70 3.5 72 73 Whole-pixel 1 76 76 2 78 76 3 79 72 4 74 74 Abrupt 1 73 73 2 78 76 2.5 78 70 3 81 73 3.5 72 73 Continuous 0.25 77 76 0.5 71 70 1 77 77 1.5 73 73 Data are magnitude of pixel shift and percentage of frames shifted for vertical motion (y) and vertical plus horizontal motion (y + x).
Parameter Shift 4 Shift 5 Shift 6 Shift 8 Shift 10 Mean 59.8 72.8 59.8 51.7 51.6 SD 7.2 7.5 12.8 13.5 16.8 Maximum 75.8 86.7 83.8 72.4 69.0 Minimum 42.0 50.9 20.4 14.2 0.0 100% count recovery implies that counts in kidney ROI after motion correction are same as before motion took place.


Jump to section
Related Articles
Cited By...
- No citing articles found.