


Abstract
Kidney motion during dynamic renal scintigraphy can cause errors in calculated renal function parameters. Our goal was to develop and validate algorithms to detect and correct patient motion. Methods: We retrospectively collected dynamic images from 86 clinical renal studies (42 women, 44 men), acquired using 99mTc-mercaptoacetyltriglycine (80 image frames [128 × 128 pixels; 3.2 mm/pixel]: twenty-four 2-s frames, sixteen 15-s frames, and forty 30-s frames). We simulated 10 types of vertical motion in each patient study, resulting in 860 image sets. Motion consisted of up or down shifts of magnitude 0.25 pixel to 4 pixels per frame and was either a gradual shift additive over multiple frames or an abrupt shift of one or more consecutive frames, with a later return to the start position. Additional horizontal motion was added to test its effect on detection of vertical motion. Original and shifted files were processed using a motion detection algorithm. Corrective shifts were applied, and the corrected and original (unshifted) images were compared pixel by pixel. Motion detected in the shifted data was also tabulated before and after correction of motion detected in the original data. A detected shift was considered correct if it was within 0.25 pixel of the simulated magnitude. Software was developed to facilitate visual review of all images and to summarize kidney motion and motion correction using linograms. Results: Overall detection of simulated shifts was 99% (3,068/3,096 frames) when the existing motion in the original images was first corrected. When the original motion was not corrected, overall shift detection was 76% (2,345/3,096 frames). For image frames in which no shift was added (and original motion was not corrected), 87% (27,142/31,132 frames) were correctly detected as having no shift. When corrected images were compared with original images, calculated count recovery was 100% for all shifts that were whole-pixel magnitudes. For fractional-pixel shifts, percentage count recovery varied from 52% to 73%. Visual review suggested that some original frames exhibited true patient motion. Conclusion: The algorithm accurately detected motion as small as 0.25 pixel. Whole-pixel motion can be detected and corrected with high accuracy. Fractional-pixel motion can be detected and corrected, but with less accuracy. Importantly, by accurately identifying unshifted frames, the algorithm helps to prevent the introduction of errors during motion correction.
Body motion during imaging is an important cause of visual artifacts and reduced reliability of computerized, quantitative image analysis techniques in several imaging procedures (1–13). The effects of motion can result from patient movement, normal respiration, and normal cardiac motion.
Quantitative nuclear renography using 99mTc-mercaptoacetyltriglycine (99mTc-MAG3) has been applied for various clinical indications, including assessment of renal function (14), renal obstruction (15), and renovascular hypertension (16). Using appropriate software, several functional parameters can be calculated, compared with reference ranges (17,18), and used for the diagnosis of obstruction and renovascular hypertension.
Patient motion is a concern in renography because of the relatively long acquisition time, during which the patient is expected to remain still. Although any type of motion is possible, one common type is for the patient to slide toward the head or foot of the imaging table. Significant patient motion could potentially degrade the images and affect the slope of renal clearance curves. This effect most likely occurs through reduction of counts within the kidney regions, thus making an abnormal curve appear less abnormal. Motion could also adversely affect calculated parameters of renal function. For example, a change of 0.15 or greater in the ratio of counts in the renal cortex at 20 min after injection to the maximum cortical counts is a criterion for the diagnosis of renovascular hypertension (17). Motion at specific points during the study can distort this ratio on either the baseline or postcaptopril scan and lead to an incorrect diagnosis. This potential for misdiagnosis indicates the need for motion detection and correction. When there is marked patient motion and a correction algorithm is not available, a study may have to be repeated (19).
For a variety of imaging procedures, methods have been developed in other laboratories to monitor and correct motion, including the use of external radioactive point sources (20), optical sensors for patient monitoring (21), frame-to-frame tracking of image features (22), and manual correction of shifted frames. In recent years, sophisticated methods have been proposed to deal with body and respiratory motion in high-resolution imaging in which small or complex image features will be segmented as part of standard processing (11,13,23). Several methods for motion correction of radionuclide renograms have been reported. In 1992, De Agostini et al. reported a method for realigning shifted renogram images by using statistical methods to select from a set of shifted regions of interest (ROIs) the one that best represents the motion of features within the image (24). Lee and Barber used affine transformation with decomposition to correct renograms for motion (25).
We previously reported the development of QuantEM-II (26), a quantitative nuclear renography software package that is an enhanced version of the commercial program QuantEM (GE Healthcare). A computerized decision support system has been developed to aid in the interpretation of 99mTc-MAG3 scans in patients with suspected obstruction (27,28). To optimize the accuracy of the decision support system, which uses the quantitative output of QuantEM-II, it is necessary to monitor study quality, including patient motion. We have also reported the development of quality control software for use with QuantEM-II (29), although the quality control software did not originally include an algorithm for patient motion detection.
Our main goal in this study was to develop and validate a simple, computerized method to automatically detect and correct patient motion in acquired images. We decided to base our method on frame-to-frame cross-correlation, a well-established technique that has been used previously to correct motion in cardiac SPECT studies (30) and in planar dynamic radionuclide studies (31,32). A secondary goal was to develop a method to conveniently review renal studies before and after correction, by viewing sequential image frames as well as linograms, which allow the whole study to be summarized in a single image. The use of linograms to drive motion correction algorithms for SPECT has been reported by Wallis (33) and by Smith et al. (34).
MATERIALS AND METHODS
Patient Population
We retrospectively collected 86 clinical 99mTc-MAG3 renal studies. Seventy-six patients were referred for evaluation of possible renal obstruction, and 10 were renal transplant donors. There were 42 women and 44 men, selected without regard to image quality or renal function. The subjects ranged in age from 18 to 87 y, with total 99mTc-MAG3 clearance ranging from 25 to 475 mL/min/1.73 m2. The difference between the left and right kidney contributions to clearance ranged from 2 to 327 mL/min/1.73 m2.
Images were acquired using either of 2 γ-cameras, one having a circular field of view (Infinia; GE Healthcare) and the other a rectangular field of view (Vertex; Philips). The acquisition protocol consisted of 80 image frames (twenty-four 2-s frames, sixteen 15-s frames, and forty 30-s frames) using a 128 × 128 pixel matrix (3.2 mm/pixel). All studies were processed with QuantEM-II. Left and right whole-kidney ROIs were defined automatically by software, using a threshold technique, with manual adjustment as necessary.
Motion Simulation
All software was developed using Interactive Data Language (ITT Visual Information Solutions). To simulate vertical patient motion, software was developed to shift selected frames of the dynamic renal study by any desired amount. Ten types of vertical motion were defined, each having a specific combination of magnitude, direction, and range of frames shifted, as summarized in Table 1. Each of the 10 shifts was independently applied to each patient's dynamic study, resulting in 860 shifted image sets (86 patients × 10 shifts per patient). Shifts were applied only to the 30-s frames; therefore, in any 1 patient study there were 40 frames that could be shifted, resulting in a total of 34,400 image frames (40 frames × 860 image sets). The 86 original (unshifted) files and the 860 files containing shifted frames underwent motion detection.
Simulated Shifts Introduced into Image Frame
Additional horizontal motion was also simulated using a 4-pixel horizontal (x direction) shift added to each frame that already had simulated y-direction motion. The horizontal shift was either leftward or rightward. All sets of images with both vertical and horizontal motion again underwent motion detection.
Motion Detection
The motion detection uses linear cross-correlation, an algorithm that characterizes the difference between mathematic functions. In this case, the functions to be compared are count profiles through successive images in the dynamic sequence. In our implementation of cross-correlation, frame 41 (the first frame in the series to be examined) is the initial standard. As illustrated in Figure 1, a tight box is generated around each kidney using the outer limits of the stored kidney ROIs. The counts from pixel rows within each box are summed through all columns within the region of the kidneys, producing a vertical count profile for frame 41. Frame 42 is then shifted vertically upward (or lagged, in the terminology of cross-correlation) in increments of 0.25 pixel (0.8 mm) from 0.25 to 4.0 pixels and then shifted vertically downward by the same amounts. The profile for each shifted version of frame 42 is calculated and correlated to the profile in frame 41 by comparing the areas under each curve. The lagged frame 42 profile that results in the minimum difference from frame 41 corresponds to the amount of motion that occurred between frames 41 and 42. After this determination, frame 42 becomes the standard of comparison for determining the shift in the next frame, and this process continues to the end of the set of frames.
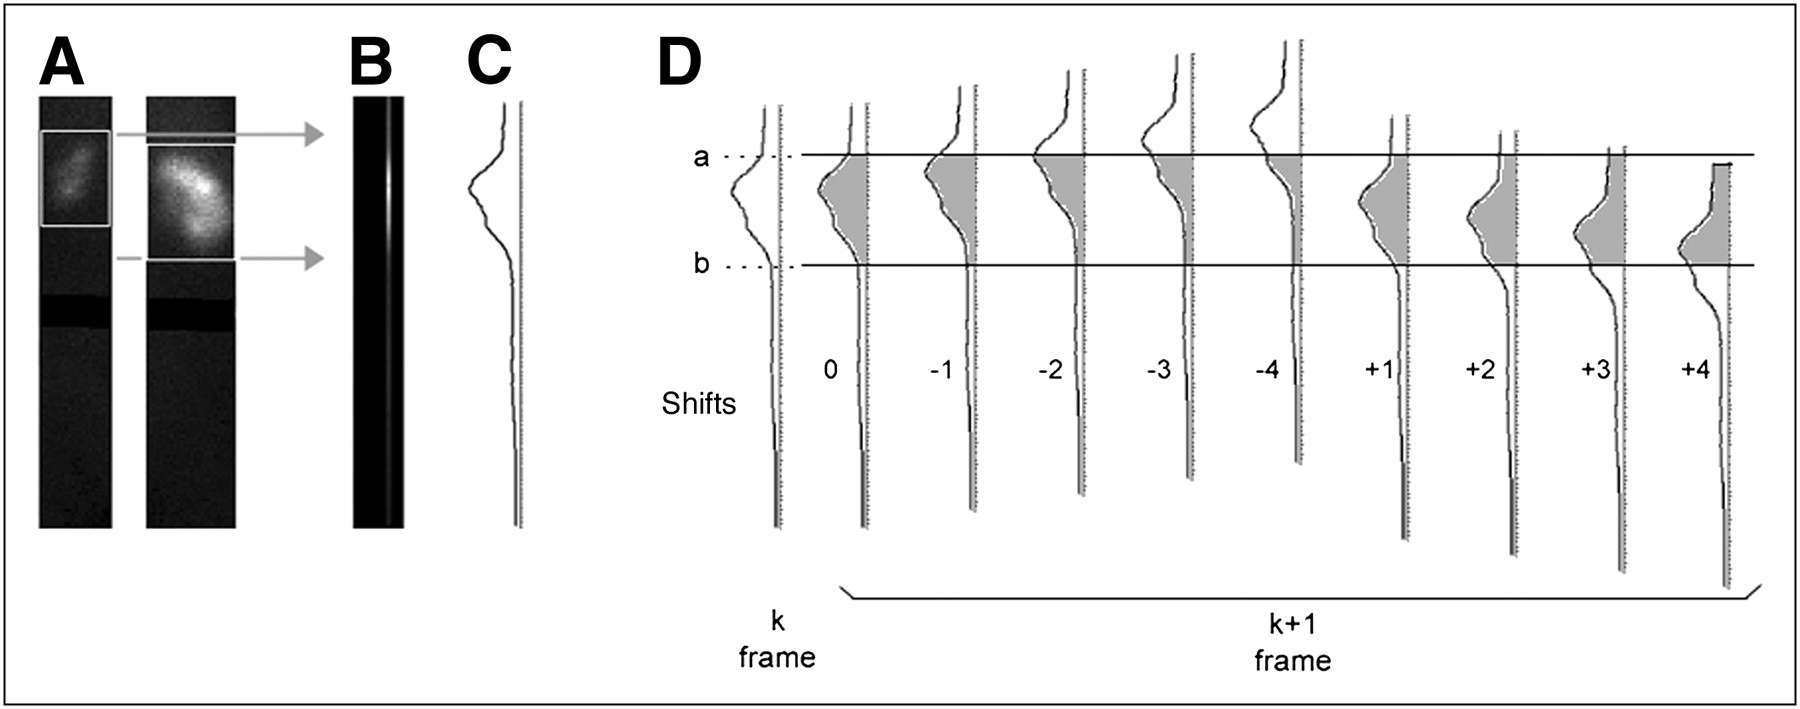
(A) Columns of pixels are summed across width of each whole-kidney box, 128 pixels from top to bottom of image matrix. (B and C) Area of 2 kidneys is bounded by top of uppermost box and bottom of lowermost box, as shown by gray arrows. Pixel columns are summed into single column (B), in which brightest area reflects counts from both kidneys. Summed column can be represented by count profile (shown vertically in C), and profile for each frame is then compared. (D) Frame-to-frame shift detection takes place, with frame k as initial reference frame. Height of kidneys, from a to b, defines area under curve representing total counts in kidneys in this frame. Using same a and b locations, frame k + 1 is shifted upward 0–4 pixels and downward 1–4 pixels, in 0.25-pixel increments. Count total is taken from a to b and compared with total from k. Shift amount (lag) corresponding to total that most closely matches k gives shift of k + 1. Because lag can be as small as 0.25, predicted location of frame k + 1 is determined to within 0.25 pixel. k + 1 then becomes reference for frame k + 2, and sequence is repeated.
The shift detection algorithm was applied to the original data, and the detected motion was tabulated. The shift detection algorithm operates on adjacent frames. Because small frame-to-frame shifts can accumulate to become large shifts, the cumulative shift from the beginning to end of the 40 frames was also tabulated.
Motion detection was executed on image data with y-direction simulated motion and on image data with both y-direction and x-direction motion. For each frame, the detected shift was tabulated as correct if it was within ±0.25 pixel of the true shift that was introduced. Tabulation was done both with and without correction of the motion detected in the original data.
The inclusion of x-direction motion was not an attempt to identify the magnitude of the x-direction shift but rather to determine the effect of simultaneous horizontal motion on the ability of the algorithm to quantitatively characterize vertical motion.
Motion Correction
Image frames in which motion was detected were shifted in an attempt to correct the motion. To evaluate the accuracy of motion correction, we used the summed pixel counts in both kidneys. For every image frame included in the motion simulation, there are 3 summed pixel values: for the original frame (O), for the shifted frame (S), and for the corrected frame (C). The shifted error fraction (SEF) was defined as the sum of |S − O|/O for all frames that were motion-shifted. The corrected error fraction (CEF) was defined as the sum of |C − O|/O for all shifted frames. The accuracy of motion correction was characterized by percentage restoration of the original counts, defined as (SEF − CEF)/SEF × 100.
For visual assessment of motion, display software was developed to allow frame-by-frame and linogram review of all images before and after motion correction.
RESULTS
Motion in the Original Data
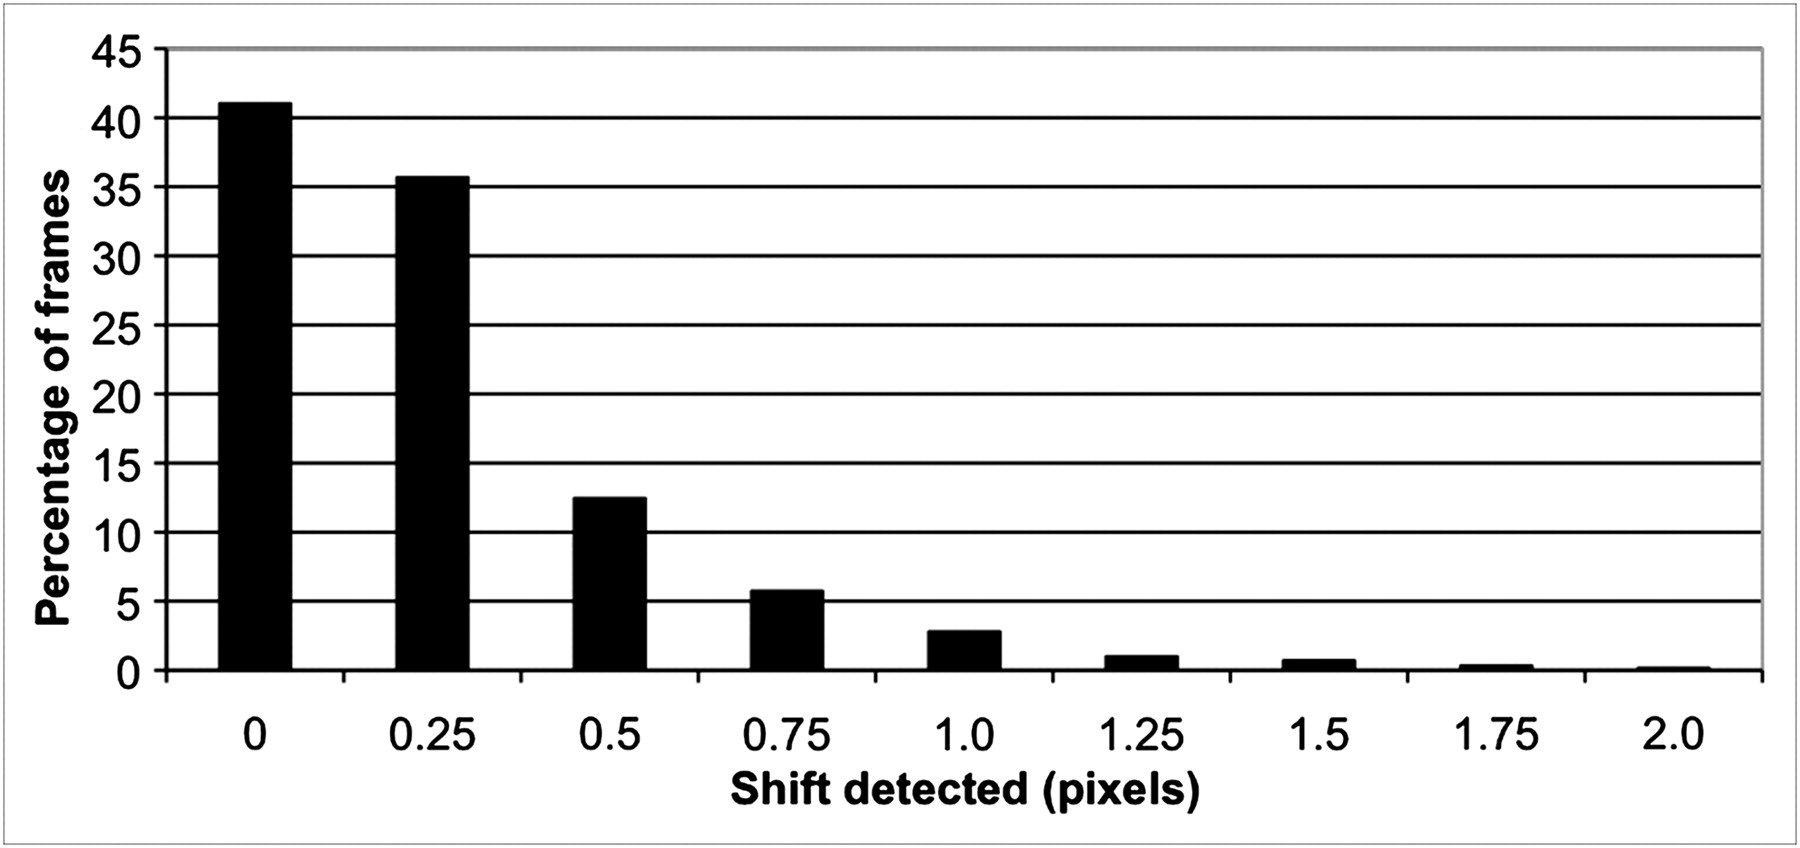
Motion detected in the original data is summarized in Figures 2 and 3. In 95% of the original image frames (3,263/3,440), the frame-to-frame shift detected was less than 1 pixel (3.2 mm). A cumulative shift of 2 pixels or less was detected in 65% of patients (56/86), an upward cumulative shift of more than 2 pixels was detected in 8% (7/86), and a downward cumulative shift of more than 2 pixels was detected in 27% (23/86).

Detection of shifts in original images.
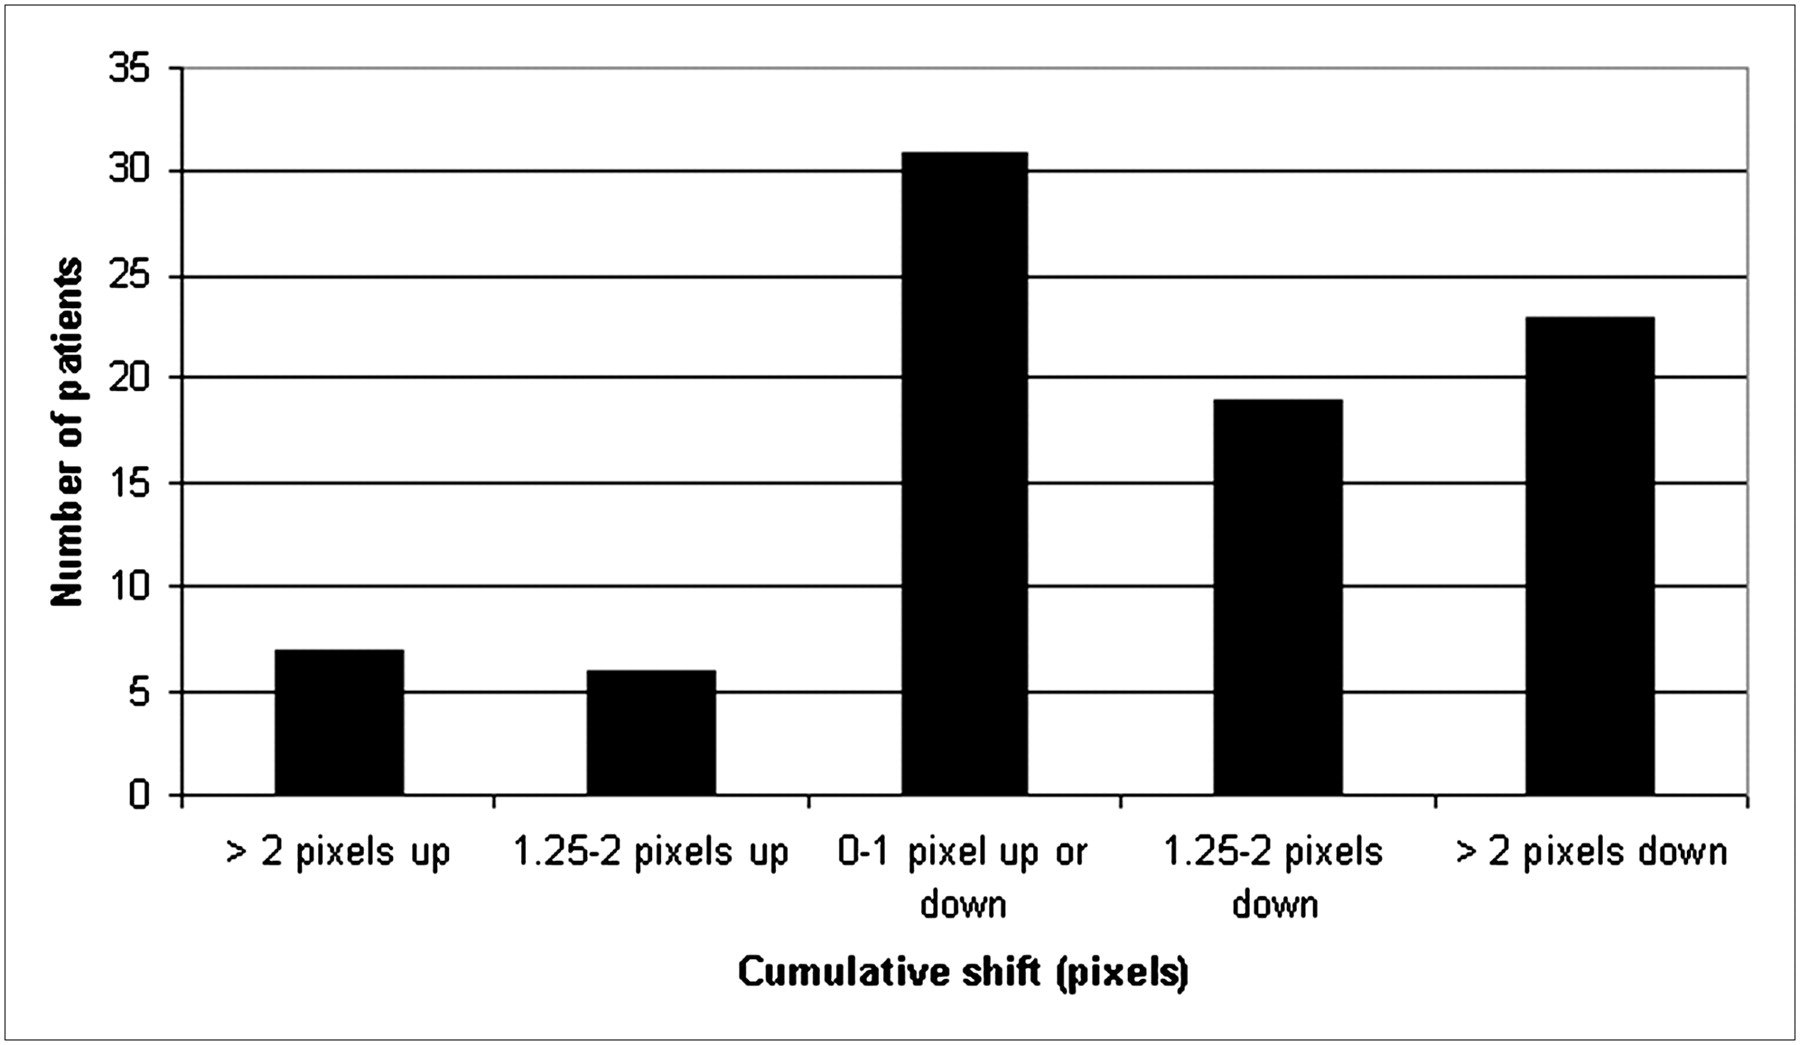
Detection of cumulative shift over any range of frames in original data.
Detection of Shifted Frames
Detection of any simulated shift was considered correct if the detected value was within ±0.25 pixel of the true value; however, for simulated 0.25-pixel shifts, we did not accept zero as a correct detection. Only 0.25- or 0.5-pixel detected shifts were considered correct in this case. Overall shift detection was 99% (3,068/3,096 frames) when motion in the original images was corrected.
All subsequent analysis was done without correcting for motion in the original data. With this condition, the overall detection of simulated shifts was 76% (2,345/3,096 frames). Motion detection was tabulated for all 10 types of simulated motion. Detection was 74%–80% for whole-pixel shifts of 1–4 pixels, 71%–78% for various fractional-pixel shifts, 72%–81% for various abrupt shifts, and 71%–78% for various gradual, continuous shifts, as plotted in Figure 4.
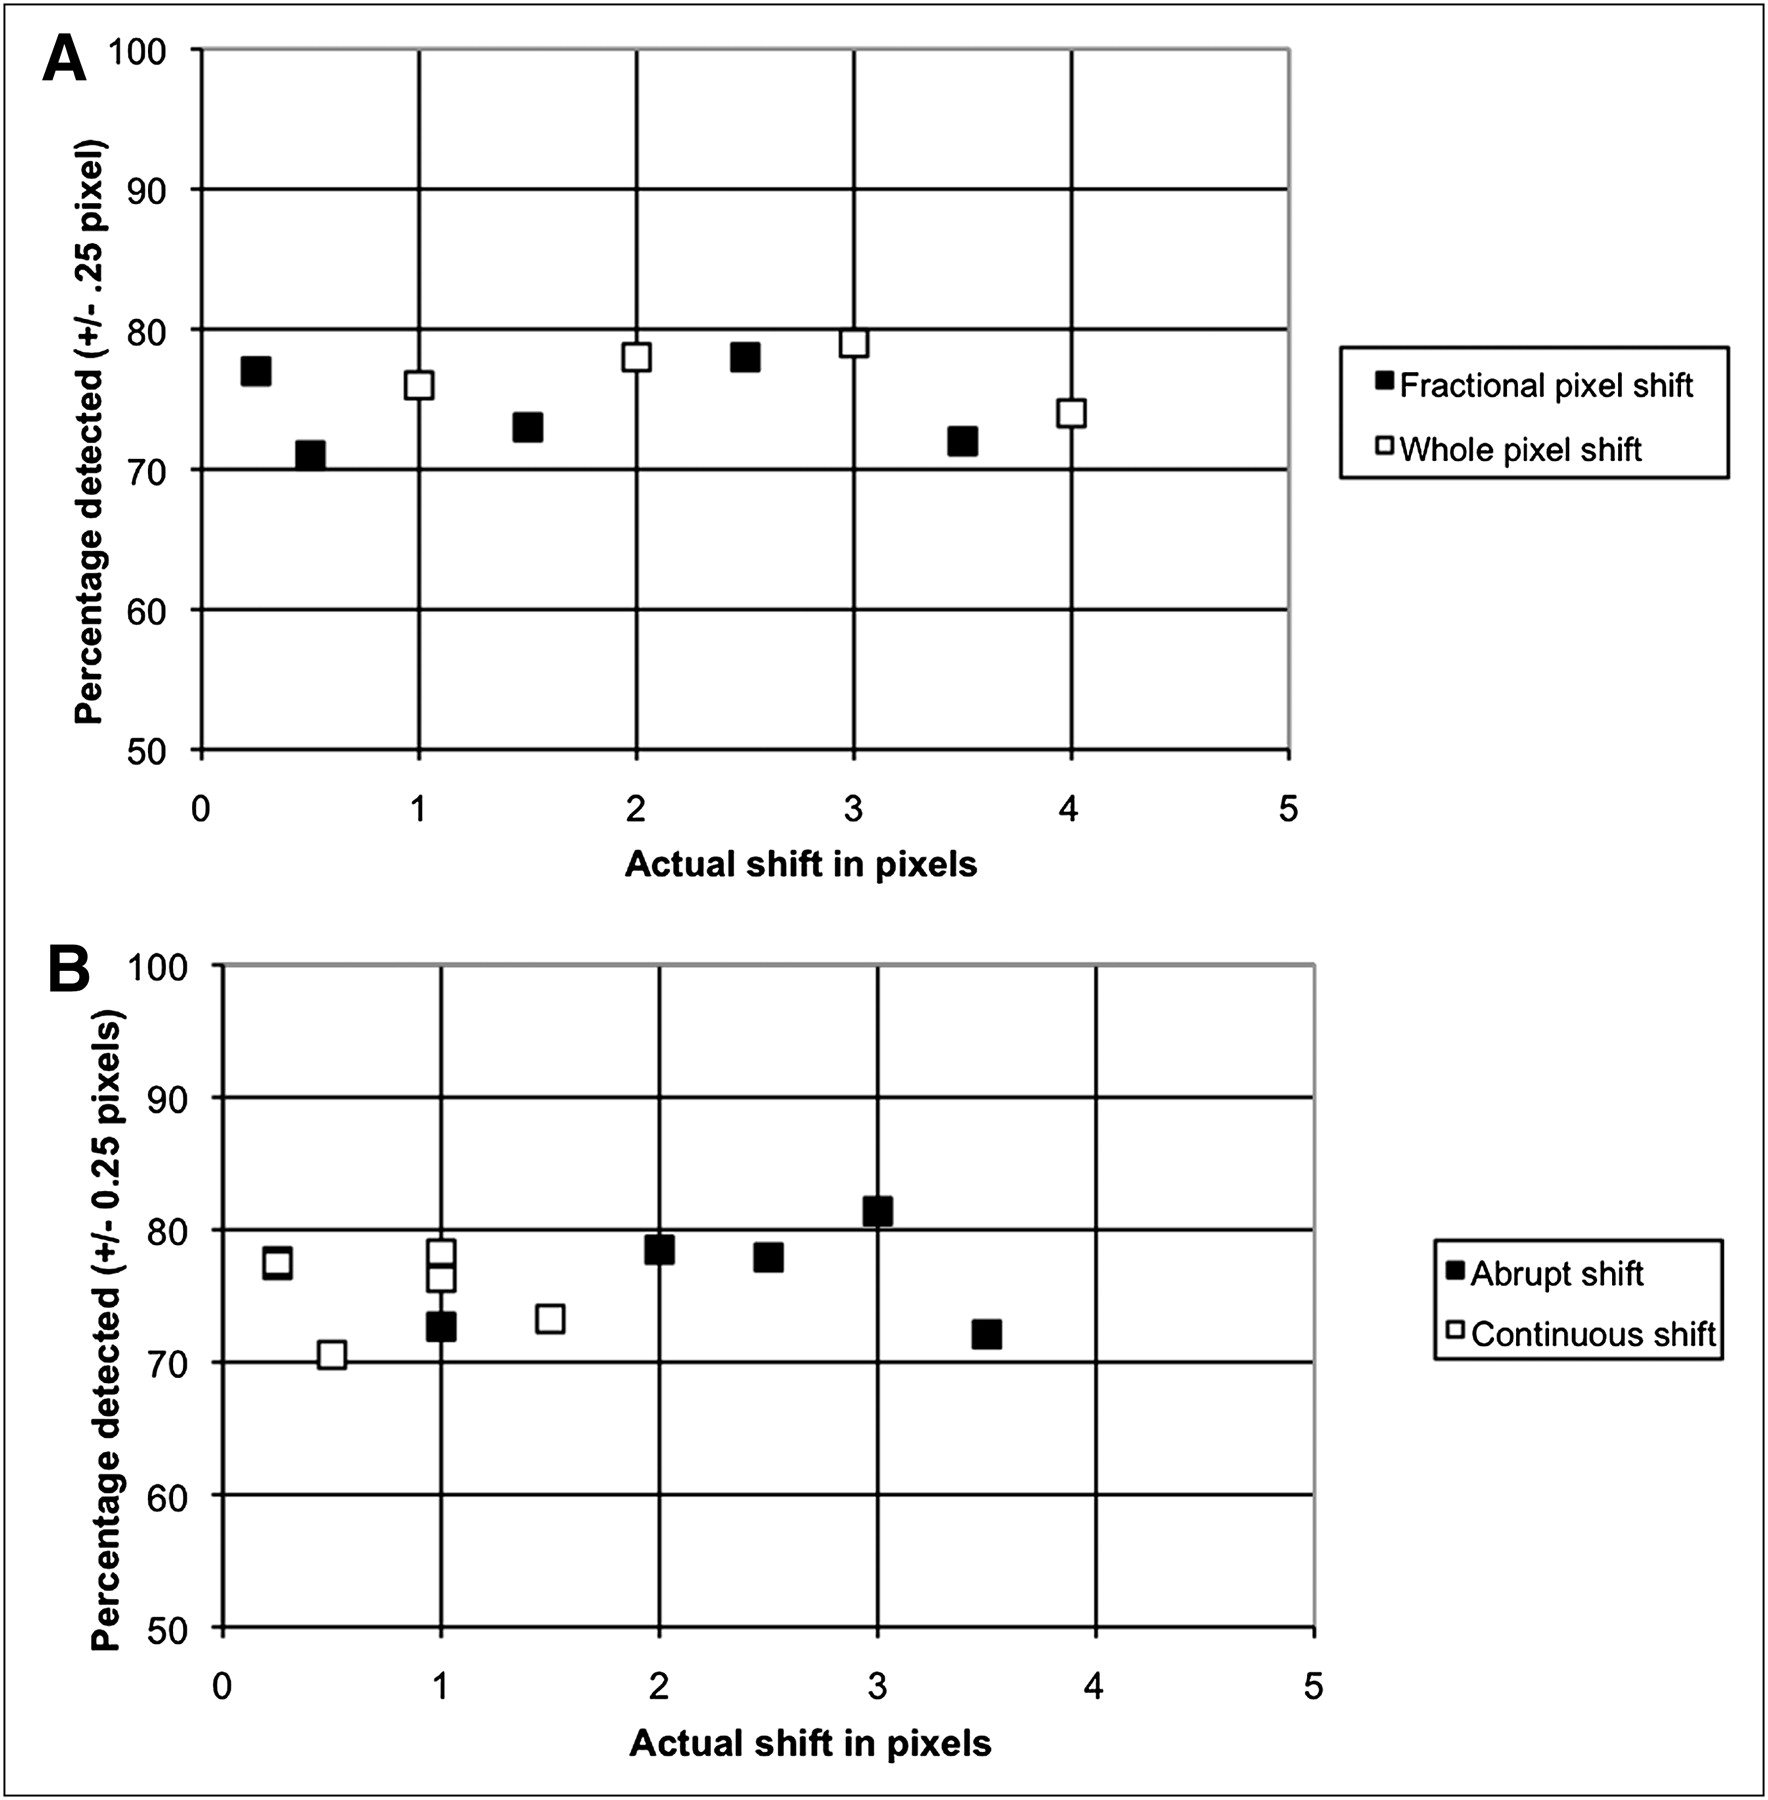
Detection of simulated shifts of various types and magnitudes. Shifts that are present in original data are not subtracted. (A) Plot of percentage motion detected for fractional- and whole-pixel shifts. (B) Plot of percentage motion detected for abrupt and continuous shifts.
Detection of Unshifted Frames
For image frames in which no shift was added, 87% (27,142/31,132) were correctly detected as having no shift. This value was calculated without correcting motion in the original data; therefore, the value is negatively skewed. Visual review of all image sets before and after correction suggests that kidney motion is present in some of the original studies, particularly in frames near the end of the study.
Detection of Shifted Frames in the Presence of Horizontal Motion
As shown in Table 2, detection of vertical motion was affected minimally by the presence of horizontal motion. Average detection for 6 different abrupt shifts was 77% for vertical motion and 73% for vertical plus horizontal motion. Detection for 6 different continuous (gradual) shifts averaged 76% for vertical motion only and 75% for vertical plus horizontal motion.
Detection of Simulated Motion
Motion Correction
Motion correction was applied to all frames for which there was a simulated shift. For the 5 shift types that included only whole-pixel shifts, calculated recovery of original counts in each shifted frame, (SEF – CEF)/SEF × 100, was 100%. For fractional-pixel shifts, recovery of original counts varied from 52% to 73%. Table 3 summarizes these results for all types of simulated motion that were applied.
Percentage Count Recovery After Motion Correction
Visual Review Tool
A sample display from the motion review tool is shown in Figure 5. Images can be reviewed frame by frame before and after correction. Using a slider control, the images can be viewed in rapid succession, similar to a cine loop. The software also constructs linograms to represent the original and corrected data. The linogram is a static image consisting of 40 pixel columns. Each linogram column contains the sum of all pixel columns through both kidneys in the corresponding image frame. The linogram display summarizes the entire dynamic image set in a single static image, while highlighting the kidneys, which are the most important image feature. All studies were reviewed using the visual tool. Simulated motion could easily be seen in the uncorrected linograms and was not evident, or was much less evident, in the corrected linograms, as suggested by smoother superior and inferior boundaries of the kidneys.
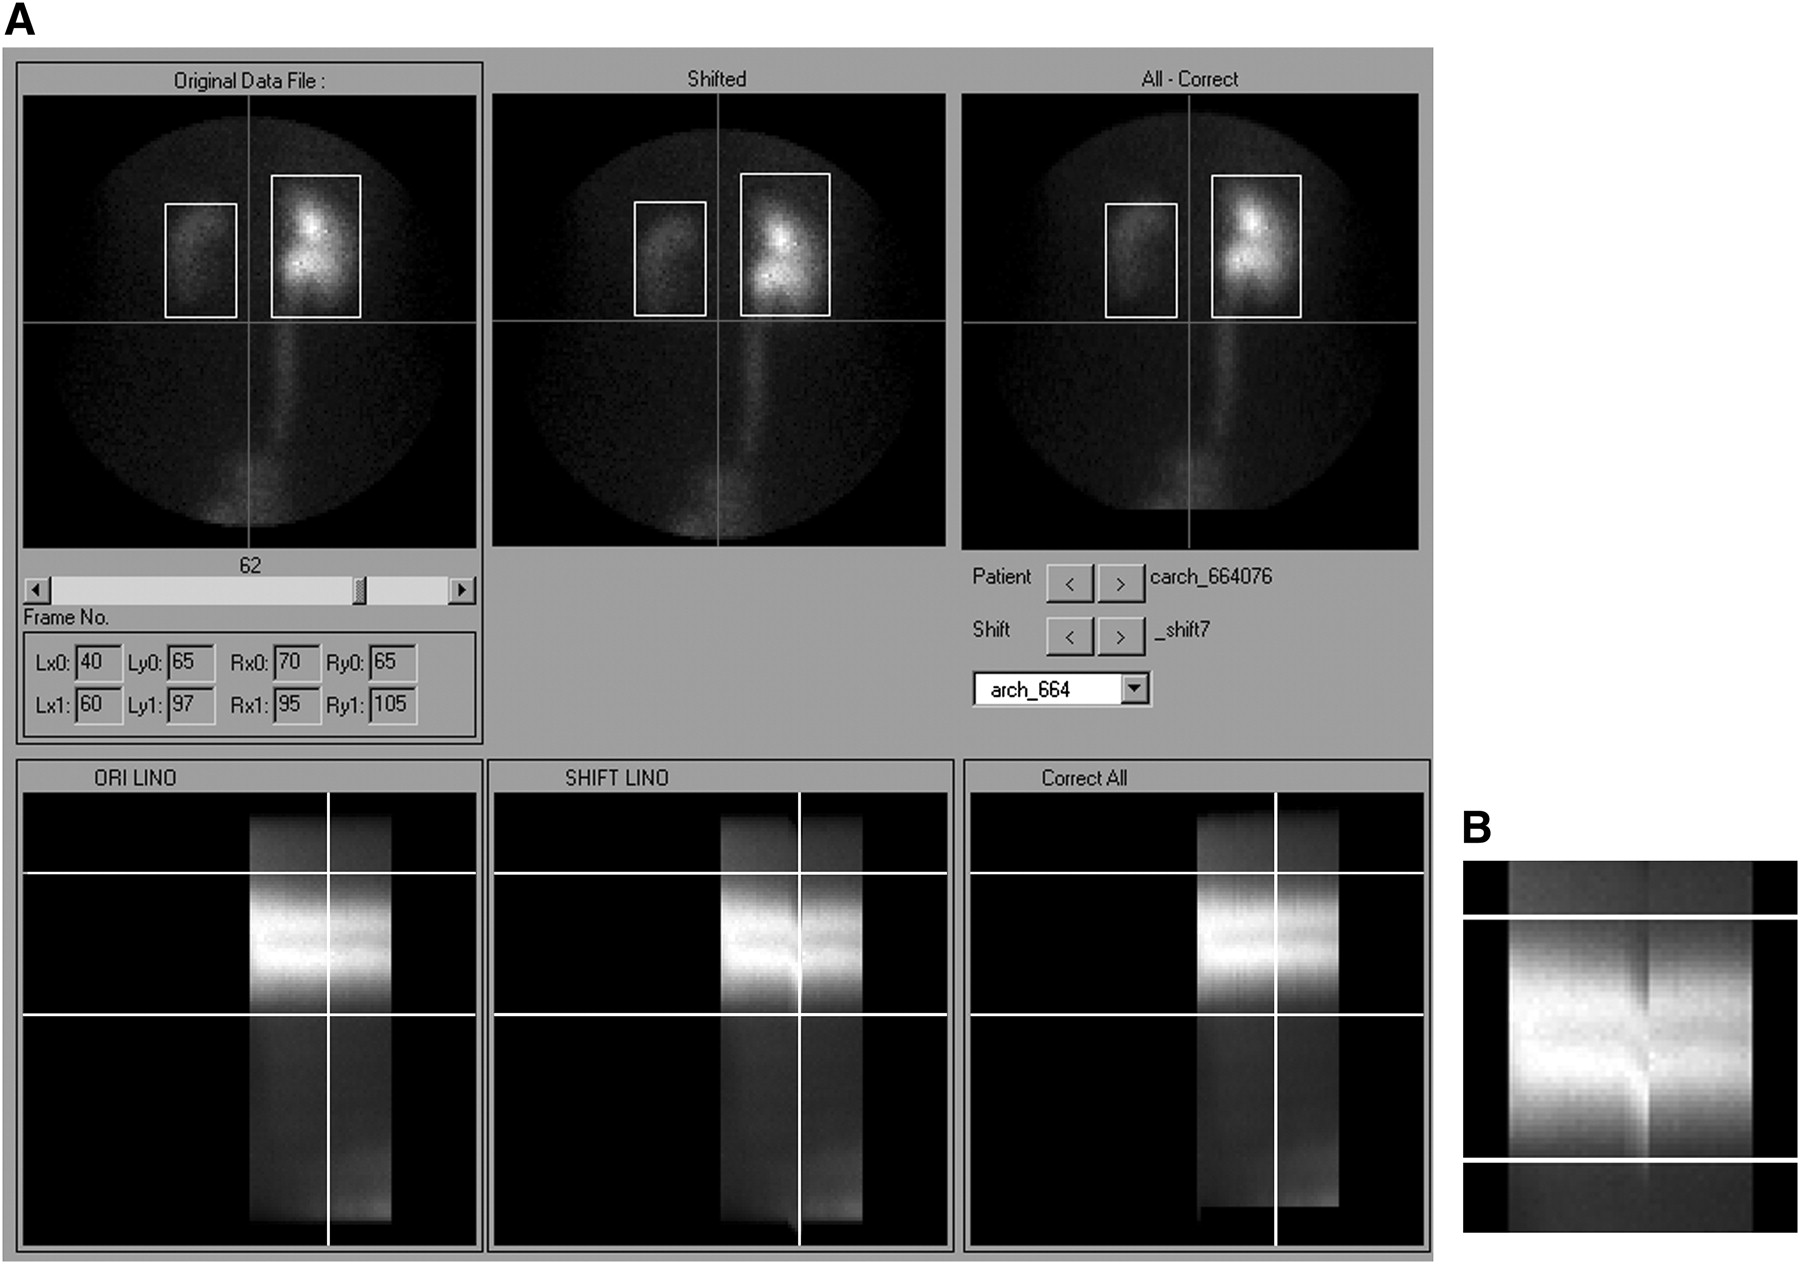
Example patient study shown in visual motion review tool. (A) Below each kidney image is corresponding linogram for original images (left column), images with simulated shift (center column), and motion-corrected images (right column). Slider control allows review of any image frame, and current frame position is indicated by vertical line on all linograms. (B) Enlarged view of linogram with image shifts, without vertical line marker. This tool allows user to select any of 86 patients, and any of 10 artificial shifts, for visual comparison of uncorrected and corrected images and linograms.
DISCUSSION
We present a method for automatically detecting patient motion. The method uses frame-to-frame correlation of counts in and adjacent to the whole-kidney ROIs. Because kidney ROIs are defined on summed images from the 2- to 3-min interval after injection—images that are somewhat blurred by respiratory motion—there is a certain amount of motion tolerance in the regions (19). Motion of the body that occurs later than 3 min will shift the kidney away from the assigned ROI, which remains fixed for the duration of the acquisition, and will reduce the counts within the kidney regions. A common motion compensation technique is to increase the size of the ROIs to avoid excluding kidney counts due to motion; however, this may result in inappropriate background subtraction. In this study, all ROIs were defined on the basis of the apparent size of the kidneys in the 2- to 3-min image and were not enlarged.
In our study, we used a cross-correlation algorithm for motion detection, with the following enhancements. First, we used the kidney ROI locations to identify the most important regions of the profile. The technique of segmenting essential image features by defining ROIs, as a starting point to drive motion detection and correction, has been used previously in MR renography (35–37). Second, we did not allow the cross-correlation to pad the profile with zeroes as the lags were introduced. The default behavior of the cross-correlation is to assume that, as the profile is shifted by each lag, zero values are added to the end of the profile to maintain the same number of data points. In our implementation, real pixel counts are pulled in from above and below the ROI location as the profile is shifted. Third, we used a moving reference frame; that is, the current profile was adjusted to best match the previous one, and then the current profile became the reference for the next frame.
These changes to the basic algorithm might be expected to improve performance in motion detection, although the current study is not able to prove this theory because we did not compare the results with those of another detection method.
To test the method, we used images from clinical patients with a range of 99mTc-MAG3 clearances and a range of differential kidney function parameters. To simulate motion, we introduced image shifts of whole- or fractional-pixel amounts through various ranges of the 30-s frames. Because the threshold at which motion begins to significantly affect the confidence of scan interpretation is unknown, we used shifts of as small as 0.25 pixel (0.8 mm) and as large as 4 pixels (12.8 mm). The shift magnitudes, locations, and durations simulate a variety of motions.
Motion that was present in the original images might bias the detection results. Preexisting motion was probably not significant, because none of our studies had motion concerns noted on the clinical report. Most of the frame-to-frame motion detected in the original data was small, with 95% of the detected motion consisting of shifts of 1 pixel or less between adjacent frames.
Similarly, cumulative motion in the original data was usually less than 2 pixels. When it was greater than 2 pixels, a downward shift was 3 times more frequent than an upward shift. We hypothesized that this was due in part to clinically insignificant patient motion and in part to the normal, downward, excretion pattern of 99mTc-MAG3, which could conceivably confuse the detection algorithm. An example is shown in Figure 6. Visual inspection of the linograms and sequential image frames suggested that both patient motion and excretory shift of tracer were present in the original studies.
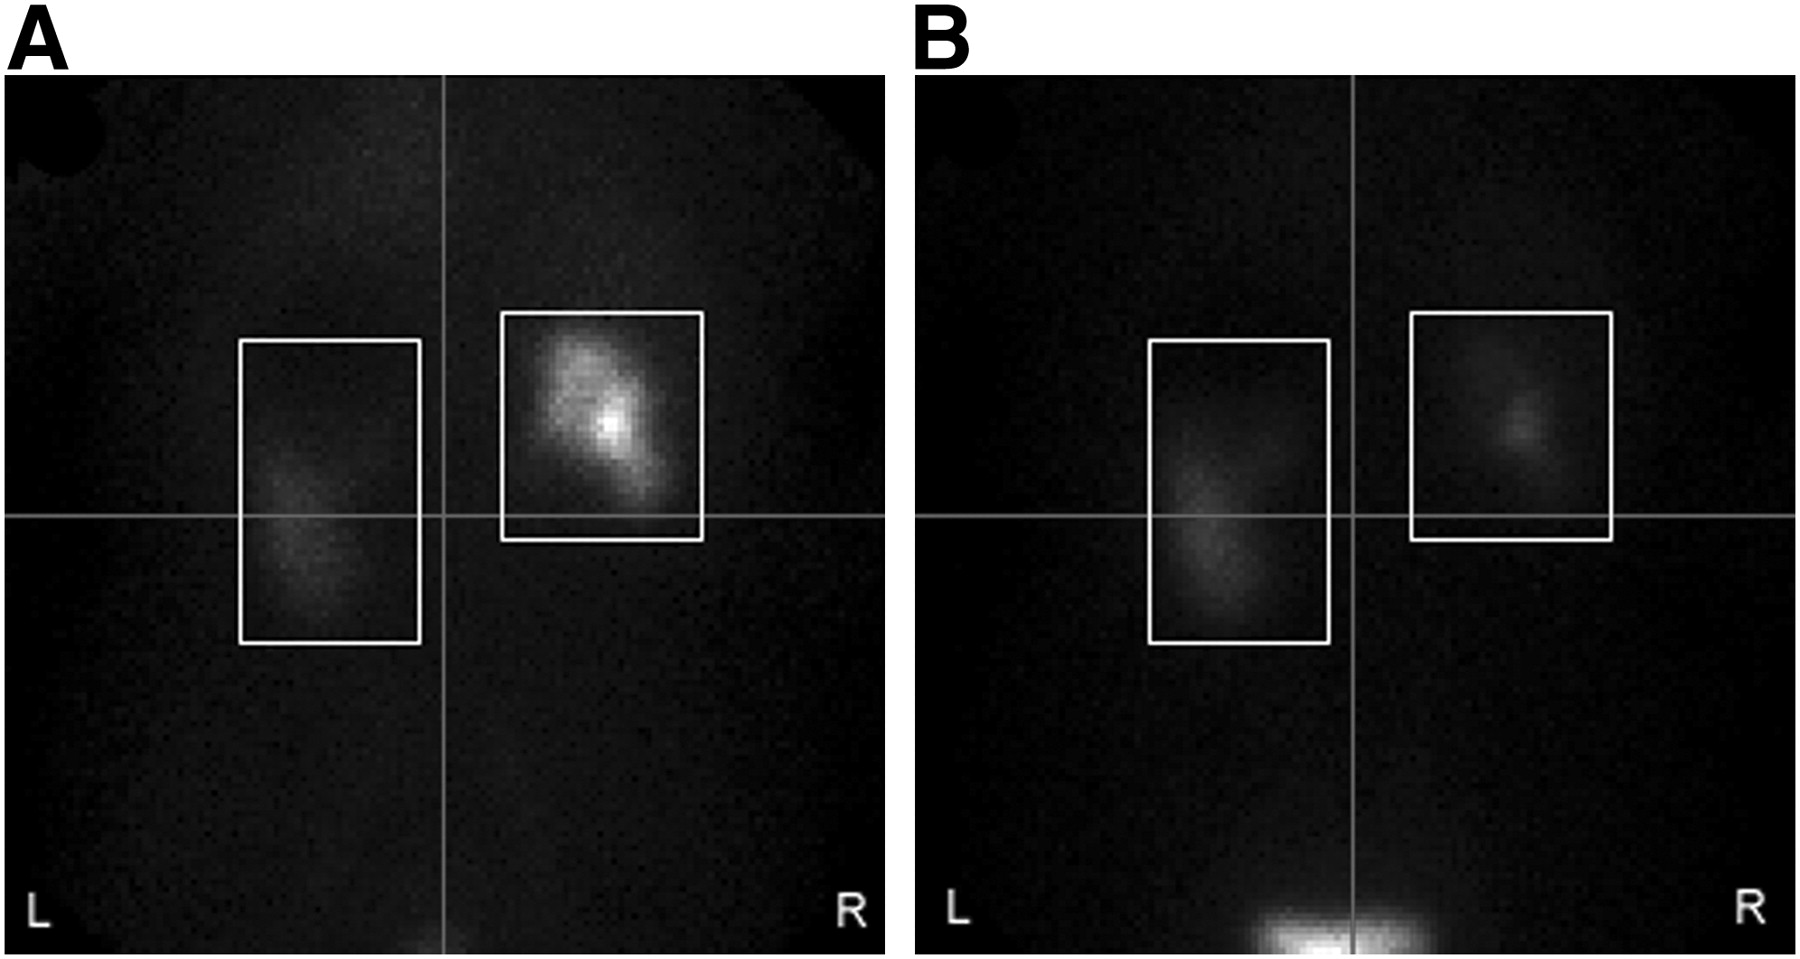
Image frames 4 min (A) and 24 min (B) after injection of 99mTc-MAG3. (A) First frame of range that underwent motion detection. This patient shows little uptake of 99mTc-MAG3 in left kidney at 4 min. In profile generated by summing pixel columns in both kidneys, most counts are contributed by right kidney, causing higher profile peak. (B) At 24 min, right kidney has excreted 99mTc-MAG3 into bladder, and more counts in profile are contributed by left kidney, which retains 99mTc-MAG3. Because profile peak is thus lower than in A, vertical motion may be falsely implied.
We first corrected shifts detected in the original version of each image set before applying the motion-detection algorithm. Shift detection was excellent under these conditions. This is a purposeful simulation, but it does not match the real-world condition, in which the original shifts would not be known. Therefore, we also tabulated motion detection rate without correcting the original data, and this tabulation accounts for a reduction in shift detection rate from 99% under ideal conditions to the range of 71%–81%.
For most simulated shifts, a tolerance of ±0.25 pixel was allowed. For shifts of exactly 0.25 pixel, zero was not counted as a correct detection event. With this restriction, 79% of the smallest, 0.25-pixel, shifts were correctly detected. Detection of vertical motion was always in the range of 70%–80%, even in the presence of significant (4-pixel) horizontal motion.
It is important that a motion detection algorithm not detect motion where none is present. In this study, there were 34,400 image frames (86 patients × 40 frames × 10 shift types, excluding the original data). Of this total, 31,132 image frames did not receive a simulated shift, and 87% of these were correctly identified as having no shift. This tabulation was done on data without correction of the original motion that was present. Some of the remaining 13% of frames probably had true patient motion (not clinically significant), and some frames exhibited significant movement of the radiotracer between frames, related to excretion, as suggested by visual review.
Motion correction was applied to all frames that had a simulated shift. In the case of whole-pixel simulated shifts, there was complete recovery of the original pixel counts. By comparison, count recovery of fractional-pixel shifts (Table 2) was less but still occurred in most cases.
Pixel counts are interpolated when the fractional simulated shift is applied, and they are interpolated again during correction. Each interpolation creates a small error or uncertainty in many pixels, and this error largely accounts for the reduced correction of the fractional-pixel shifts. Variability in the accuracy of shift correction between one shift type and another appears to be determined in part by how many pixels have a fractional shift and whether the shift back to the starting position is a whole-pixel or a fractional-pixel amount. Although percentage count recovery is an objective metric that allows comparison of motion correction performance with different types of simulated motion, it is not possible to achieve 100% accuracy in count recovery in the case of fractional-pixel shifts using the current algorithm. Thus, percentage recovery probably underestimates the performance of the algorithm in improving images affected by motion.
In clinical studies, it is likely that spontaneous patient motion would involve fractional-pixel amounts. Furthermore, pixel interpolation is not unlike the blurring that would occur if the patient moves at some arbitrary time during the 30-s frame. The estimates of detection and correction suggested by our results predict an acceptable real-world performance for the methodology.
To visually evaluate the performance of our method, we developed software to display the image frames as well as linograms representing the entire uncorrected and corrected studies, each in a single image. This is a user-friendly approach, because the linogram columns are essentially count profiles of each image frame, similar to the count profiles on which the cross-correlation operates. The linograms provided a simple and straightforward visual method to detect renal motion and evaluate the correction algorithm. However, care must be taken to judge the corrected linogram by the activity along the edges of the kidneys rather than by the smoothness of the whole linogram image. Pixel interpolation is similar to a mild image filter, which might make the corrected linogram image appear slightly smoother regardless of whether motion is appropriately corrected.
Study Limitations
We examined only the 30-s frames for motion. Motion that occurs before the 30-s frame acquisition (5 min in the protocol used) would not be detected. For each study, there was a single instance of simulated motion, over a small number of frames, always with an eventual return to the start position.
Our method may not be applicable to all cases of motion in pediatric studies. Children sometimes exhibit movement different from that seen in adult patients (12,38). None of our subjects was less than 18 y old. Only patients referred for evaluation of possible renal obstruction or for evaluation of renal function before donating a kidney for transplantation were included in the study.
We assume that the area most useful for motion detection includes both kidney ROIs. If there is significant unilateral or bilateral decreased kidney function, there will be reduced radiopharmaceutical uptake in the kidneys, with a higher level of background uptake. A few such cases were included in the study group, and motion detection was not systematically degraded in these kidneys.
Visual review of the images was not conducted by independent observers. This step should be included in any clinical test of the motion correction methodology.
Finally, it remains to be demonstrated, first, that the motion simulated and detected in our test is of the type and magnitude that adversely affects the calculation of renogram parameters and subsequent interpretation of the renogram, and second, that the motion correction algorithm can correct the errors in the parameter values and restore the original renogram interpretation. This issue might be best addressed by our expert system software (27), but further investigation is required.
Future Directions
The cross-correlation algorithm depends on adequate signal-to-noise ratio, particularly if object shapes change between frames, as is expected in renography. If renal function is reduced, the method may benefit from background subtraction (30), examination of left and right kidneys separately, or inclusion of counts from an area broader than the boxes around the kidney ROIs.
With further validation, the motion detection program can be incorporated into our overall quality control module to correct functional parameter values so that the data transmitted to our decision support system will lead to more accurate interpretations of scans.
CONCLUSION
The motion detection algorithm accurately identified artificially simulated motion of as little as 0.25 pixel (0.8 mm). The detection rate was maintained whether the shifts were upward or downward and whether they were gradual or abrupt, and the rate was also maintained when both vertical and horizontal motion was applied to the same frames. Whole-pixel vertical motion can be precisely corrected, but fractional-pixel motion can be only partially corrected because of the imprecision introduced by pixel interpolation. Importantly, the motion detection algorithm accurately identified frames that were not shifted—a feature that should minimize the introduction of artifacts caused by attempting to correct frames that do not need correction.
Acknowledgments
This work was supported by grant R01-EB008838 from the National Institute of Biomedical Imaging and Bioengineering (NIBIB) and the National Institute of Diabetes and Digestive and Kidney Diseases (NIDDK). Mr. Folks and Drs. Garcia and Taylor receive royalties from the sale of QuantEM software, which is related to the software used in this project. This arrangement has been reviewed and approved by Emory University in accordance with its conflict-of-interest policy.
REFERENCES
- Received for publication August 2, 2010.
- Accepted for publication November 3, 2010.


Jump to section
Related Articles
Cited By...
- No citing articles found.