


Article Figures & Data
Figures
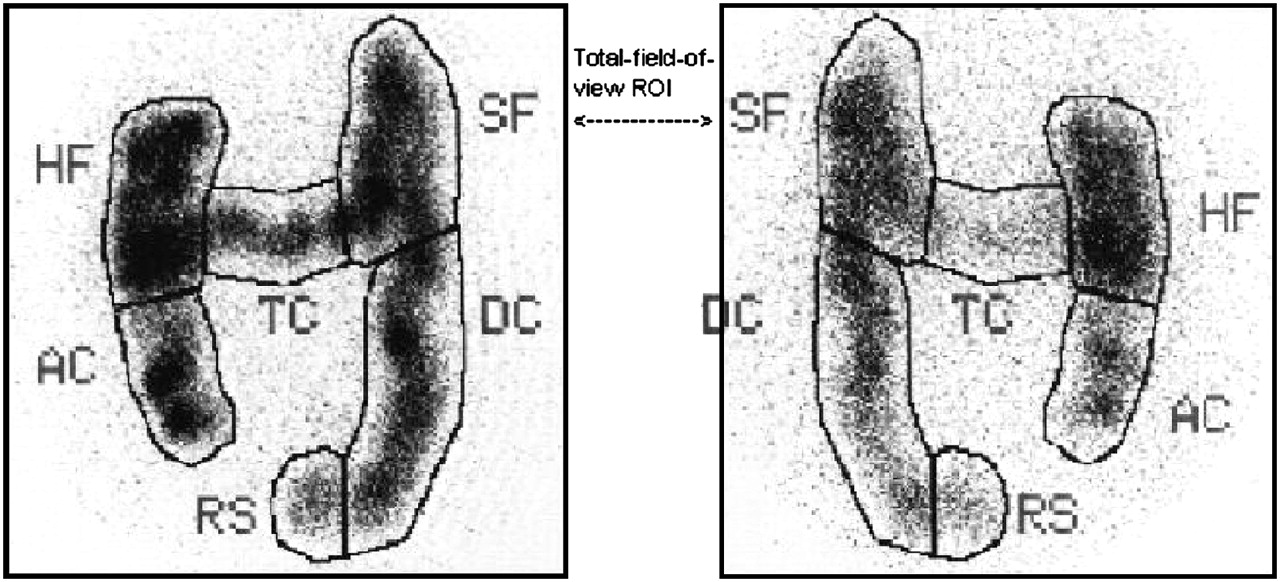
- FIGURE 1.
Segmental ROIs of colon: anterior and posterior ROIs include ascending colon (AC), hepatic flexure (HF), transverse colon (TC), splenic flexure (SF), descending colon (DC), rectosigmoid (RS), and total activity in abdomen. When it is difficult to separate flexures from surrounding segments of colon, they are included in ROIs drawn around flexures.
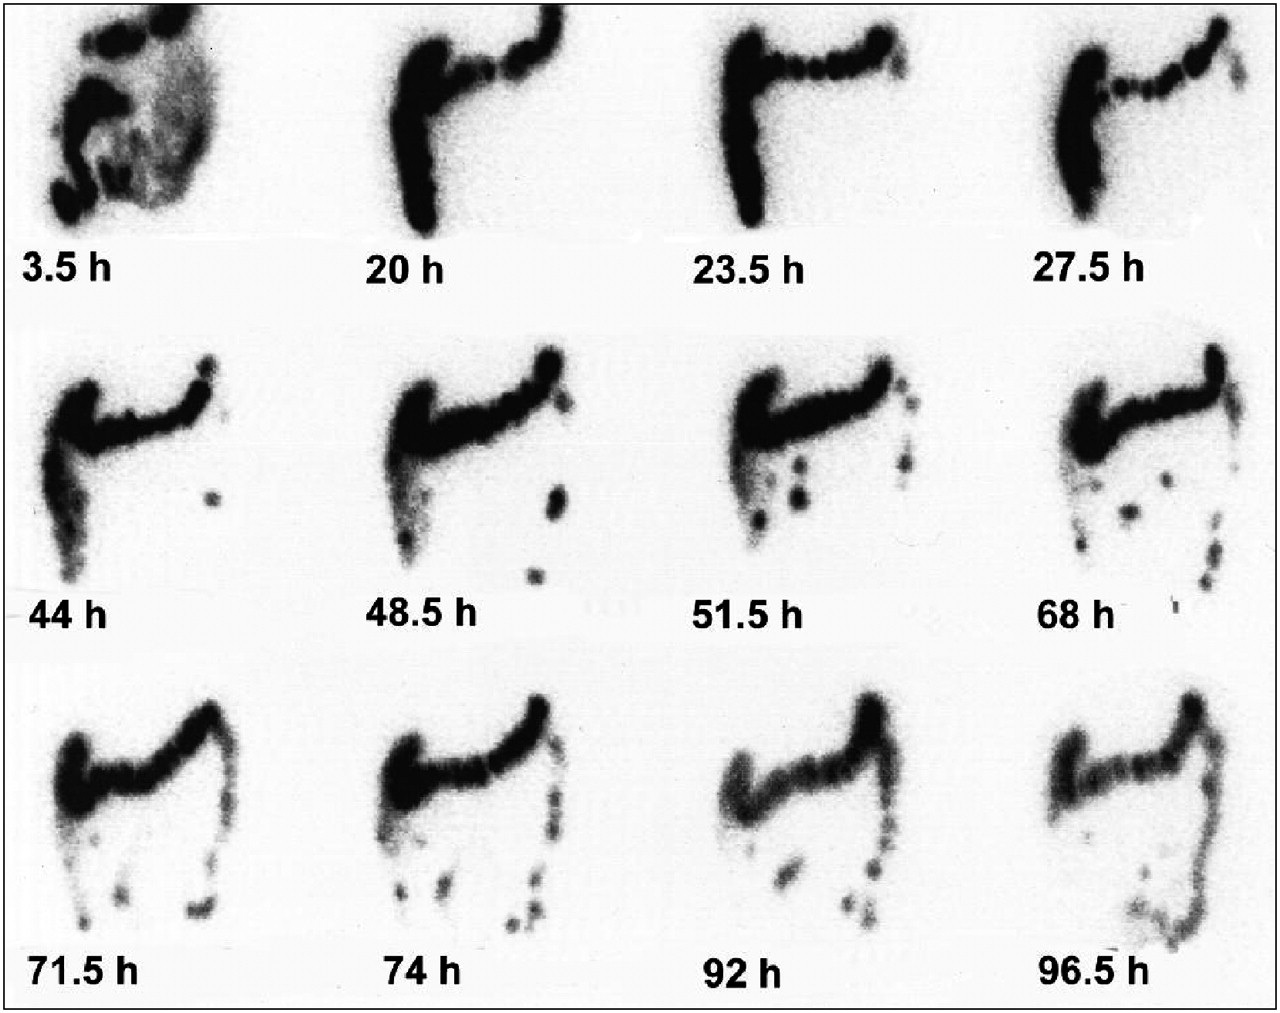
- FIGURE 2.
Anterior analog images. Right-sided delay is shown over a period of 96.5 h. Activity reaches splenic flexure within 20 h. At 68 h, bulk of activity lies within transverse colon and, although the activity moves slowly into descending colon and rectosigmoid by 96.5 h, the bulk of activity is still within transverse colon.
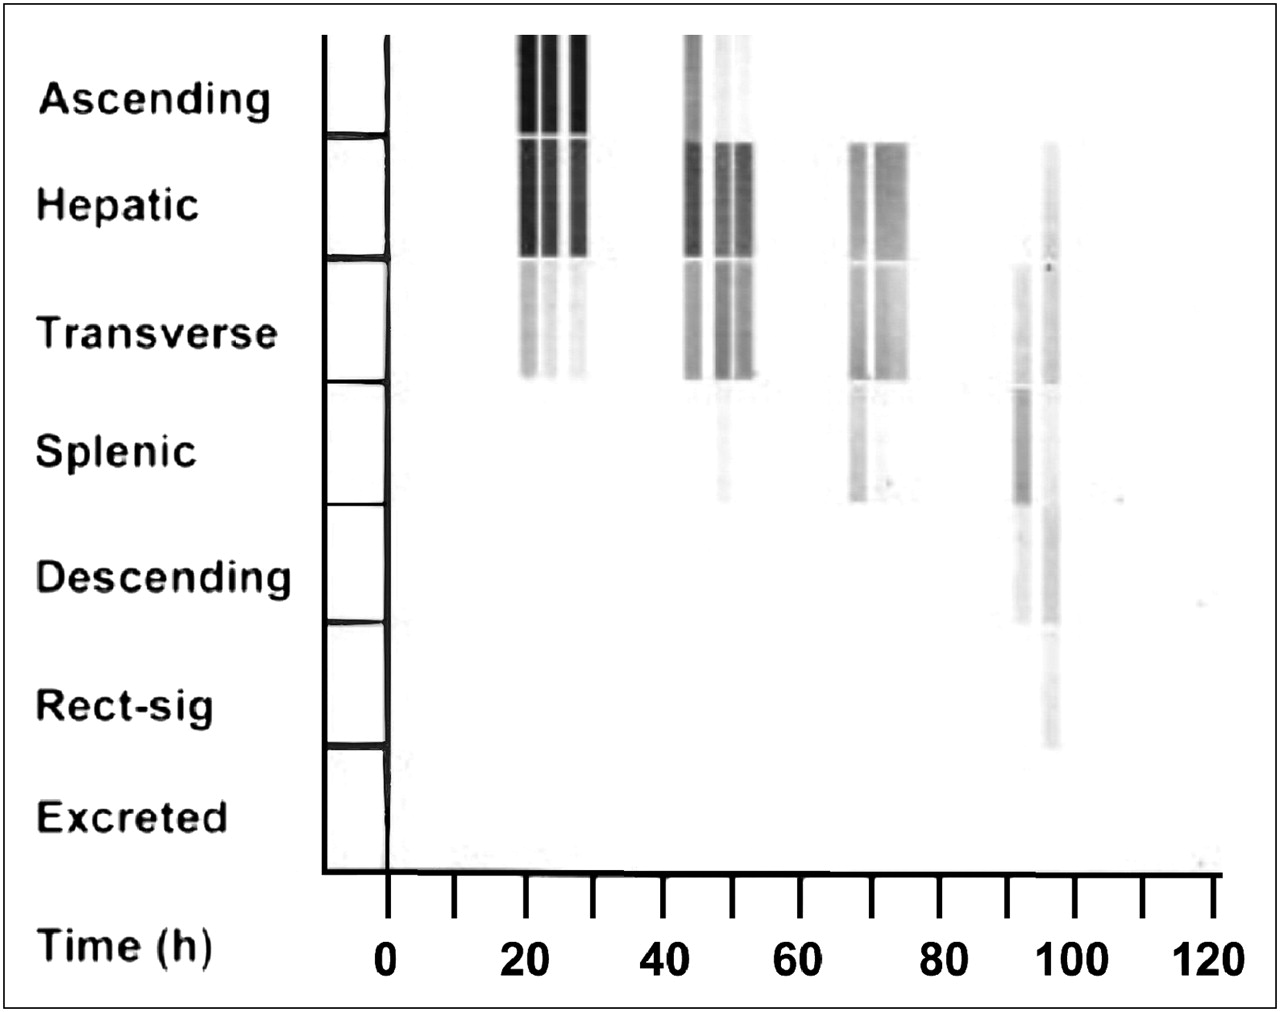
- FIGURE 3.
Parametric images of right-sided colonic delay. A gray scale is used to visually express the percentage activity in each segment of colon over time (y-axis), which is plotted against time (x-axis). Slow movement of activity through ascending colon, hepatic flexure, and transverse colon can be clearly followed over 96.5-h period.
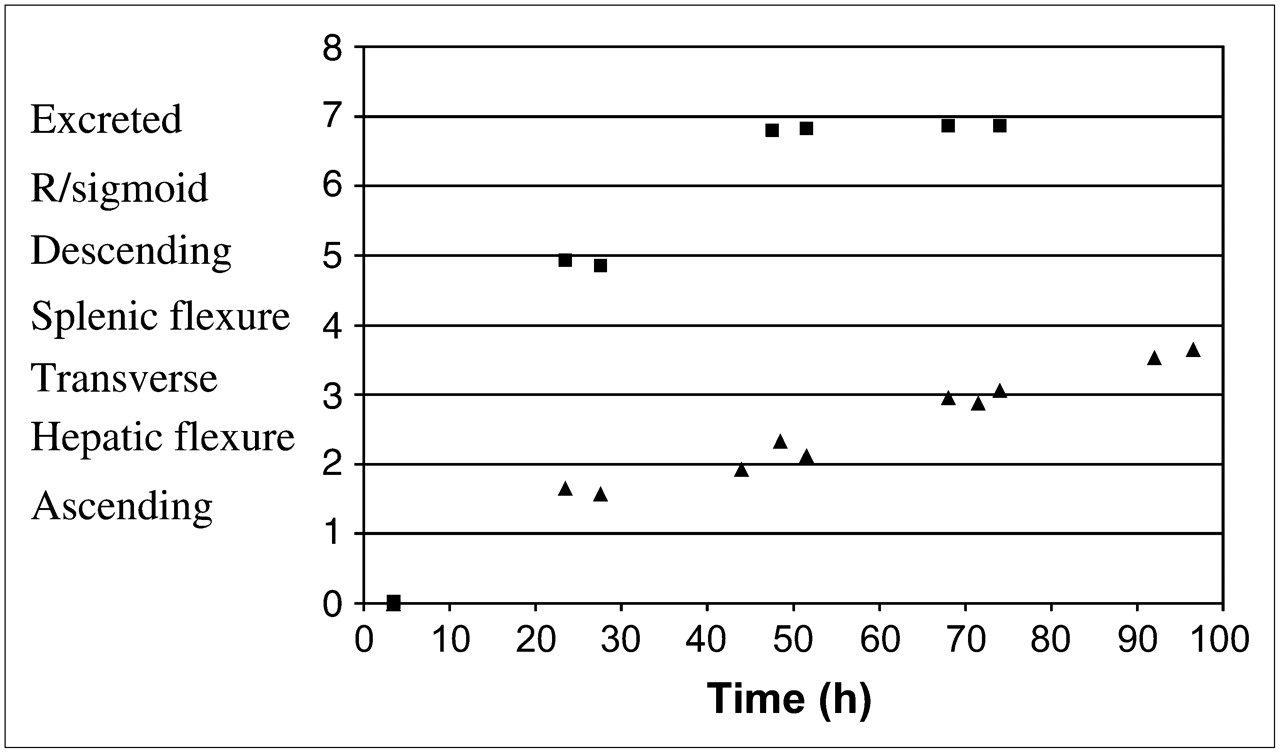
- FIGURE 4.
GCs of normal transit (▪) and right-sided delay (▴) in colonic transit over 96.5-h period. Segments of colon are indicated on y-axis: ascending colon (1), hepatic flexure (2), transverse colon (3), splenic flexure (4), descending colon (5), rectosigmoid (R/sigmoid) (6), excretion (7). Time (h) is plotted on x-axis.
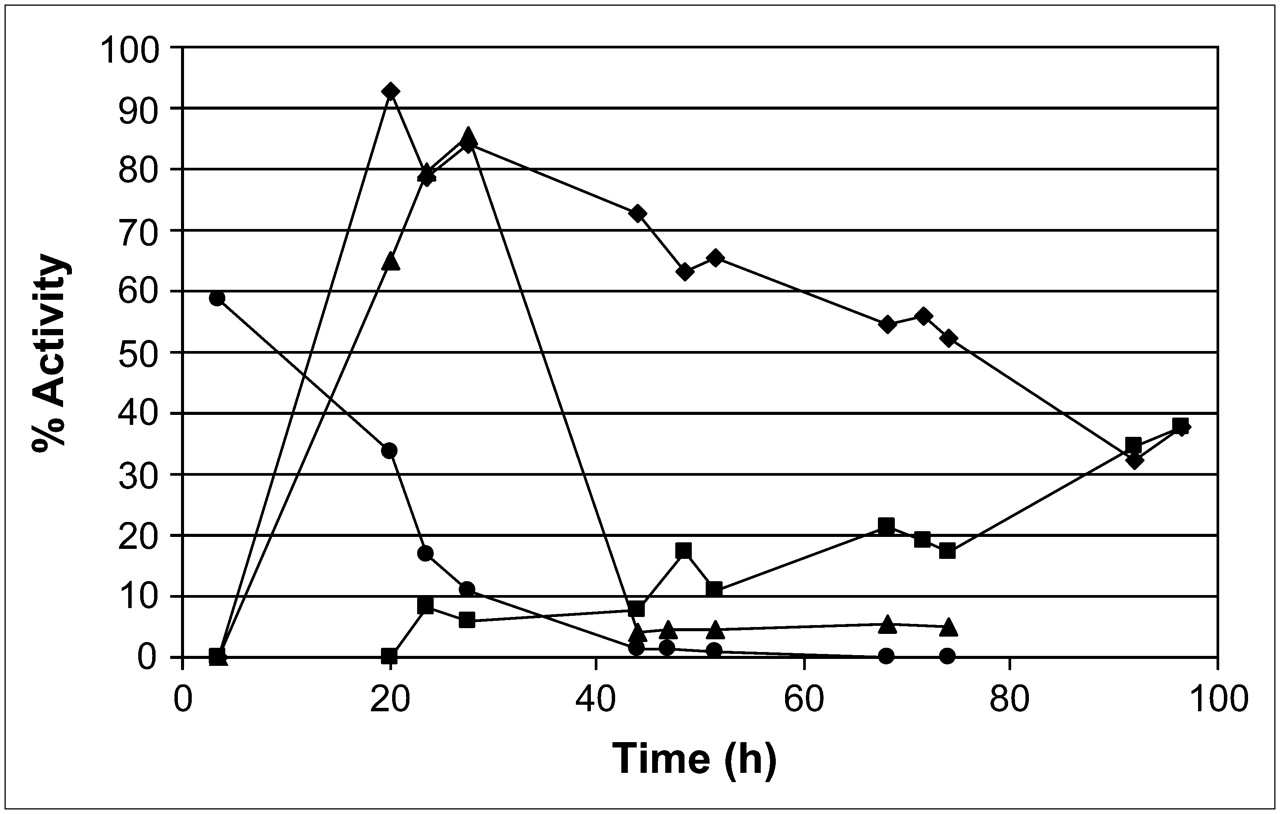
- FIGURE 5.
Time–activity curves. Intermediate or normal transit is clearly evident. As right side of colon (•) empties, left side (▴) fills and then empties by 44 h. Right-sided colonic delay is demonstrated. Pancake moves slowly through right colon (♦), whereas left colon (▪) only contains 39% of meal at 96.5 h.


Tables
Rapid transit Activity is distributed throughout colon within 12 h and most activity is excreted within 24 h. Intermediate transit Most activity has accumulated in cecum within 12 h. Activity is excreted within 27–48 h. Generalized delay No activity is excreted within 3 d, and activity is distributed throughout colon with no particular region of storage. Right-sided delay No activity is excreted within 3 d, and most activity remains in ascending and transverse colon for this time. Left-sided delay Activity reaches descending colon and rectum by 27–34 h, but activity remains in rectosigmoid colon for 3 d with no fecal excretion. Patterns of colonic transit are from (9).
Subject Physician 1 Physician 2 Physician 3 Consensus 1 Gen delay Gen delay L-sided delay Gen delay 2 R-sided delay Gen delay R-sided delay R-sided delay 3 R-sided delay Gen delay R-sided delay R-sided delay 4 R-sided delay R-sided delay R-sided delay R-sided delay 5 R-sided delay L-sided delay R-sided delay R-sided delay 6 R-sided delay R-sided delay R-sided delay R-sided delay 7 R-sided delay Gen delay R-sided delay R-sided delay 8 Intermediate Gen delay Intermediate Intermediate 9 Gen delay Gen delay L-sided delay Gen delay 10 L-sided delay Gen delay L-sided delay L-sided delay 11 Intermediate Intermediate Intermediate Intermediate 12 Intermediate Intermediate Intermediate Intermediate 13 L-sided delay Gen delay L-sided delay L-sided delay 14 Gen delay L-sided delay L-sided delay L-sided delay 15 Gen delay Gen delay L-sided delay Gen delay 16 Gen delay L-sided delay L-sided delay L-sided delay Gen delay = generalized delay.
Three physicians' diagnoses, for each subject, are in columns 2–4, with the consensus reached in column 5.
Time (h) Intermediate transit range Generalized delay range Right-sided delay range Left-sided delay range 3 0.0−0.6 0.0−0.0 0.0−0.0 0.0−0.0 20 0.6−1.7 1.5−2.4 1.2−2.8 24 4.3−4.9 0.8−2.2 1.6−2.5 1.8−2.5 27 4.3−4.9 0.9−2.3 1.6−2.7 2.4−4.1 44 1.9−3.1 1.9−3.2 3.2−5.4 48 6.7−6.8 2.2−2.5 2.1−3.0 3.2−5.4 51 6.7−6.8 2.3−2.4 1.9−3.2 3.2−5.6 69 6.8−6.9 3.1−3.6 2.6−3.7 3.4−5.7 72 3.3−5.6 75 6.8−6.9 3.4−3.8 2.5−3.9 3.3−5.7 GC ranges, for different patterns of colonic transit, are shown for each time point. Ranges represent segment of colon that activity has reached at that time point.
Side of colon Median (qdev) (h) Right Arrival 20.5 (1.25) Clearance 74.5 (24) Left Arrival 27.5 (22.5) Clearance 74.5 (0.625) Median of arrival times in right and left colons differs by 7 h. Clearance time for both sides is the same (74.5 h), which indicates slow transit through right side in several subjects.
Subject Physicians' assessment GC Parametric images R side vs. L side 1 Gen delay Gen delay Gen delay Gen delay 2 R delay R delay R delay R delay 3 R delay Gen delay Gen delay Gen delay 4 R delay R delay R delay R delay 5 R delay R delay R delay R delay 6 R delay R delay R delay Gen delay 7 R delay L delay L delay L delay 8 Intermediate L delay L delay L delay 9 Gen delay Gen delay Gen delay Gen delay 10 L delay R delay L delay L delay 11 Intermediate Intermediate Intermediate Intermediate 12 Intermediate Intermediate Intermediate Intermediate 13 L delay L delay L delay L delay 14 L delay L delay L delay L delay 15 Gen delay R delay L delay L delay 16 L delay L delay L delay L delay Gen delay = generalized delay.
Columns 2−5 show categorization of each patient by 4 different methods. There is agreement between 4 methods in 10 subjects.
Physician GC Parametric images R and L colon Physician 11 12 12 GC 11 14 13 Parametric images 12 14 15 R and L colon 12 13 15 Matrix compares number of agreements between 4 methods of assessment in 16 subjects.


Jump to section
Related Articles
Cited By...
- No citing articles found.