


Abstract
There is no standard method of analysis of scintigraphic colonic transit investigation. This study was designed to compare 4 techniques. Methods: Sixteen subjects (median age, 37.5 y; range, 21–61 y), who had sustained a spinal cord injury more than a year before the study, were given a pancake labeled with 10–18 MBq of 111In bound to resin beads to eat. Anterior and posterior images were acquired with a γ-camera 3 h after the meal and then 3 times a day for the next 4 d. Seven regions of interest, outlining the ascending colon, hepatic flexure, transverse colon, splenic flexure, descending colon, rectosigmoid, and total abdominal activity at each time point, were drawn on the anterior and posterior images. The counts were decay corrected and the geometric mean (GM), for each region, at each time point calculated. The GM was used to calculate the percentage of the initial total abdominal activity in each region, at each time point. Colonic transit was assessed in 4 ways: (a) Three independent nuclear medicine physicians visually assessed transit on the analog images and classified subjects into 5 categories of colonic transit (rapid, intermediate, generalized delay, right-sided delay, or left-sided delay). (b) Parametric images were constructed from the percentage activity in each region at each time point. (c) The arrival and clearance times of the activity in the right and left colon were plotted as time–activity curves. (d) The geometric center of the distribution of the activity was calculated and plotted on a graph versus time. The results of these 4 methods were compared using an agreement matrix. Results: Though simple to perform, the visual assessment was unreliable. The best agreement occurred between the parametric images and the arrival and clearance times of the activity in the right and left colon. Conclusion: The different methods of assessment do not produce uniform results. The best option for evaluating colonic transit appears to be a combination of the analog images, which provide a general overview of colonic transit and a quantitative method that demonstrates segmental transit.
The life span of subjects with spinal cord injury is increasing because of improved treatment and postinjury care. Problems caused by spinal cord injuries are therefore becoming more significant. Spinal cord–injured subjects rate bowel and bladder dysfunction as having major effects on their quality of life. Regional colonic transit in spinal cord–injured subjects was studied to establish whether the level of spinal cord injury had a recognizable effect on the pattern of colonic transit.
The use of a radiolabeled meal, in which the label remains with the meal as it passes through the gastrointestinal tract, provides a physiologic method of determining colonic transit. It is noninvasive and enables the acquisition of multiple images without an increase in the radiation dose (1). The studies give precise, quantitative information on colonic transit and it is possible to determine the region of delay (2–4).
Although there are several published studies using scintigraphic methods for investigating colonic transit, each investigator uses a different method to interpret the data (3–6). It is not clear from the literature which method is the most applicable.
The aim of this study was to compare 4 techniques of data analysis and determine the optimum method of presenting the results of colonic transit for use in clinical practice.
MATERIALS AND METHODS
Subjects
Sixteen subjects (5 females, 11 males) with a median age of 37.5 y (range, 21–61 y) were recruited. All subjects had sustained a complete spinal cord injury >1 y before this study.
Ethics
The Ethics Committee of the University of Cape Town approved this research. The procedure and the use of radionuclides were fully explained to the subjects. All subjects gave verbal informed consent to the radiographer in the presence of the nursing sister involved in the trial. Unfortunately, this was not documented. Written consent was not obtained as more than half the subjects were unable to write because of their spinal injuries.
Subject Preparation
Subjects were requested to use their usual method of bowel emptying 2 d before commencement of the study. They were asked not to use any further laxatives, enemas, or suppositories until the end of the study. The subjects were asked not to eat or drink from 10:00 pm on the night before the start of the study apart from a cup of tea or coffee at 6:00 am on the day the test meal was eaten. The radiolabeled, standardized pancake plus 50–100 mL of water were given at 12:30 pm. This meal contained 27 g of fat and 18 g of protein. It had a total weight of 492 g and a caloric content of 625 calories and consisted of 57 g flour, 142 g milk, 14 g oil, and 1 egg (1). It was labeled with 10–18 MBq 111In bound to Amberlite (IR-120; Sigma Chemical Co.) resin beads. The resin beads have been shown to bind 111In irreversibly so that it remains confined to the lumen of the gastrointestinal tract (1,3,4,7,8).
The subjects were not given any other food or liquid until after the 3-h image. Thereafter, they could eat and drink freely.
Imaging Protocol
A 40-cm field-of-view (FOV) Elscint γ-camera with a medium-energy collimator was used to acquire the images on a 256 × 256 matrix. Energy windows of 20% were set on the 2 energy peaks of 111In, 173 and 247 keV.
Planar scintigrams were obtained for an acquisition time of 400 s in the anterior and posterior projections with the patient supine on the imaging table. When it was not possible to acquire images for the full 400 s, counts were corrected for the time difference. Initially this occurred quite frequently (11/16 subjects) because the subjects were tense and nervous and suffered from severe muscle spasm. As the investigation progressed, this happened less frequently and the full 400-s acquisition time was possible for 15 of the 16 subjects.
The initial images were acquired 3 h after the ingestion of the pancake. All activity within the abdomen was included within the FOV. When this was not possible, 2 overlapping images were acquired. Anterior and posterior supine scintigrams were then acquired 3 times a day for the following 4 d at 8:30 am, 12:00 noon, and 4:00 pm. The investigation was terminated early if there was very little detectable activity left in the bowel.
Data Processing
Seven regions of interest (ROIs) were drawn on both the anterior and posterior images (Fig. 1). When segments were superimposed at the flexures, the counts of the superimposed segments were included in the relevant flexure ROI. An artificial, eighth region was calculated to represent the percentage excreted. This was the percentage difference between the initial total FOV counts and the total FOV counts for time x. A difference of >10%, after correction for decay, was assumed to be due to fecal loss (9). The counts obtained in the ROIs on the images that were acquired for <400 s were corrected for time and then corrected for decay (DCC) back to time 0. These corrected counts were used in all subsequent calculations. The geometric mean (GM) for each region at each time point was calculated from the corrected counts in the anterior and posterior images as well as the total FOV at time 0. The GM of the total FOV at time 0 was calculated because the percentage activity in each ROI was calculated as a percentage of the total FOV at time 0.
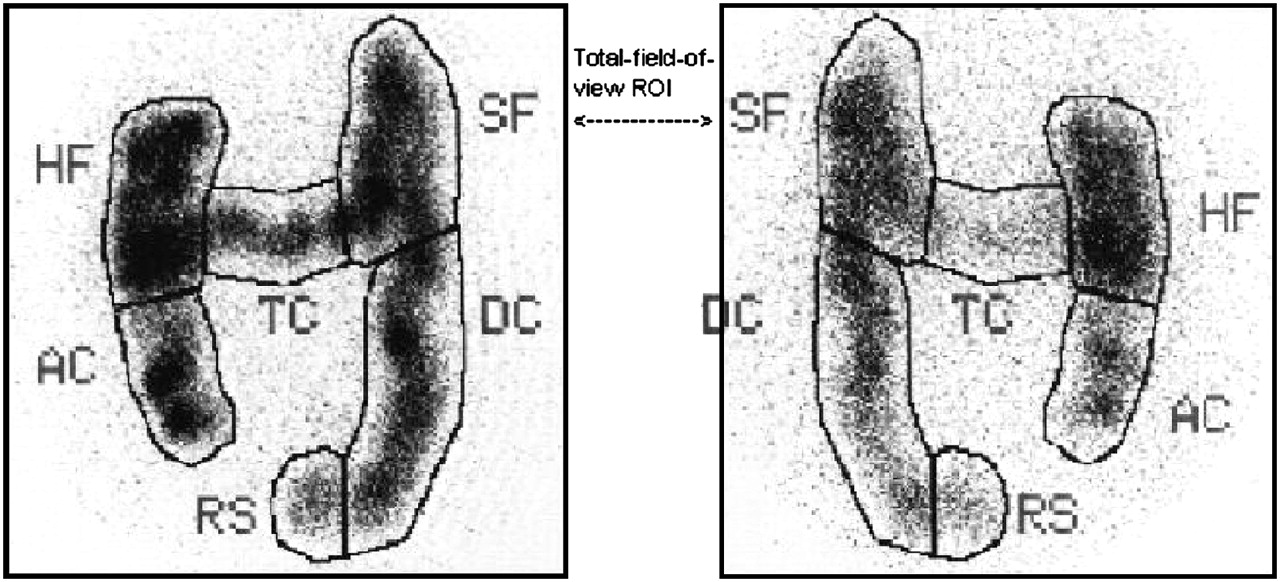
Segmental ROIs of colon: anterior and posterior ROIs include ascending colon (AC), hepatic flexure (HF), transverse colon (TC), splenic flexure (SF), descending colon (DC), rectosigmoid (RS), and total activity in abdomen. When it is difficult to separate flexures from surrounding segments of colon, they are included in ROIs drawn around flexures.
Four methods were used to interpret the images:
Visual Assessment.
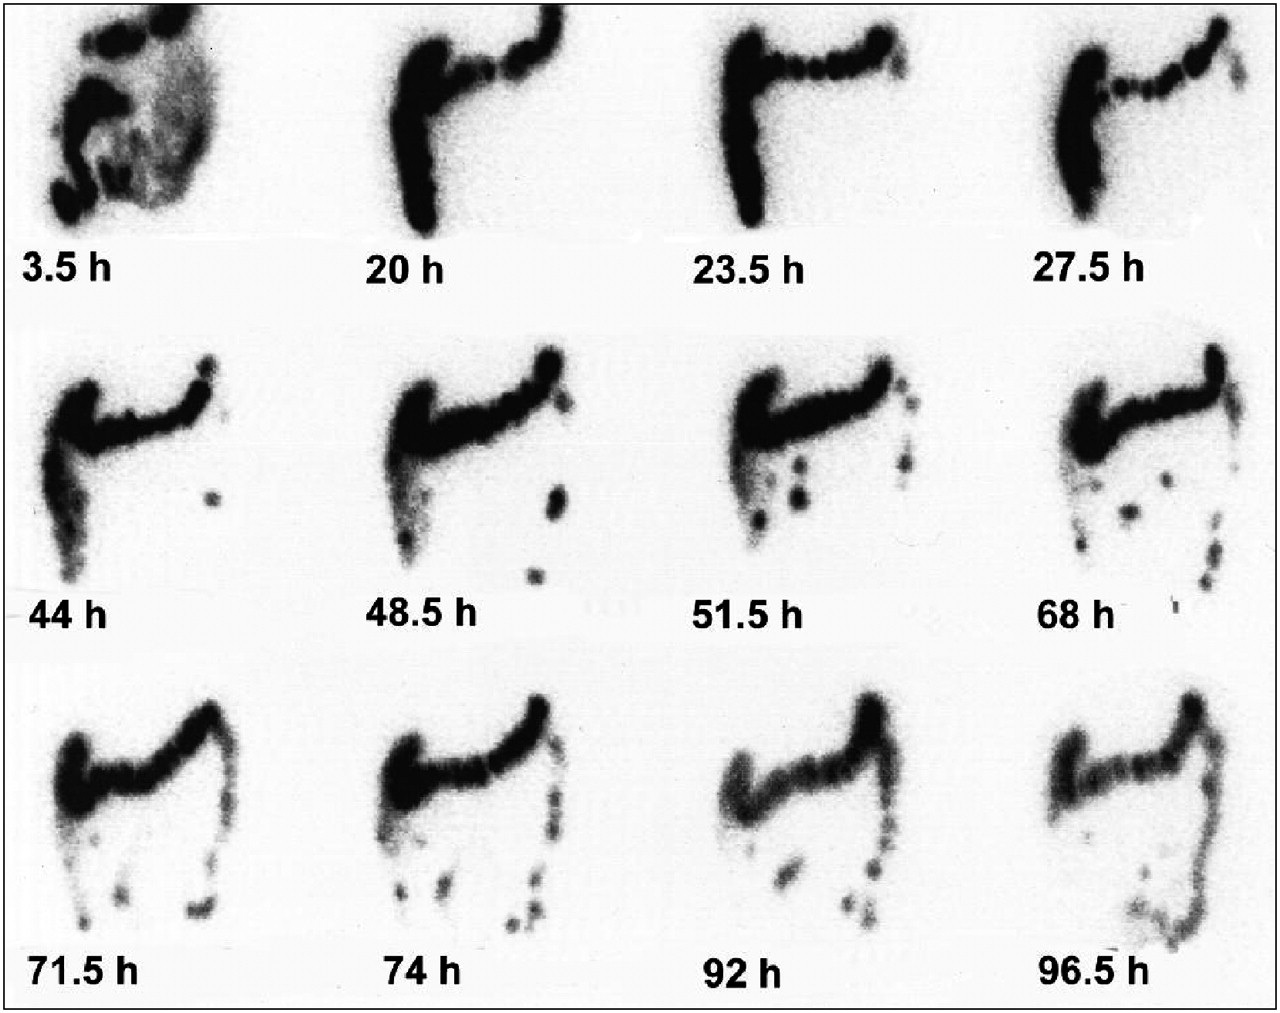
Hard copies were made of all images. The time of imaging and orientation (anterior/posterior) of the image were clearly marked on each image (Fig. 2).

Anterior analog images. Right-sided delay is shown over a period of 96.5 h. Activity reaches splenic flexure within 20 h. At 68 h, bulk of activity lies within transverse colon and, although the activity moves slowly into descending colon and rectosigmoid by 96.5 h, the bulk of activity is still within transverse colon.
Three nuclear medicine physicians who were not given any clinical information were asked to independently, visually assess colonic transit from the anterior hard-copy images. They classified transit into 1 of 5 patterns—namely, rapid transit, intermediate transit, generalized delay, right-sided delay, and left-sided delay (Table 1). A contingency correlation was used to measure the association between the 3 physicians' assessments. The majority opinion on each subject was used to compare the result of this method with subsequent ones.
Patterns of Colonic Transit
Parametric Images.
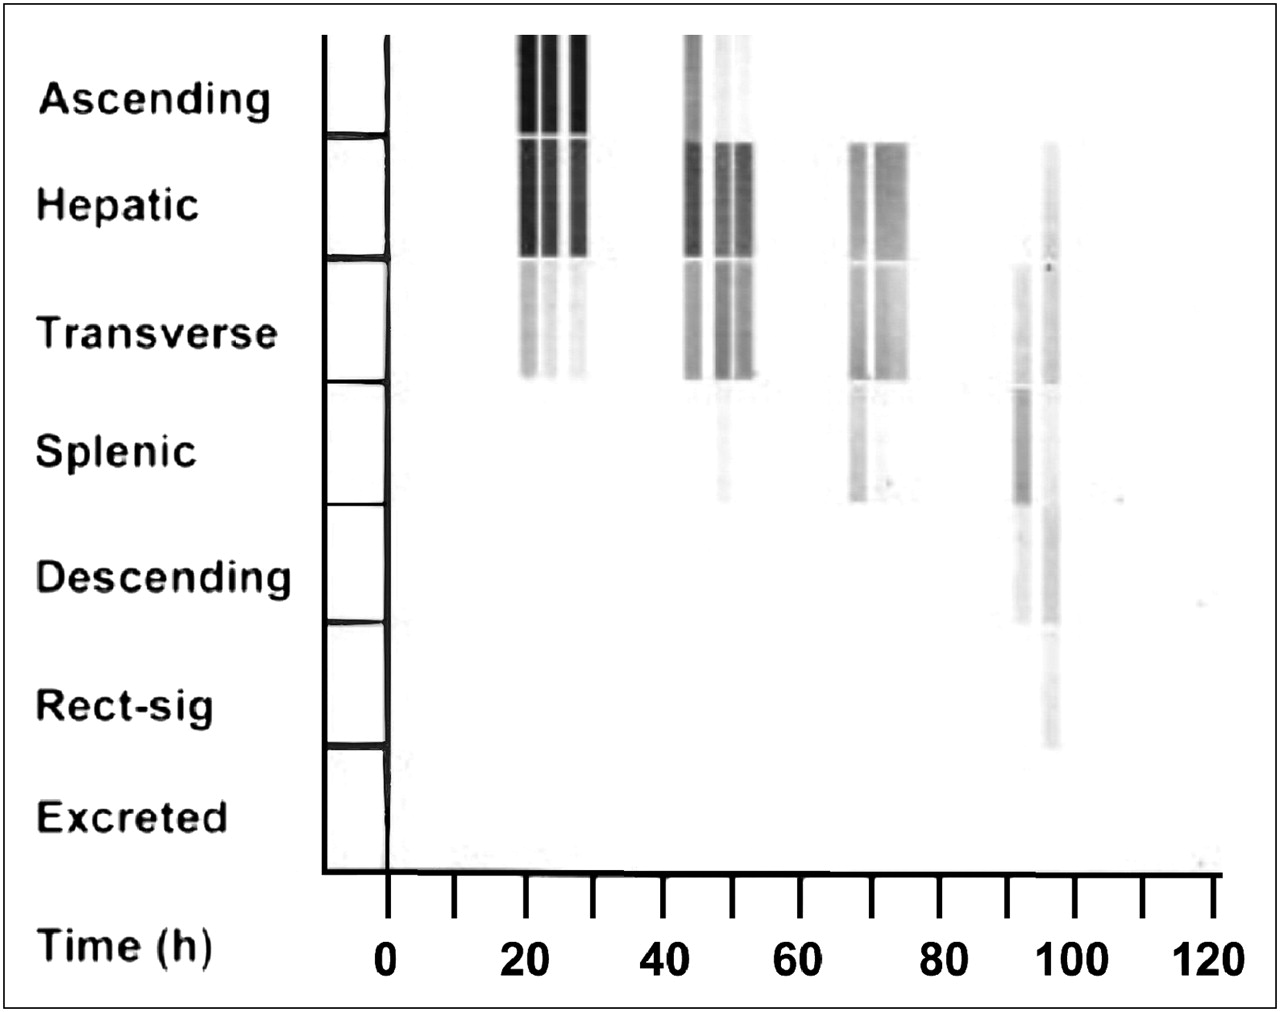
The GM counts in each region for each time point were expressed as a percentage of the GM initial total abdominal counts as determined from the 3-h image (% activity). Parametric images were constructed using the percentage activity for each region versus time. In Figure 3, the percentage activity is plotted on the y-axis (gray scale) versus the time in hours on the x-axis. Hard copies were taken and were visually assessed.

Parametric images of right-sided colonic delay. A gray scale is used to visually express the percentage activity in each segment of colon over time (y-axis), which is plotted against time (x-axis). Slow movement of activity through ascending colon, hepatic flexure, and transverse colon can be clearly followed over 96.5-h period.
Geometric Center (GC).
The GC of the isotope distribution was calculated using the GM as follows: where 1 = ascending colon, 2 = hepatic flexure, 3 = transverse colon, 4 = splenic flexure, 5 = descending colon, 6 = rectosigmoid, and 7 = excreted activity (6).
The GC was plotted on a graph as GC versus time using Microsoft Excel (Fig. 4). The GC ranges were calculated for each time point in the 4 categories of colonic transit patterns found in the subjects to identify a recognizable range for each pattern.
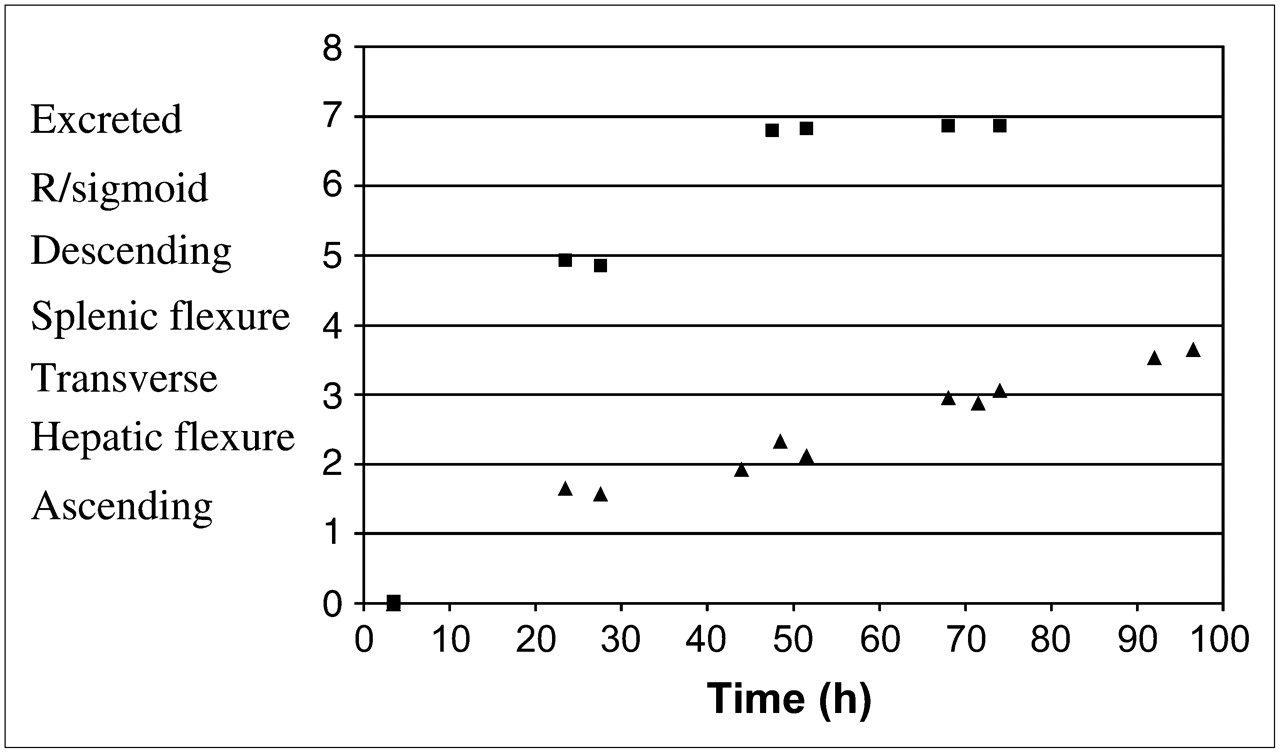
GCs of normal transit (▪) and right-sided delay (▴) in colonic transit over 96.5-h period. Segments of colon are indicated on y-axis: ascending colon (1), hepatic flexure (2), transverse colon (3), splenic flexure (4), descending colon (5), rectosigmoid (R/sigmoid) (6), excretion (7). Time (h) is plotted on x-axis.
Right Versus Left Colon.
The right side was defined as the ascending colon, hepatic flexure, and transverse colon. The percentage activities in these regions were combined to give the percentage activity in the right side for each time point. The left side of the colon was defined as the splenic flexure, descending colon, and rectosigmoid and the percentage activities of these regions were summed to give the percentage activity in the left side. Time–activity graphs were constructed using Microsoft Excel (Fig. 5). Activity was considered to have entered the right side of the colon when the activity in the right side of the colon was >10% of the total abdominal activity. Similarly, the time of entry into the left side of the colon was determined when >10% of the total abdominal activity had entered the left side of the colon. Activity was considered to have cleared from the relevant side of the colon when the activity had decreased to <10% of the total abdominal activity. This allowed assessment of the different functions of the 2 sides of the colon.
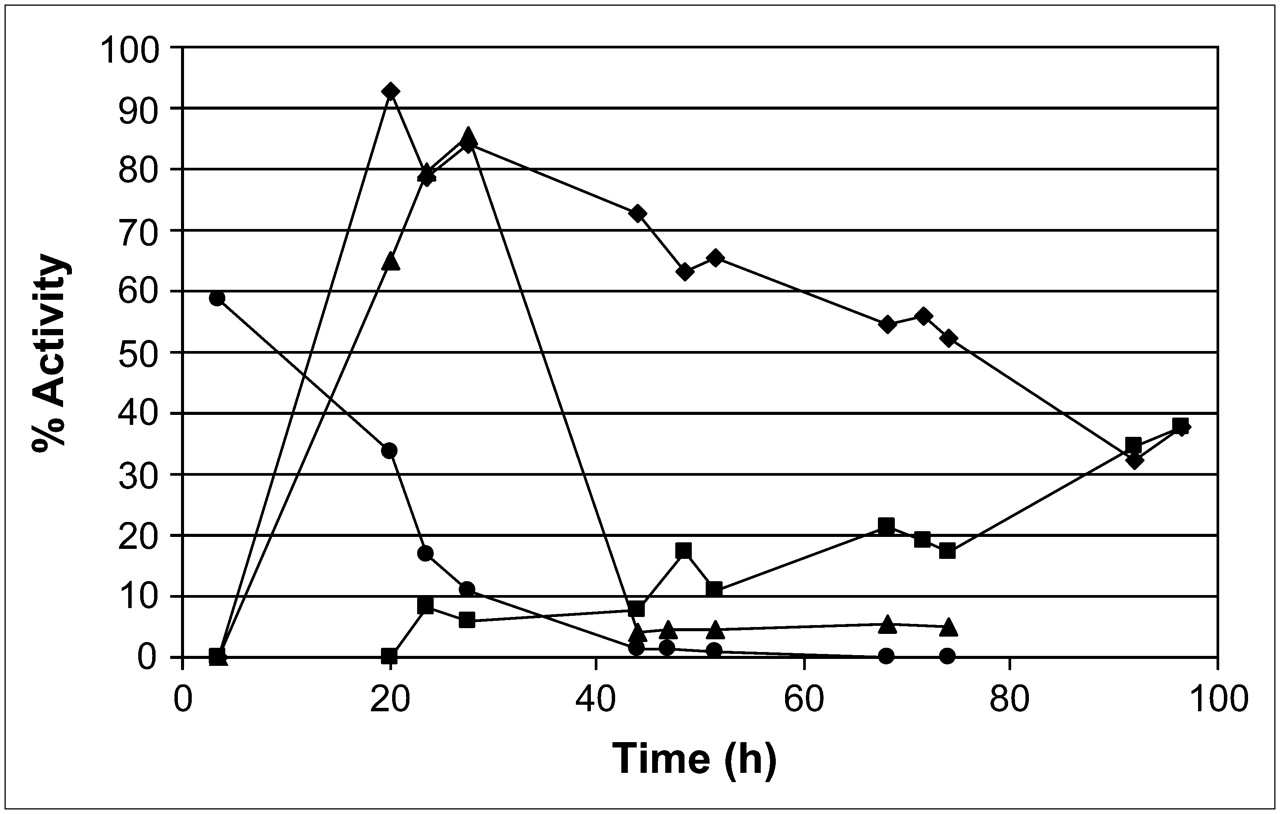
Time–activity curves. Intermediate or normal transit is clearly evident. As right side of colon (•) empties, left side (▴) fills and then empties by 44 h. Right-sided colonic delay is demonstrated. Pancake moves slowly through right colon (♦), whereas left colon (▪) only contains 39% of meal at 96.5 h.
Comparison of Methods of Assessment.
The 4 methods of evaluating colonic transit (analog images, GC, parametric images, and right side vs. left side of colon) were assessed independently.
Statistical Analysis
The contingency coefficient was used to measure the extent of association between the reports of the 3 nuclear medicine physicians. The contingency coefficient is used to measure the association between attributes that are categoric (nominal scale) in an unordered series of frequencies.
Because the data were nonparametric, the median (med) and the interquartile range (qdev)—that is, the deviation around the median—were calculated for the comparison between arrival and departure times of the activity in the right colon and left colon.
RESULTS
Visual Assessment
The result of the 3 nuclear medicine physicians' visual assessment of the anterior analog images for each subject, according to the prescribed pattern of colonic transit, is shown in Table 2. The physicians' assessment was in complete agreement in only 4 of the 16 (25%) studies. The contingency coefficient (0.81) shows that the correlation between physicians 1 and 3 is significant (P < 0.001).
Analysis of Physicians' Visual Assessments
GC
Table 3 shows the range of the GCs for each colonic transit pattern for each time point. The more rapid transit of the intermediate group is clearly seen by 24 h. At 48 h, the GC range for the intermediate group is 6.7–6.8. At 24 h, there is considerable overlap of the GC ranges for all delayed patterns. Between 44 and 51 h, the range for the left-sided-delay group is 3.2–5.6, but after that it overlaps with the other delayed groups at the lower end of the range. This overlapping of the ranges for all delayed groups appears and disappears at different times throughout the study. There is a consistent overlap between the generalized delay and the right-sided delay.
GC Ranges
Parametric Images
The movement of the activity through the colon was clearly evident on the parametric images. In all but 1 subject, movement took place between the late afternoon image and the early morning image of the following day. Excretion was calculated to have occurred in 8 subjects.
Right Side Versus Left Side of Colon
The arrival and clearance times in both the right colon and left colon were calculated for each of the 16 subjects. The median arrival time for both sides of the colon was calculated from these figures as was the interquartile range. Similarly, the median clearance time for both sides of the colon was calculated from these figures as was the interquartile range (Table 4). It appears that the arrival time in the right colon was similar for all 16 subjects, with a median arrival time of 20.5 h and an interquartile range of 1.25 h. There appears to be a wide spread of clearance times from the right colon with a median clearance time of 74.5 h and an interquartile range of 24 h. This has resulted in a wide spread of the arrival times in the left colon, with a median of 27.5 h and an interquartile range of 22.5 h. The clearance time from the left colon is more uniform, with a median of 74.5 h and an interquartile range of 0.625 h.
Median (qdev) Arrival and Clearance Times in Right and Left Colon
Comparison of 4 Methods of Assessment
The result of each method of assessment of transit for each subject is shown in Table 5. There was agreement between all 4 methods in 10 of the subjects using the consensus of the 3 physicians' results. In 3 subjects, there was disagreement between the visual assessment and the 3 quantitative methods. In 2 of the subjects, the disagreement occurred between the GC and the other 3 methods. In 1 subject, both the visual assessment and the GC disagreed with each other and the other 2 quantitative methods. The agreement between the 4 methods of assessment is presented in Table 6.
Categorization of Each Subject According to Each Method
Agreement Matrix
DISCUSSION
In this study 4 different methods of analyzing the data are compared. The visual analysis of the analog images was subjective, with disagreement between the 3 physicians in 12 of the 16 subjects (75%). The parametric images and the comparison between arrival and clearance times in the right and left colons agree in 15 of 16 subjects (94%). In the agreement matrix, the least agreement was found between the consensus of the 3 physicians' visual assessments of the analog images and the 3 quantitative methods (Table 6). The agreement of the overall consensus results with the quantitative methods (69%–75%) is better than that of the individual physicians. The 3 physicians each agreed with the quantitative methods 50% of the time. Their agreement with the GC was 50%–56%, agreement with the parametric images was 56%–69%, and agreement with the right and left colon was 56%–63%. The assessment of the analog images by 1 physician is unreliable.
Although the visual assessment was simple to perform, it was unreliable. This finding is similar to the results of Notghi et al. (5). The parametric and right or left colon methods provided good agreement. This is to be expected as both of these methods were constructed from the percentage activity in each segment of the colon for each time point. The difference was in how the data were used.
Parametric images are a simple and concise way of showing the segmental movement of a radioactive meal through the colon over a period of several days. The transit and gaps (night time when imaging does not occur) and backward movement of the meal can be easily seen. A parametric image is easier to interpret than the multiple images obtained from the raw data as the transit of the percentage activity through each region of the colon can be easily seen. This finding is similar to that reported by Notghi et al. (9).
GC is a single figure that indicates the region where the median of the activity lies for each time frame and, thus, determines the velocity of colonic transit. It shows neither the spread of the meal in the colon nor the backward or forward movement of parts of the meal (4).
At varying times, the GC range (Table 3) overlapped for all of the delayed categories. This sometimes made the categorization of individual subjects by GC alone inaccurate. This finding is similar to the findings of Notghi et al. (9).
Transit through the right and left colon was quite variable (Table 4). This finding may be attributed to the fact that this study focused on a specific group of patients with a history of spinal cord injury of at least 1-y duration. Proano et al. (3) showed similar variability among healthy controls with regular bowel habits. Although this method did not appear to be useful for analysis of the group because of the variability betweens subjects and, therefore, the difficulty of determining normal values, it provides a clear pattern of transit in the individual.
The biggest problem encountered when processing the data was identifying the different segments of the colon. The superimposition of the various segments caused a problem when drawing the ROIs. This most commonly occurred at the flexures, where the hepatic flexure, transverse colon, and even ascending colon could be superimposed one on the other, or similarly the splenic flexure, transverse colon, and descending colon. The counts in this combined ROI caused the percentage activity in the flexures to be artificially raised. The total counts in each image for each time were always corrected for decay and, where necessary, for acquisition time. In theory, these should have remained constant unless excretion had taken place. In practice, this did not occur; the counts decreased over time. The decrease in counts could have been due to the change in distribution of the activity within the FOV or to attenuation not wholly corrected for by the GM. Another reason for this discrepancy may be that the subject regarded his or her fecal loss as negligible so he or she did not mention it. It may be that for all of the above reasons the use of a difference in counts of >10% as evidence of excretion may be too low.
CONCLUSION
There was no complete agreement between the 4 methods of assessment; therefore, one method used in isolation is not recommended. Visual assessment of the analog images provides a general overview of colonic transit but is highly variable and has a high degree of disagreement between observers (75%), which would bring into question the accuracy of the visual method.
A combination of the analog images and any one of the quantitative methods, which show segmental transit, is the best option for evaluating colonic transit.
Acknowledgments
We thank Dr. Bruce K. Adams and Prof. Annare Ellmann for assisting with the assessment of the analog images and Sister Priscilla d'E Stevens for her help.
References
- Received for publication August 19, 2005.
- Accepted for publication March 20, 2006.


