


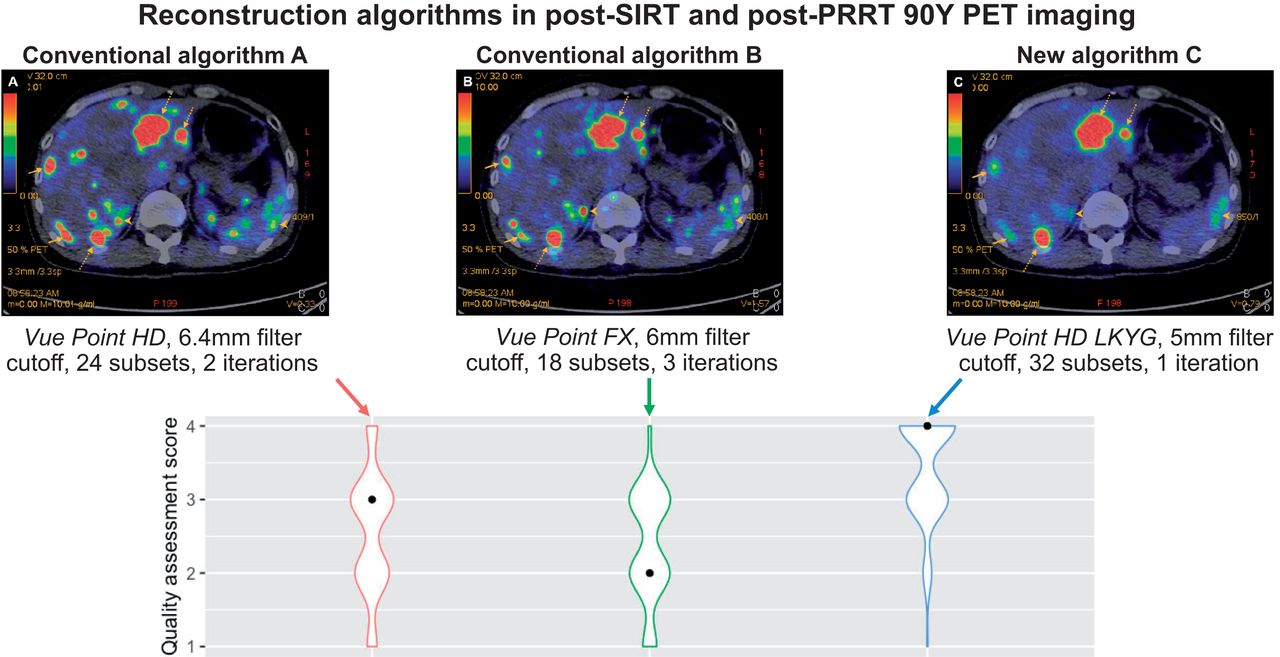
Visual Abstract

Abstract
This study aimed to improve the quality of 90Y PET imaging by optimizing the reconstruction algorithm. Methods: We recruited 10 patients with neuroendocrine tumor metastatic to the liver or primary hepatocellular carcinoma who were qualified for 90Y-labeled selective internal radiation therapy or peptide receptor radionuclide therapy. They underwent posttherapeutic PET/CT imaging using 3 different reconstruction parameters: VUE Point HD with a 6.4-mm filter cutoff, 24 subsets, and 2 iterations (algorithm A); VUE Point FX with a 6.0-mm filter cutoff, 18 subsets, and 3 iterations using time of flight (algorithm B); and VUE Point HD (LKYG) with a 5-mm filter cutoff, 32 subsets, and 1 iteration (algorithm C). The reconstructed PET/CT images were assessed by 10 nuclear medicine physicians using 4-point semiqualitative scoring criteria. A P value of less than 0.05 was considered significant. Results: The median quality assessment scores for algorithm C were consistently scored the highest, with algorithms A, B, and C, scoring 3, 2, and 4, respectively. The 90Y PET scans using algorithm C were deemed diagnostic 91% of the time. There was a statistically significant difference in quality assessment scores among the algorithms by the Kruskal–Wallis rank sum test ( = 86.5, P < 0.001), with a mean rank quality score of 130.03 for algorithm A, 109.76 for algorithm B, and 211.71 for algorithm C. Subgroup analysis for quality assessment scoring of post–peptide receptor radionuclide therapy imaging alone showed a statistically significant difference between different scanning algorithms (
 = 35.35, P < 0.001), with mean rank quality scores of 45.85 for algorithm A, 50.05 for algorithm B, and 85.6 for algorithm C. Similar results were observed for quality assessment scoring of imaging after selective internal radiation therapy (
 = 79.90, P < 0.001), with mean ranks of 82.33 for algorithm A, 55.79 for algorithm B, and 133.38 for algorithm C. Conclusion: The new LKYG algorithm that was featured by decreasing the number of iterations, decreasing the cutoff of the filter thickness, and increasing the number of subsets successfully improved image quality.
Because of its outstanding physical and chemical features, 90Y is one of the most commonly used radionuclides in contemporary nuclear medicine as both a diagnostic and a therapeutic agent, giving rise to the lauded concept of theranostics (1). 90Y-based radiopharmaceuticals have been used in various oncologic therapies, which include but are not limited to 90Y-labeled anti-CD20 monoclonal antibody (ibritumomab tiuxetan [Zevalin; Acrotech Biopharma, Inc.]) radioimmunotherapy for lymphoma, 90Y-dotapeptide radionuclide therapy for neuroendocrine tumors, and 90Y-microsphere selective internal radiation therapy (SIRT) for liver tumors (2). Posttherapy imaging is therefore essential in confirming successful delivery of 90Y-labeled agents, dosimetry of the tumor and critical organs, and dose planning for the next treatment.
The conventional postimaging modality using 90Y bremsstrahlung technique unfortunately bears the inherent drawbacks of poor spatial resolution and unsatisfactory readability. 90Y PET/CT, on the other hand, has emerged as the modality of choice for better-quality posttherapeutic scans. Despite the advances in technology, the main challenge for 90Y PET imaging is its extremely low abundance of positron emissions per decay, requiring a long scanning time for an adequate signal-to-noise ratio. Because of patients’ general lack of toleration of prolonged scanning times, it is difficult to achieve adequate counts, and the quality of PET images using standard or modified reconstruction algorithms has been found unsatisfactory in many literature reports. There is also a lack of consensus guidelines for the technical acquisition, imaging reconstruction, and qualitative and quantitative interpretation of 90Y planar, SPECT, and PET images. In addition, most nuclear medicine imaging systems are not currently designed or specifically optimized for 90Y imaging applications (3).
In this article, we report our efforts to modify the reconstruction algorithm and consequently improve 90Y PET imaging quality in order for our experience to serve as a reference for other practitioners.
MATERIALS AND METHODS
Study Cohort
In total, 10 consecutive patients qualified for 90Y-labeled SIRT or peptide receptor radionuclide therapy (PRRT) were recruited. For 90Y-PRRT, the 90Y was purchased from Perkin Elmer, and the 90Y-DOTATATE was then synthesized in our department’s radiopharmacy. 90Y-DOTATATE, with a dose ranging from 3.0 to 5.0 GBq, was given intravenously to the patients in the dedicated isolation ward. For 90Y-SIRT, 90Y microspheres were purchased from SIRTEX Medical Singapore Pte. Ltd. 90Y-microspheres, with a dose ranging from 0.5 to 3.0 GBq, were administered intraarterially to the targeted hepatic lesions in the interventional radiology suite at Singapore General Hospital.
The institutional review board approved this study, and the requirement to obtain informed consent was waived because most patients in the study had passed away or were overseas.
Scanning Protocol and Reconstruction Algorithm
All patients were scanned on a GE Healthcare Discovery PET/CT 690 scanner either on the same day as radiotracer injection or the next morning. A low-dose CT protocol at 120 kV, with an automated current ranging between 10 and 200 mA and a noise index of 18, was obtained for attenuation correction and anatomic localization followed by a PET acquisition for 30 min per bed position, covering the diaphragm to the iliac crest of the pelvis for SIRT patients and variable locations for PRRT patients, depending on where the disease burden was. PET images were corrected for motion and attenuation on the basis of the CT data. The reconstruction was performed using both a fully 3-dimensional ordered-subset expectation maximization algorithm either with or without time of flight (TOF) and a GE Healthcare Sharp IR point-spread function algorithm. Three different reconstruction parameters with variations in the full-width-at-half-maximum gaussian filter size and in the number of iterations and subsets were used: VUE Point HD (GE Healthcare) (non-TOF) with a 6.4-mm filter cutoff, 24 subsets, and 2 iterations (algorithm A); VUE Point FX (GE Healthcare) (with TOF) with a 6.0-mm filter cutoff, 18 subsets, and 3 iterations (algorithm B); and VUE Point HD (LKYG) (non-TOF) with a 5-mm filter cutoff, 32 subsets, and 1 iteration (algorithm C) (Table 1). The reconstructed matrix size was 192 × 192, with a pixel dimension of 3.65 mm. Algorithms A and B were routinely used in our center and many other centers, whereas algorithm C was purposefully modified and named LKYG. Maximum-intensity-projection images were also generated. Both attenuation-corrected and uncorrected PET images, as well as PET/CT fusion images, were reviewed.
Parameters of the 3 Tested Algorithms
Quality Assessment
For each patient, the reconstructed PET/CT images using the 3 different algorithms were presented for quality assessment to 10 nuclear medicine physicians (readers) with work experience ranging from 2 to 20 y. The quality of the images was graded according to semiqualitative scoring criteria as nondiagnostic, barely diagnostic, fairly diagnostic and diagnostically excellent (Table 2). All readers were masked to the reconstruction algorithms.
Scoring Criteria for Image Quality Assessment
Statistical Analysis
Statistical quality assessment scores were compared among the algorithms by nonparametric Kruskal–Wallis rank sum testing and, in the event of a statistically significant difference in the Kruskal–Wallis test, by post hoc Wilcoxon rank sum testing. The potential confounding factors, including age, sex, body mass index, type of radioligand, and dose, were examined with multivariable ordered logistic regression analysis. The threshold for statistical significance (P value) was set at 0.05. Ordinal and continuous variables are reported as median values with interquartile range. The results from ordered logistic regression analysis are reported as odds ratios (ORs) with corresponding 95% CIs. Interrater reliability was assessed with the mixed-effects intraclass correlation coefficient (ICC), whereby an ICC of less than 0.5 constituted poor interrater agreement, an ICC of between 0.5 and 0.75 constituted moderate interrater agreement, an ICC of between 0.75 and 0.9 constituted good interrater agreement, and an ICC of more than 0.9 constituted excellent interrater agreement.
Statistical analysis was conducted on RStudio (R, version 3.6.3; R Foundation for Statistical Computing).
RESULTS
Patient Demographics and PET Study Parameters
Eight men and 2 women with a mean age of 61.5 ± 17.3 y and a mean body mass index of 23.54 ± 3.49 kg/m2 were recruited into our study (Table 3). Four of the patients (1 with rectal neuroendocrine tumor, 2 with midgut neuroendocrine tumor, and 1 with paraganglioma) received a mean 90Y-PRRT dose of 3.66 GBq. The other 6 patients (5 with hepatocellular carcinoma and 1 with pancreatic neuroendocrine tumor metastatic to liver) received a mean 90Y-SIRT dose of 1.85 GBq.
Patients’ Demographic Data
Interrater Reliability
Interrater reliability was moderate to good, with a κ of 0.82 (P < 0.001; 95% CI, 0.66–0.93) for algorithm A, 0.625 (P < 0.005; 95% CI, 0.29–0.85) for algorithm B, and 0.502 (P < 0.05; 95% CI, 0.06–0.80) for algorithm C.
Quality Assessment Scores
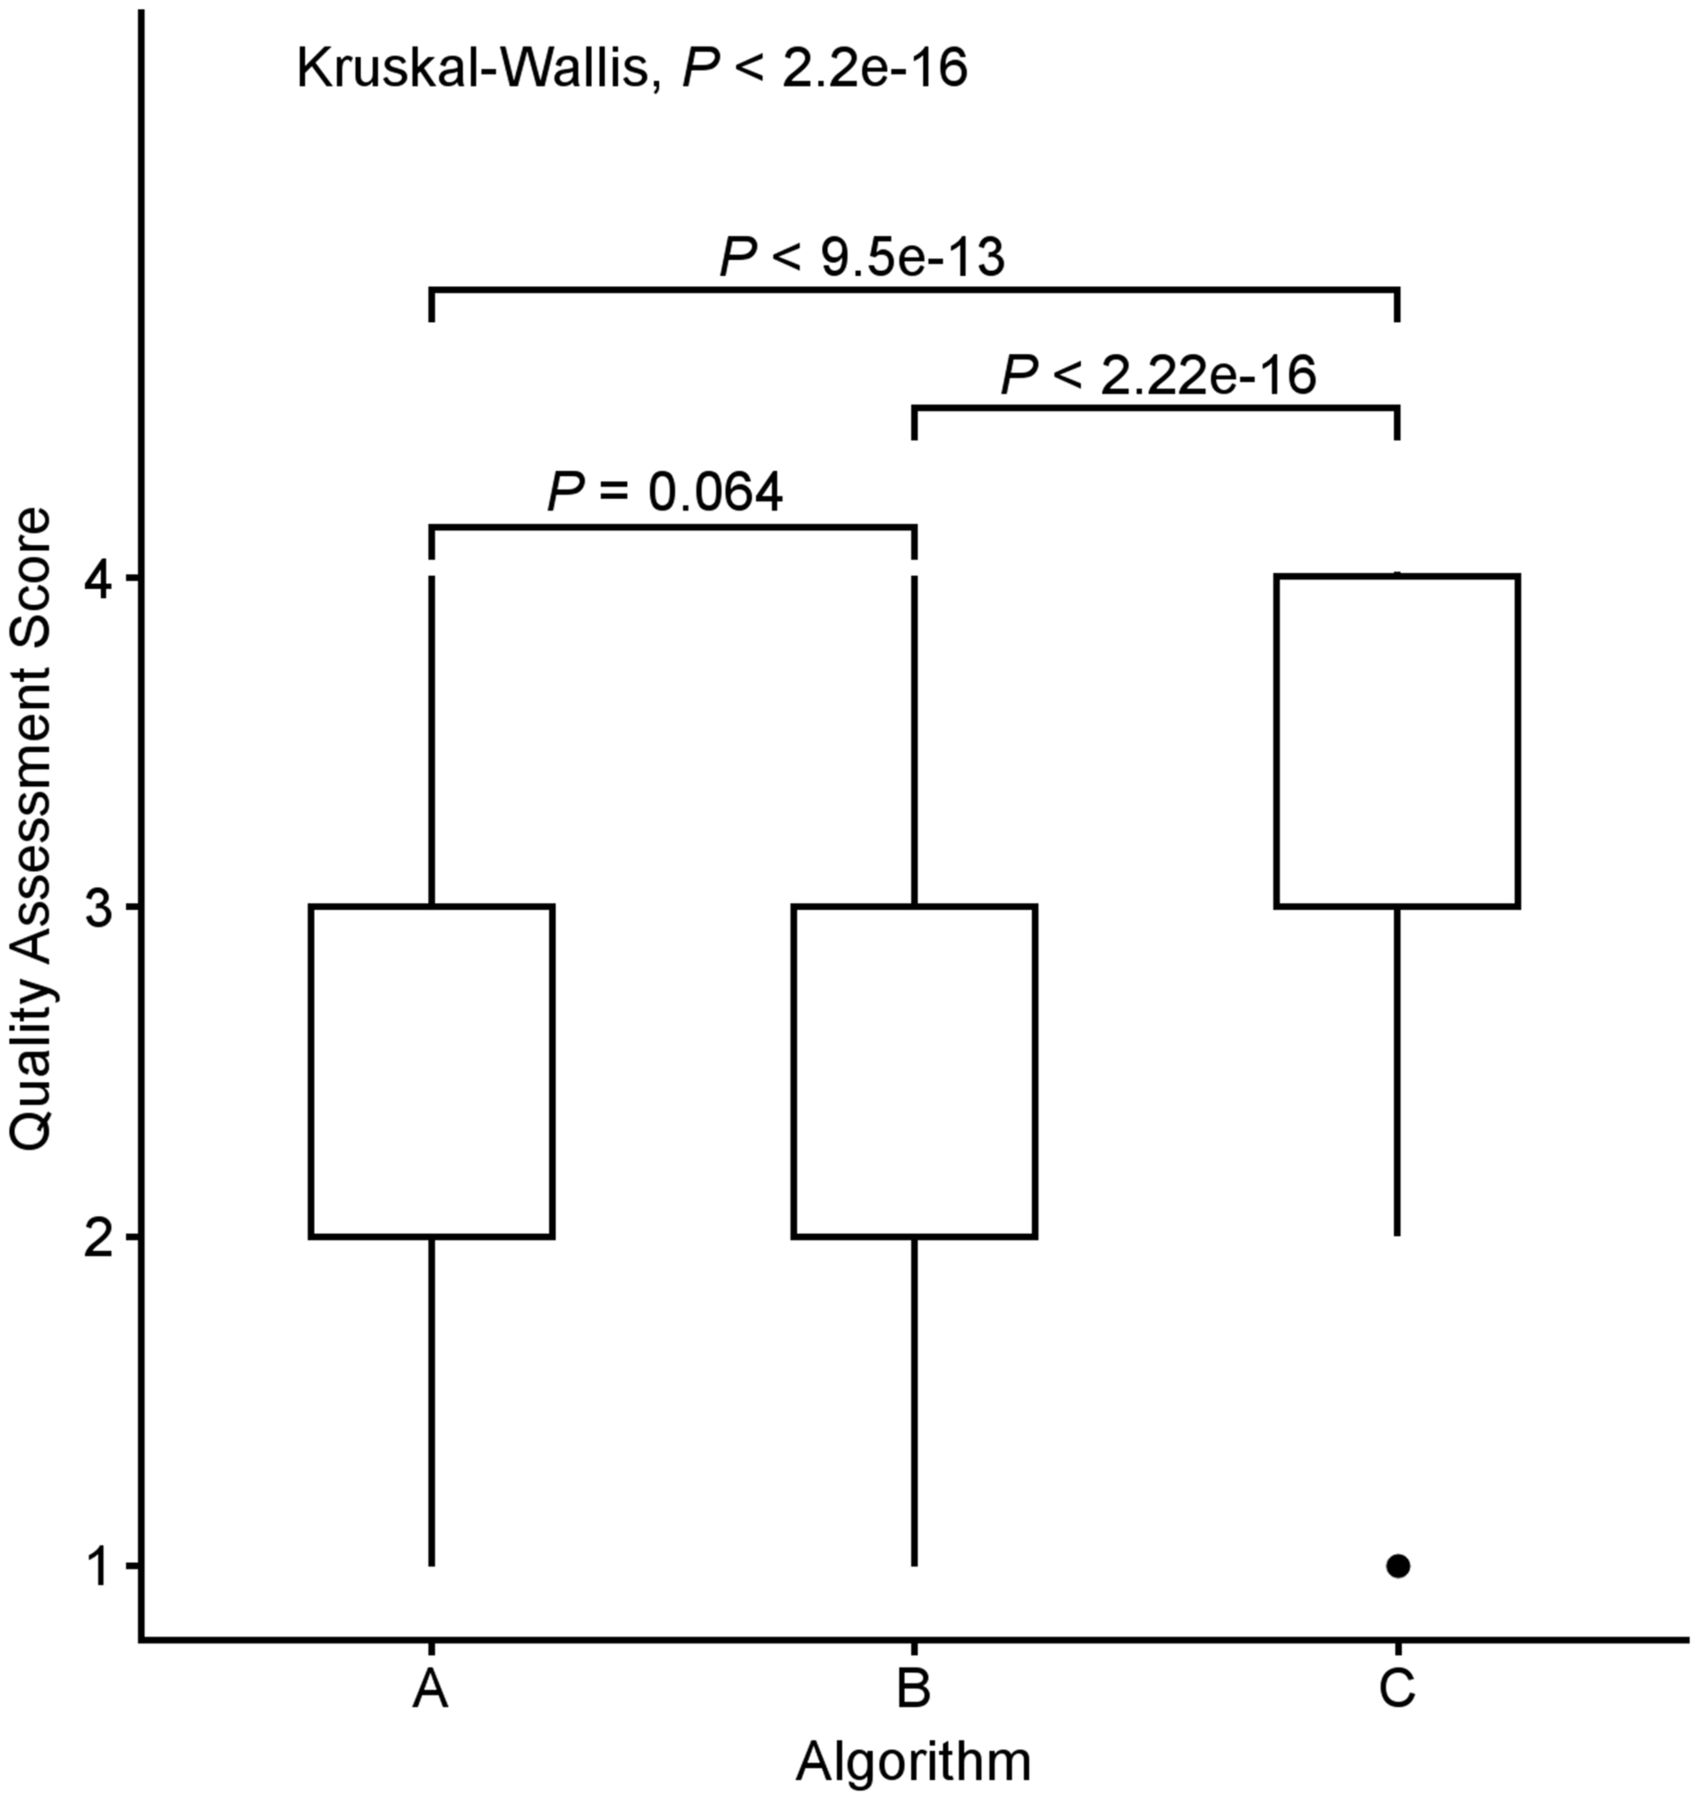
The median quality assessment scores for algorithms A, B, and C were 3 (interquartile range, 1), 2 (interquartile range, 1), and 4 (interquartile range, 1), respectively (Fig. 1). Algorithm C consistently scored the highest for each patient. Ninety-one percent of the time, the post-SIRT or post-PRRT scans using algorithm C were deemed diagnostic (quality score [QS]-3 or QS-4) by the 10 readers, achieving QS-4 53% of the time and QS-3 39% of the time. Only 1% of the time was algorithm C not diagnostic, compared with 10% of the time for algorithm A and 14% for algorithm B.

Box plots comparing median quality assessment scores among algorithms. Results from Kruskal–Wallis rank sum test and Wilcoxon rank sum test are included.
There was a statistically significant difference in quality assessment scores between algorithms by the Kruskal–Wallis rank sum test ( = 86.5, P < 0.001) (Table 4), with a mean rank QS of 130.03 for algorithm A, 109.76 for algorithm B, and 211.71 for algorithm C. Post hoc Wilcoxon rank sum testing showed that algorithm C scored significantly higher than algorithm A or B (A vs. C, P < 0.001; B vs. C, P < 0.001), whereas there was no significant difference in quality assessment scores between algorithms A and B (A vs. B, P = 0.064).
Number and Percentage of Discrete Scores Rated by 10 Readers on 10 Patients’ Scans Reconstructed Using Algorithms A–C
Subgroup analysis for quality assessment scoring of post-PRRT imaging alone showed a statistically significant difference among scanning algorithms as well ( = 35.35, P < 0.001), with a mean rank QS of 45.85 for algorithm A, 50.05 for algorithm B, and 85.6 for algorithm C. Similar results were observed for quality assessment scoring of post-SIRT imaging (
 = 79.90, P < 0.001), with a mean rank QS of 82.33 for algorithm A, 55.79 for algorithm B, and 133.38 for algorithm C. Therefore, we concluded that algorithm C remained better than algorithm A or B for both post-SIRT therapy scans and post-PRRT scans. For post-SIRT therapy scans, algorithm C fared remarkably better, with a minimum score of QS-3, and achieved excellent scoring of QS-4 75% of the time. For post-PRRT PET scans, algorithm C again fared remarkably better, achieving a good score of either QS-3 or QS-4 77.5% of the time, compared with 15% for algorithm A and 32.5% for algorithm B.
The Wilcoxon signed-rank test showed that the quality of post–SIRT therapy images (mean rank of 65.3 for algorithm A, 58.26 for algorithm B, and 63.13 for algorithm C) was consistently better than that of post-PRRT images regardless of the type of algorithm used (mean rank of 28.3 for algorithm A, 38.86 for algorithm B, and 31.56 for algorithm C) (z = −6.70, P < 0.001, for algorithm A; z = −3.54, P < 0.001, for algorithm B; and z = −5.96, P < 0.001, for algorithm C).
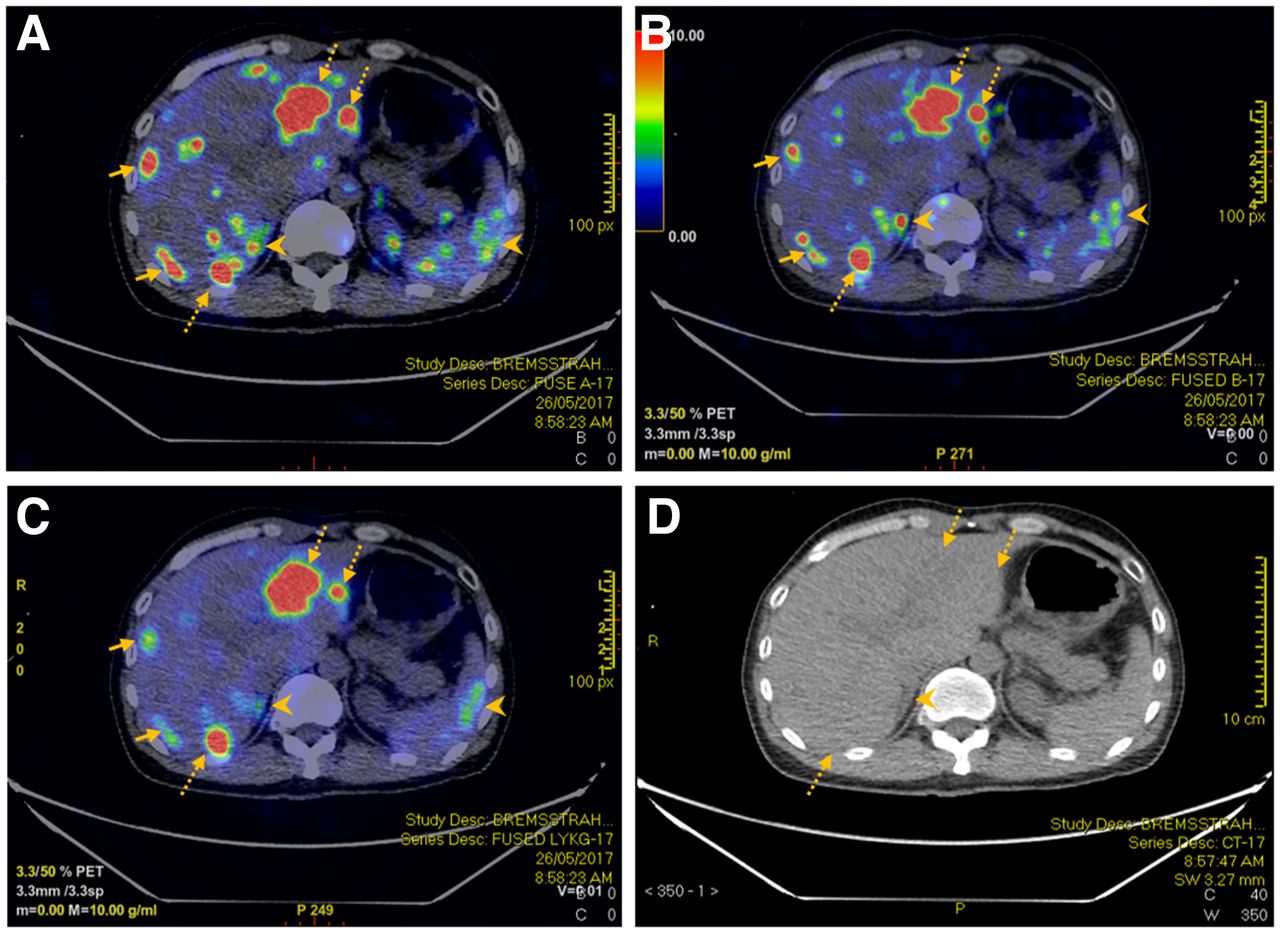
We present a case example of rectal neuroendocrine tumor metastatic to the liver (Fig. 2). The SUVmax for the dominant lesion in the left hepatic lobe was 47.7, 34.0, and 33.7 for algorithms A, B, and C, respectively, whereas the SUVmax for the dominant lesion in the right hepatic lobe was 33.9, 35.2, and 22.8 for algorithms A, B, and C, respectively. Overall, algorithm C demonstrated outstanding diagnostic yield, with an excellent signal-to-noise ratio compared with that of algorithms A and B.

A 52-y-old man with rectal neuroendocrine cancer metastatic to liver underwent 90Y-PRRT therapy. Reconstructed PET/CT using algorithms A (A), B (B), and C (C) managed to detect hepatic metastases (dotted arrows) seen on corresponding CT images (D). However, there was more visible noise within liver for PET using algorithms A and B than for PET using algorithm C (solid arrows). In addition. extrahepatic noise such as that in right adrenal gland and spleen (arrowheads) was less apparent using algorithm C. Right adrenal noise can potentially be mistaken as hepatic metastasis using algorithms A and B (arrowheads).
Confounding Factors
Results from multivariable ordered logistic regression analysis are summarized in Table 5. Age, body mass index, and type of radiotracer were found to be the confounding factors. Younger age (adjusted OR, 0.98; 95% CI, 0.95–0.997) and lower body mass index (adjusted OR, 0.90; 95% CI, 0.81–0.99) were associated with better quality assessment scores. SIRT was associated with significantly higher scores than PRRT (adjusted OR, 23.99; 95% CI, 11.87–50.35). Additionally, the multivariable model also confirmed that quality assessment scores for algorithm C were significantly higher (adjusted OR, 17.4; 95% CI, 9.16–34.15). On the multivariable model, algorithm B performed significantly worse than algorithm A (adjusted OR, 0.46; 95% CI, 0.26–0.80).
Multivariate Analysis Comparing Quality Assessment Scores
DISCUSSION
90Y is the commonly used theranostics agent for personalized patient treatment because of its excellent physical and chemical features; its optimal half-life of 64.1 h, which is both long enough to allow relative ease in shipping and short enough to achieve a critical dosing rate in tumor tissue; its high specific activity with relatively longer soft-tissue penetration (mean, 2.5 mm), which allows effective treatment with high cross-fire effect; and its being a pure β-emitter, which results in low radiation exposure to the medical staff and family members and therefore allows outpatient application.
Absence of γ-photon emission for 90Y, however, significantly limits its utility in posttherapeutic imaging and dosimetry. Bremsstrahlung imaging and PET scanning, on the other hand, are commonly used for posttherapeutic localization and dosimetry of 90Y-labeled agents.
Generation of 90Y bremsstrahlung photons from interaction between β− particles and matter allows imaging of these photons using a γ-camera (4). This imaging technique is easily available but bears the inherent drawbacks of the poor resolution of scintigraphy and, thus, poor localization of biodistribution and inaccurate dosimetry of the tumor. These drawbacks are attributed to the wide range of photon energies produced, internal photon scattering, variable count rates, low spatial resolution, difficulty with collimator selection, and overlying tissue attenuation.
Although the branching ratio for internal-pair production is small, at approximately 32 per million decays, 90Y PET/CT imaging has better spatial resolution and contrast and thus a higher detection rate than the traditionally used bremsstrahlung imaging in numerous phantoms and clinical studies (5,6). Interestingly, Kao et al. recently demonstrated the feasibility of using 90Y PET for quantitative assessment of residual activity in the delivery apparatus instead of the conventional indirect method recommended by the manufacturer (7). The inherent problem is that the low percentage of internal-pair production requires an unrealistically long acquisition time for an adequate signal-to-noise ratio. In the real world, for the patient to remain still, 30 min per bed position would be the maximum achievable imaging time. Any longer scan time is strongly discouraged, as movement by the patient will result in blurring of the image.
Various 90Y PET imaging techniques with or without TOF and resolution recovery capabilities, as well as on semiconductor-based scanners, have shown potential resolution and contrast superior to bremsstrahlung SPECT (8,9). Despite multiple in vitro and in vivo studies using various PET imaging systems, acquisition times, and reconstruction algorithms, there is no standardized imaging protocol thus far, although some manufacturers have provided technical support (10). Using our routinely applied algorithms, PET images are usually of poor quality despite increases in the acquisition time. The low signal-to-noise ratio makes tumor uptake quite often indistinguishable from background uptake.
Our team explored different reconstruction algorithms by formulating the filter dynamics for reconstruction in PET imaging. We noticed that the sharpness and resolution of the image improved with an increased number of iterations and subsets. This, however, also increases noise. Therefore, striking the right balance of signal-to-noise ratio is key to any filter algorithm. Our team subsequently pursued a sharp reduction in the number of iterations, thus resulting in considerable noise reduction. In addition, we reduced the filter cutoff to 5 mm, aiming for a more stringent signal bandwidth and an increased number of subsets to enhance sharpness. After multiple attempts to adjust the settings and fine-tune the parameters, we finally settled on the LKYG algorithm, which has a significantly lower number of iterations, a thinner filter cutoff, and a larger number of subsets than our conventional algorithm. The strength of this combination is well demonstrated by the achieved significantly improved image quality.
Our study was limited by the small cohort; hence, analysis of the confounding factors was limited. Semiquantitative scoring allows room for variation, and hence, quantitative scoring will be preferred for a more objective assessment.
CONCLUSION
Optimization of image quality by improving the reconstruction algorithms for an inherently challenging PET radionuclide with low internal-pair production allows us to confirm tumoral deposition, detect nontarget radionuclide distribution, accurately calculate posttherapeutic dosimetry, and predict treatment efficacy, thus allowing advanced, personalized care planning. Aiming to increase signal-to-noise ratio, we developed a new algorithm, LKYG, for 90Y PET image reconstruction, which features a decrease in the number of iterations, a decrease in the cutoff of filter thickness, and an increase in the number of subsets. This approach significantly enhanced image quality. This algorithm should be recommended for routine use of 90Y PET imaging if the hypothesis is further confirmed in a multicenter prospective study.
DISCLOSURE
No potential conflict of interest relevant to this article was reported.
KEY POINTS
QUESTIONS: Can the quality of 90Y PET imaging be improved by optimizing the reconstruction algorithm?
PERTINENT FINDINGS: A new 90Y PET image reconstruction algorithm that decreases the number of iterations, decreases the cutoff of the filter thickness, and increases the number of the subsets compared with the conventional reconstruction algorithm consistently achieved the highest-quality assessment score in both post-SIRT and post-PRRT 90Y PET imaging.
IMPLICATIONS FOR PATIENT CARE: The new reconstruction algorithm significantly improved the signal-to-noise ratio and therefore enhanced the diagnostic yield of 90Y PET by successfully localizing the pathologies and avoiding false-positive findings.
Footnotes
Published online Nov. 9, 2022.
REFERENCES
- Received for publication May 26, 2022.
- Revision received October 20, 2022.


