


Article Figures & Data
Tables
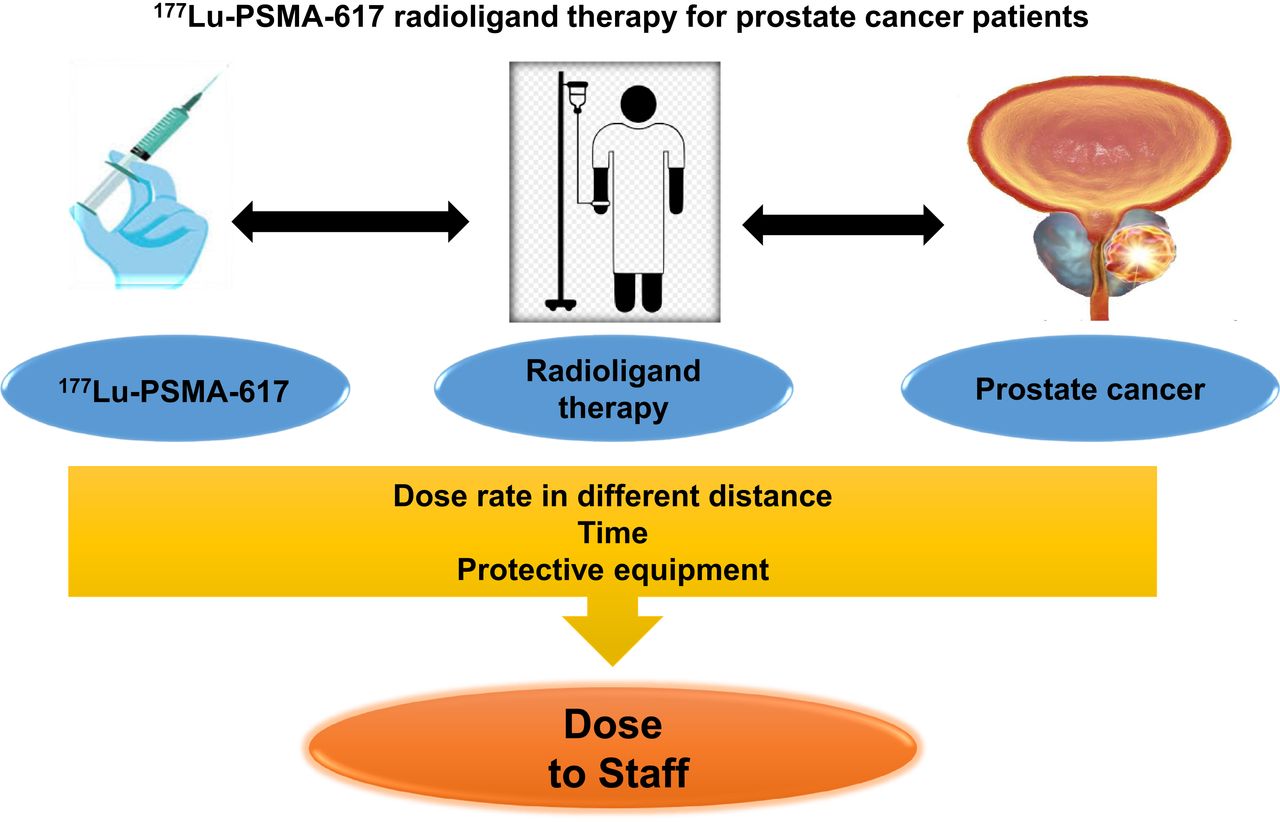
Staff Female (n) Male (n) Distance Technologist in charge of injection 4 4 0 m (injecting radiopharmaceutical) Technologist in charge of imaging 4 4 0.25 m (positioning patient);1 m (presenting information to patient) Nurse 2 2 2 m (monitoring treatment process) Physicist 2 2 2 m (providing protection guidelines) Physician 3 1 0.25 m (checking patient’s vital signs) - TABLE 2.
Mean Dose Rates (μSv/[h⋅GBq]) and Related SDs at Various Distances from Patient and Various Times
Distance (m) Time (h) 0 0.25 0.5 1 2 0 78.6 ± 5.0 (72.7–87.5) 47.5 ± 2.0 (40.0–58.0) 21.5 ± 1.2 (18.5–24.5) 7.1 ± 0.3 (5.5–8.3) 5.4 ± 0.5 (4.4–7.2) 1 70.3 ± 3.0 (63.6–78.1) 36.3 ± 3.1 (32.0–44.6) 19.1 ± 1.5 (16.8–21.3) 6.0 ± 0.5 (4.4–6.6) 3.6 ± 0.4 (2.8–4.5) 2 53.0 ± 3.4 (55.0–44.9) 32.3 ± 1.1 (24.3–34.4) 16.5 ± 1.1 (12.4–18.4) 5.1 ± 0.6 (3.4–5.5) 2.6 ± 0.3 (2.0–3.1) 3 44.5 ± 3.0 (35.7–47.3) 24.3 ± 1.2 (18.8–27.9) 12.6 ± 1.3 (7.7–14.4) 4.2 ± 0.2 (2.7–4.7) 2.3 ± 0.2 (1.6–2.7) 4 34.4 ± 1.5 (29.9–39.5) 17.2 ± 1.6 (14.6–19.7) 8.5 ± 1.7 (6.5–10.8) 3.2 ± 0.3 (2.4–3.9) 1.8 ± 0.2 (1.4–2.4) 5 24.2 ± 1.5 (19.0–27.3) 13.3 ± 0.9 (10.9–14.9) 6.1 ± 0.3 (5.5–7.6) 2.8 ± 0.2 (1.9–3.2) 1.3 ± 0.3 (0.8–1.8) 6 22.2 ± 1.3 (17.0–25.5) 11.5 ± 0.5 (8.8–14.0) 5.5 ± 0.2 (5.0–7.0) 2.2 ± 0.3 (1.2–3.0) 1.0 ± 0.5 (0.5–1.5) 18 17.5 ± 1.1 (15.2–20.4) 10.5 ± 0.7 (7.9–11.9) 5.0 ± 0.4 (3.7–5.9) 1.4 ± 0.3 (0.9–1.7) 0.8 ± 0.2 (0.3–1.0) 24 13.5 ± 1.3 (12.4–16.2) 6.5 ± 1.1 (5.9–8.0) 3.1 ± 0.2 (2.9–3.5) 1.0 ± 0.04 (0.5–1.4) 0.5 ± 0.02 (0.3–0.8) 36 10.0 ± 1.1 (8.4–13.3) 4.5 ± 1.0 (3.8–6.0) 2.3 ± 0.3 (1.8–3.0) 0.6 ± 0.03 (0.3–1.0) 0.3 ± 0.03 (0.1–0.8) Data are mean ± SD.
Without lead shield With lead shield Staff Minimum per patient (μSv) Maximum per patient (μSv) Mean ± SD Minimum per patient (μSv) Maximum per patient (μSv) Mean ± SD P Technologist in charge of injection 6.5 8.6 7.6 ± 1.1 4.0 5.2 4.8 ± 0.9 ≤0.05 Technologist in charge of imaging 3.7 5.0 4.0 ± 0.5 2.1 3.0 2.4 ± 0.3 ≤0.05 Physician 3.0 3.6 3.3 ± 0.3 1.6 2.1 1.8 ± 0.4 <0.05 Physicist 3.2 4.2 3.5 ± 0.5 1.7 2.5 2.2 ± 0.3 <0.05 Nurse 7.4 9.2 8.1 ± 0.8 4.2 5.7 5.2 ± 0.3 ≤0.05 Staff With lead shield (mSv) Without lead shield (mSv) Technologist in charge of injection 2.2 3.4 Technologist in charge of imaging 1.5 2.6 Physician 1.0 1.8 Physicist 1.2 2.1 Nurse 2.3 3.8 Staff Maximum (mSv) Minimum (mSv) Mean without lead shield (mSv) Technologist in charge of injection 4.9 3.6 4.6 Technologist in charge of imaging 3.5 2.4 3.1 Physician 1.8 1.3 1.6 Physicist 2.2 1.6 1.9 Nurse 4.8 3.8 4.3 - TABLE 6.
Comparison of Mean Dose (μSv per patient) from Current Study and from Another International Study
Staff Demire et al. (7) Current study without lead shield Current study with lead shield Radiopharmacist 4.0 7.6 ± 1.1 4.8 ± 0.9 Physicist 2.0 4.0 ± 0.5 2.4 ± 0.3 Physician 2.0 3.3 ± 0.3 1.8 ± 0.4 Technologist 3.0 3.5 ± 0.5 2.2 ± 0.3 Nurse 6.0 8.1 ± 0.8 5.2 ± 0.3 ± SD is also shown for current study.
In this issue


Jump to section
Related Articles
Cited By...
- No citing articles found.