
Main menu

  • Home
  • Content
    • Current
      • JNMT Supplement
    • Ahead of print
    • Past Issues
    • Continuing Education
    • JNMT Podcast
    • SNMMI Annual Meeting Abstracts
  • Subscriptions
    • Subscribers
    • Rates
    • Journal Claims
    • Institutional and Non-member
  • Authors
    • Submit to JNMT
    • Information for Authors
    • Assignment of Copyright
    • AQARA Requirements
  • Info
    • Reviewers
    • Permissions
    • Advertisers
    • Corporate & Special Sales
  • About
    • About Us
    • Editorial Board
    • Contact Information
  • More
    • Alerts
    • Feedback
    • Help
    • SNMMI Journals
  • SNMMI
    • JNMT
    • JNM
    • SNMMI Journals
    • SNMMI

User menu

  • Subscribe
  • My alerts
  • Log in
  • My Cart

Search

  • Advanced search
Journal of Nuclear Medicine Technology
  • SNMMI
    • JNMT
    • JNM
    • SNMMI Journals
    • SNMMI
  • Subscribe
  • My alerts
  • Log in
  • My Cart
Journal of Nuclear Medicine Technology

Advanced Search

  • Home
  • Content
    • Current
    • Ahead of print
    • Past Issues
    • Continuing Education
    • JNMT Podcast
    • SNMMI Annual Meeting Abstracts
  • Subscriptions
    • Subscribers
    • Rates
    • Journal Claims
    • Institutional and Non-member
  • Authors
    • Submit to JNMT
    • Information for Authors
    • Assignment of Copyright
    • AQARA Requirements
  • Info
    • Reviewers
    • Permissions
    • Advertisers
    • Corporate & Special Sales
  • About
    • About Us
    • Editorial Board
    • Contact Information
  • More
    • Alerts
    • Feedback
    • Help
    • SNMMI Journals
  • Watch or Listen to JNMT Podcast
  • Visit SNMMI on Facebook
  • Join SNMMI on LinkedIn
  • Follow SNMMI on Twitter
  • Subscribe to JNMT RSS feeds
Research ArticleImaging

Legendre Polynomials: A Fully Automatic Method for Noise Reduction in 99mTc-Mercaptoacetyltriglycine Renogram Analysis

Michel Destine and Alain Seret
Journal of Nuclear Medicine Technology December 2020, 48 (4) 346-353; DOI: https://doi.org/10.2967/jnmt.120.244574
Michel Destine
1Nuclear Medicine Department, Sainte Elisabeth Hospital, CHU UCL Namur, Namur, Belgium; and
  • Find this author on Google Scholar
  • Find this author on PubMed
  • Search for this author on this site
Alain Seret
2GIGA-CRC (In Vivo Imaging), University of Liège, Liège, Belgium
  • Find this author on Google Scholar
  • Find this author on PubMed
  • Search for this author on this site
  • Article
  • Figures & Data
  • Info & Metrics
  • PDF
Loading

Article Figures & Data

Figures

  • Tables
  • FIGURE 1.
    • Download figure
    • Open in new tab
    • Download powerpoint
    FIGURE 1.

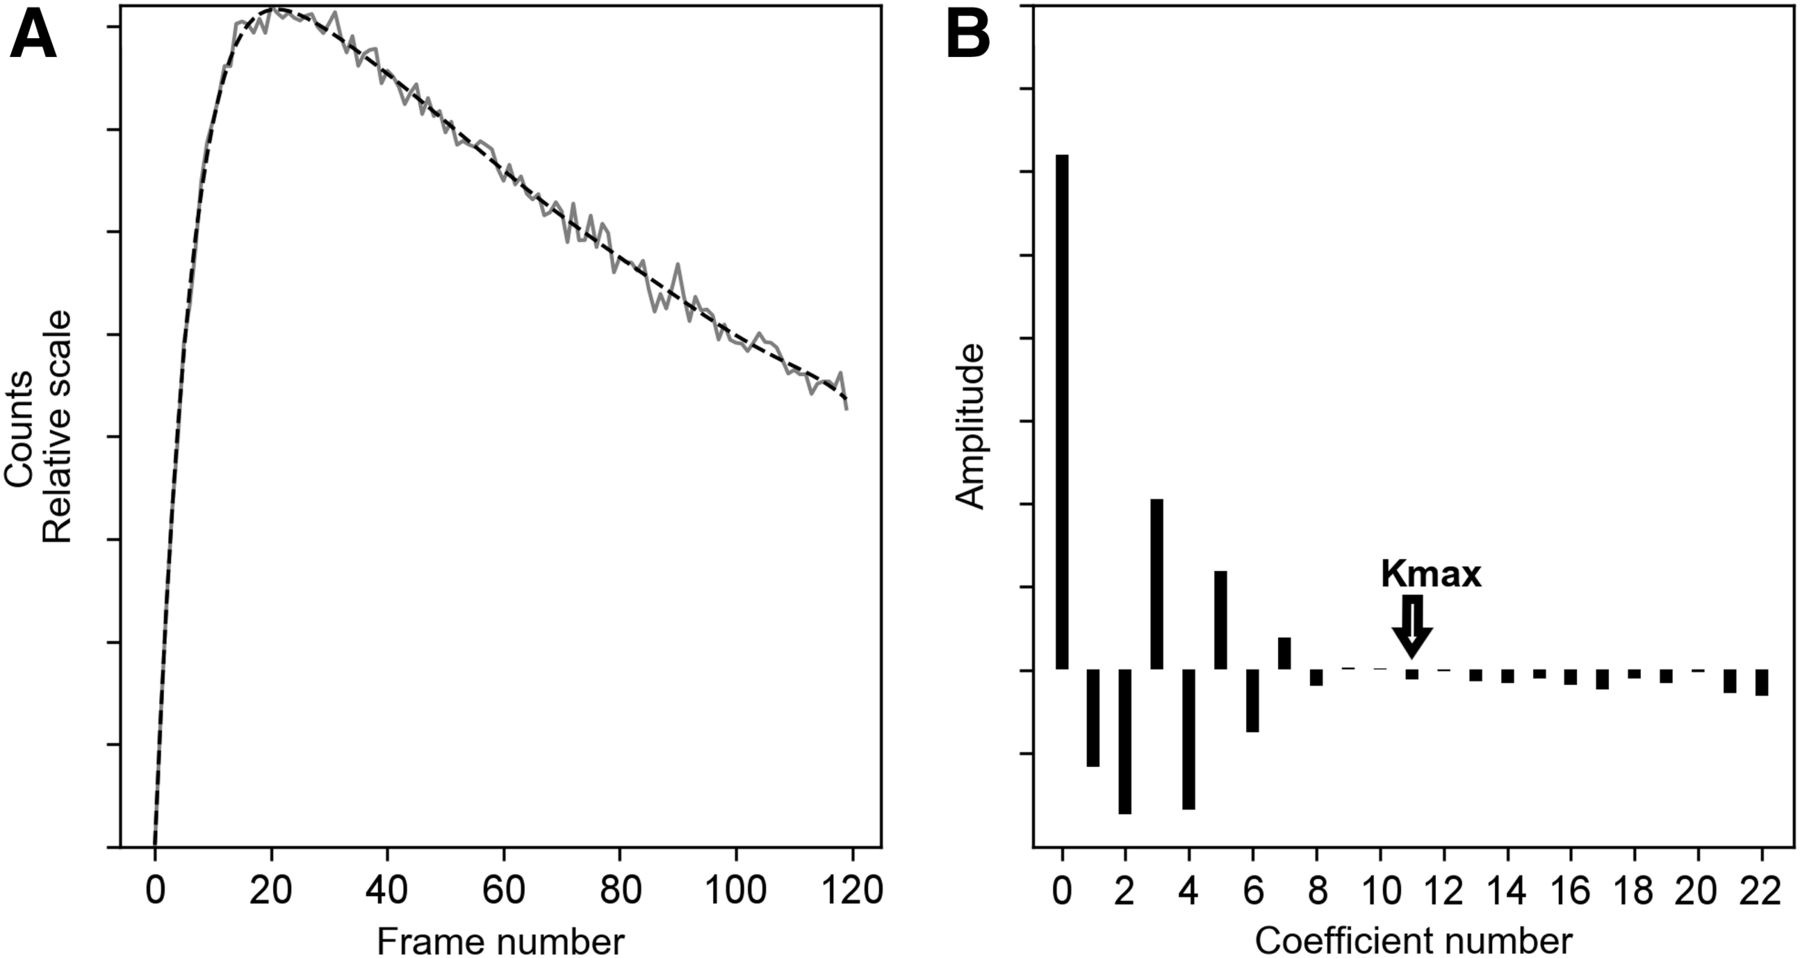
    (A) Noisy simulated curve (solid) and associated Legendre transform (dashed). (B) Values of 23 first Legendre coefficients obtained using Equation 3 and corresponding kmax.

  • FIGURE 2.
    • Download figure
    • Open in new tab
    • Download powerpoint
    FIGURE 2.

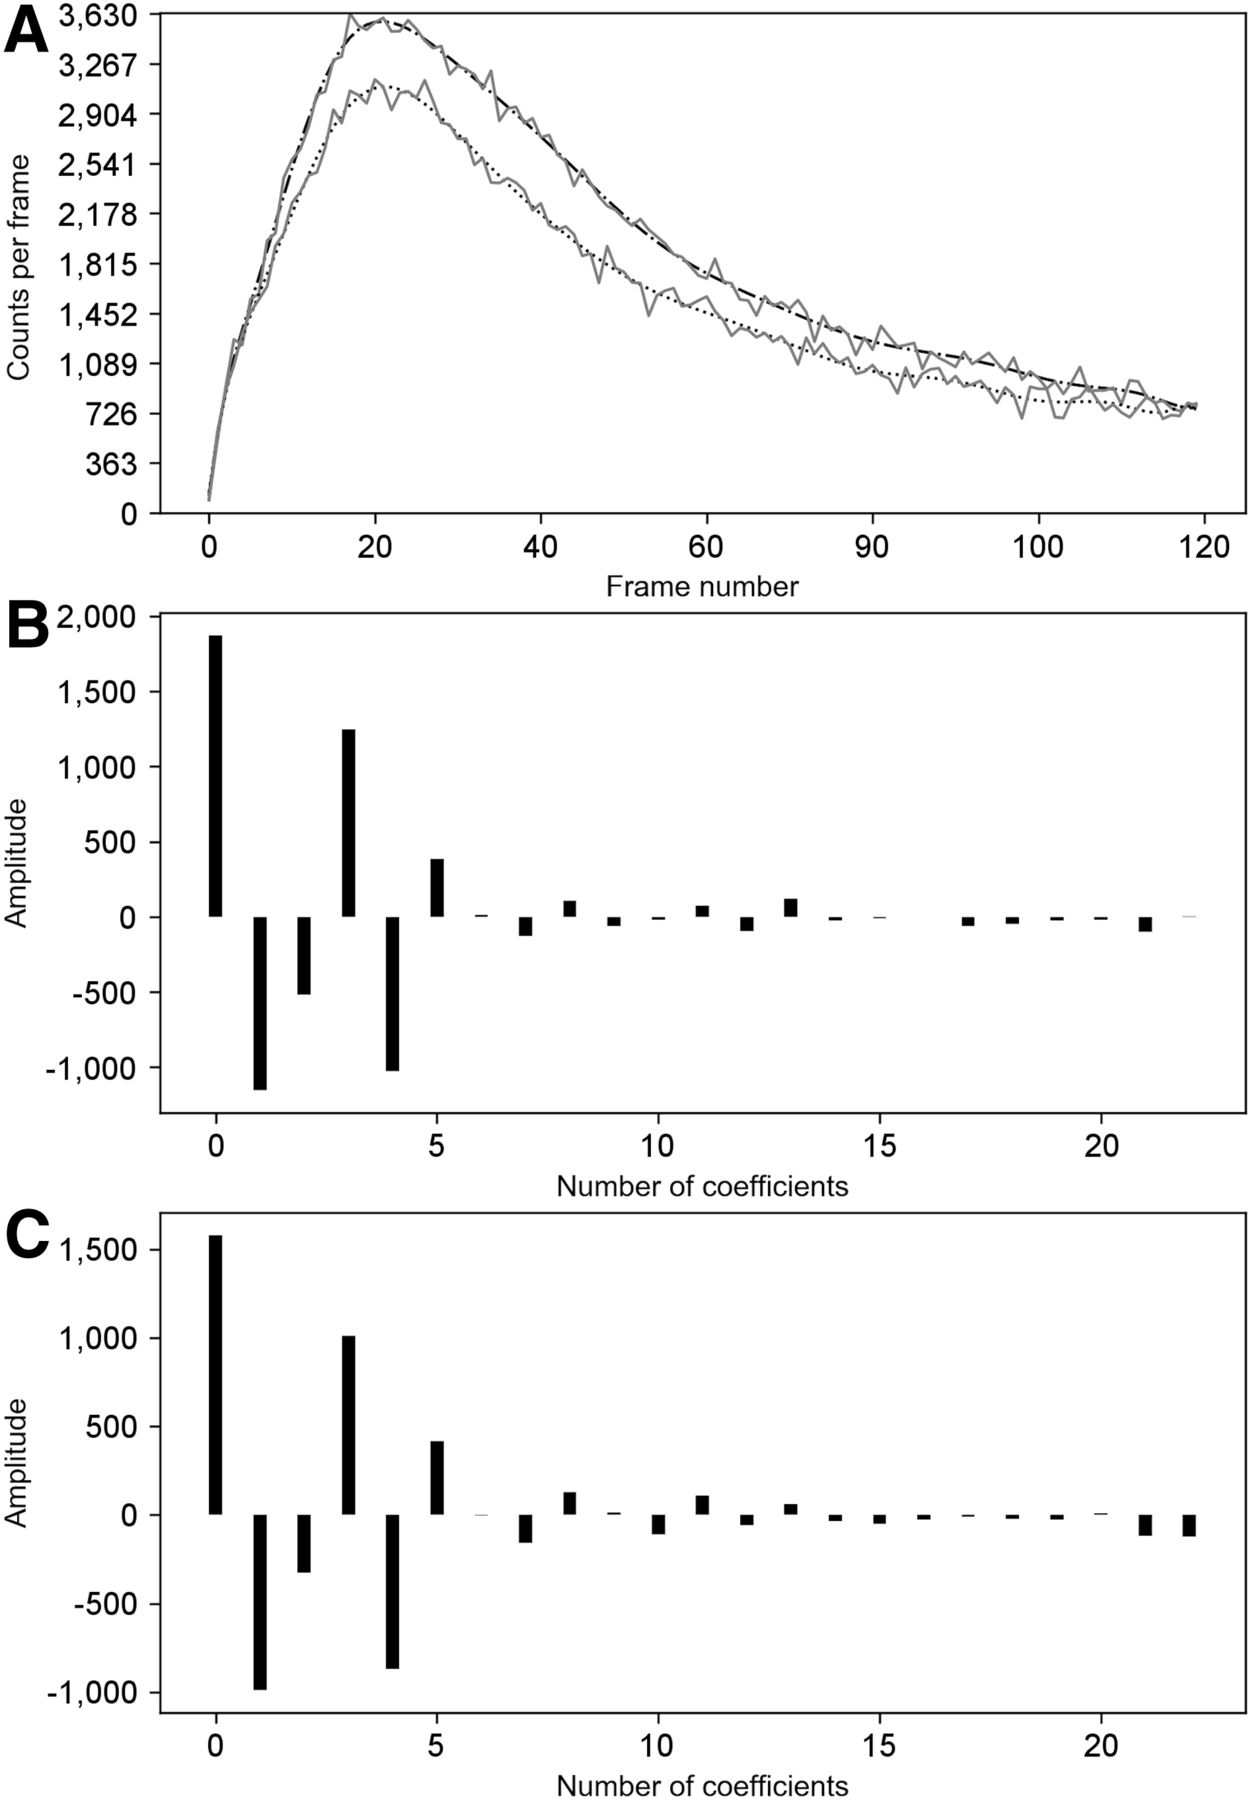
    (A) Raw MC data curves (solid) with corresponding denoised signal by FLT (dashed and dotted). Top curve is left kidney; bottom curve is right kidney. (B) Spectrum of first Legendre coefficients for left kidney in A. (C) Spectrum of first Legendre coefficients for right kidney in A. B and C have same kmax (coefficient number, 16).

  • FIGURE 3.
    • Download figure
    • Open in new tab
    • Download powerpoint
    FIGURE 3.

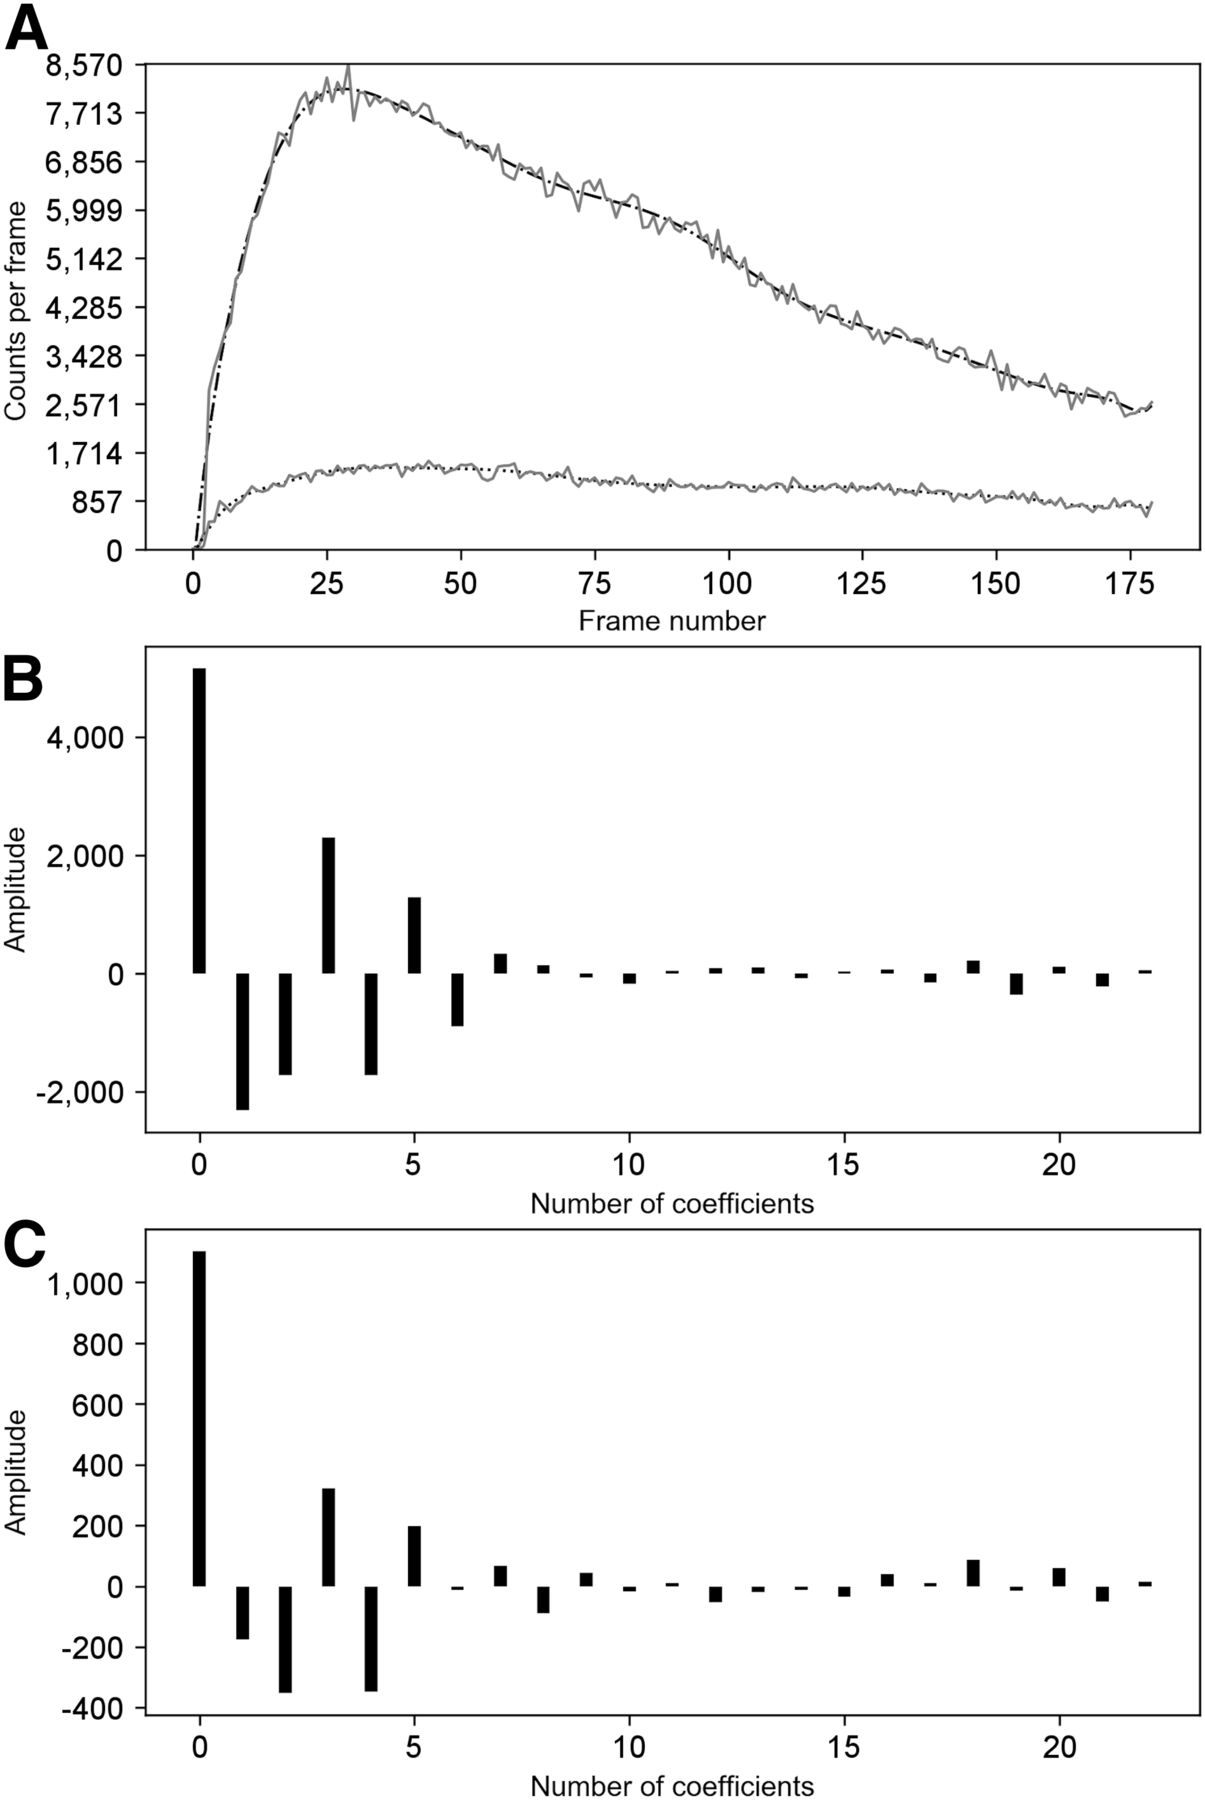
    (A) Raw patient data curves (solid) with corresponding denoised signal by FLT (dashed and dotted). Top curve is left kidney; bottom curve is right kidney. (B) Spectrum of first Legendre coefficients for left kidney in A. (C) Spectrum of first Legendre coefficients for right kidney in A. In this case, kmax slightly differed between the 2 kidneys: 11 for left and 12 for right.
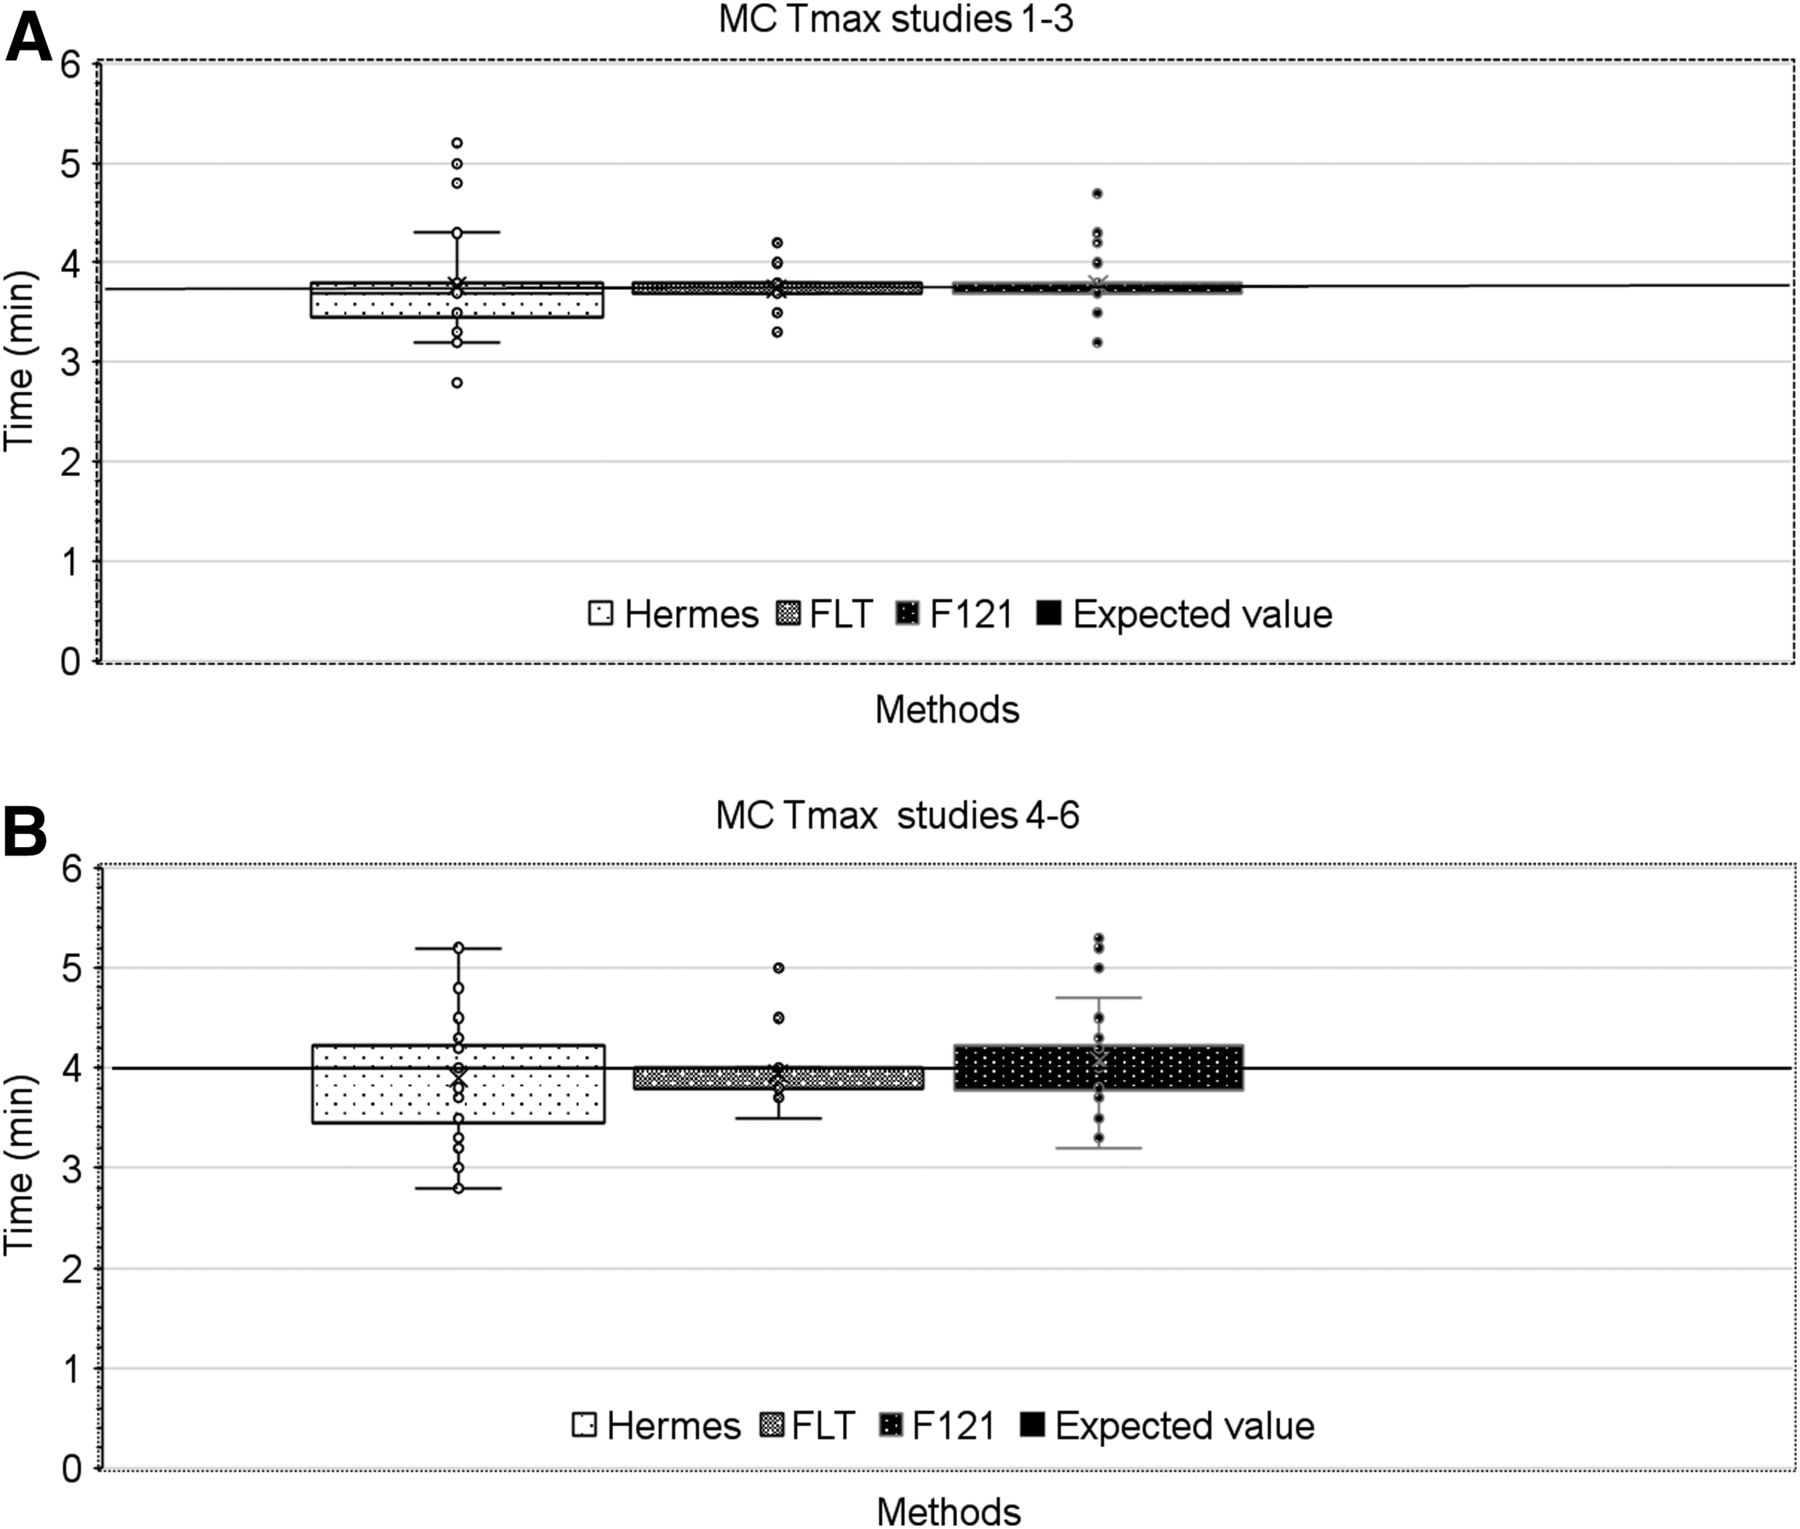
  • FIGURE 4.
    • Download figure
    • Open in new tab
    • Download powerpoint
    FIGURE 4.

    Box plot of Tmax obtained by 3 methods for left and right kidneys in MC simulations, showing clearance of 260 (A) and 130 (B) mL/min. Horizontal black lines represent expected (true) values given in Table 1.
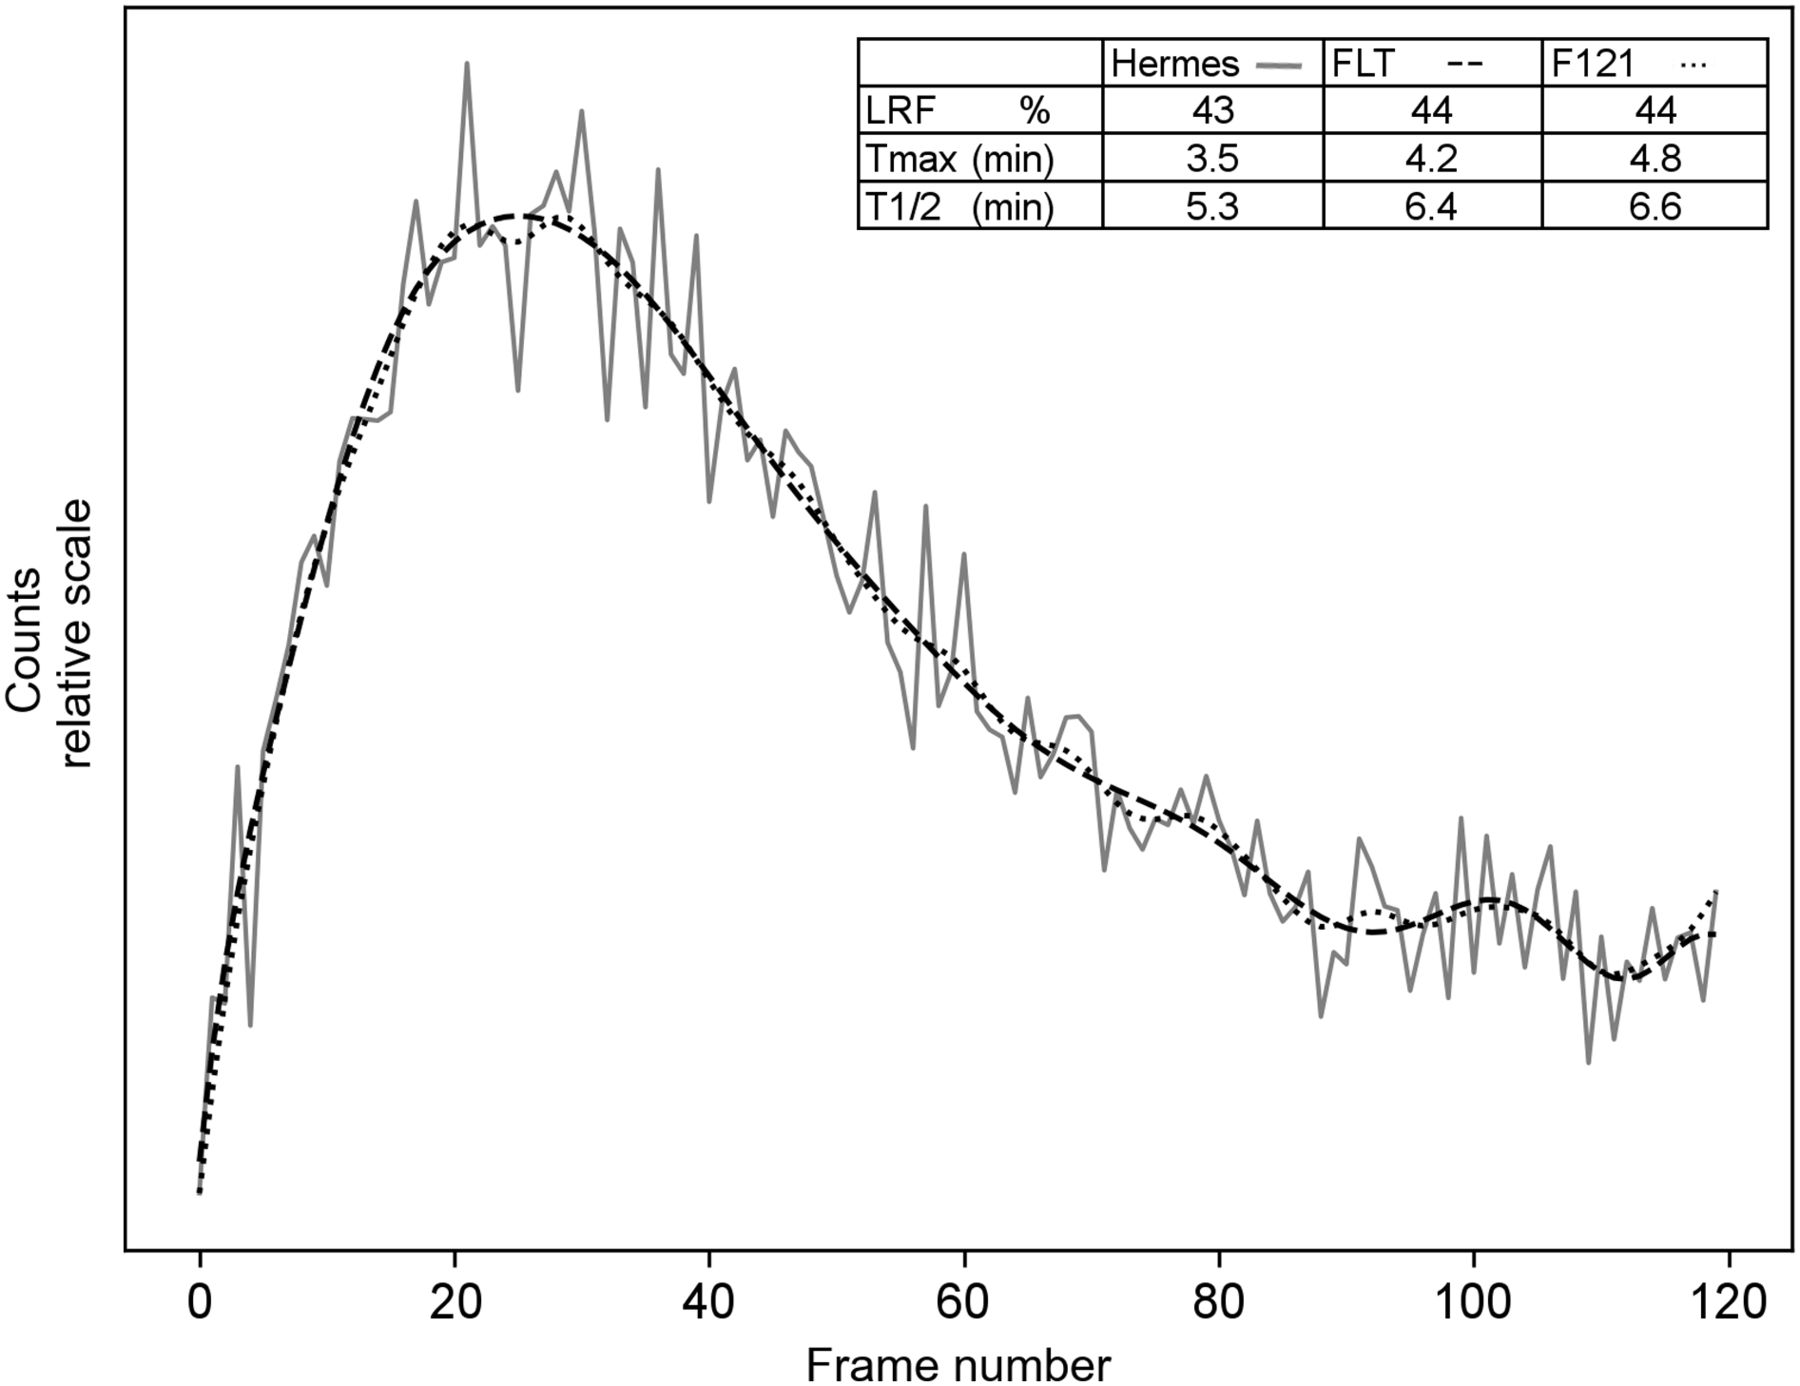
  • FIGURE 5.
    • Download figure
    • Open in new tab
    • Download powerpoint
    FIGURE 5.

    Fitted time–activity curve obtained with FLT (dashed) or F121 and optimum number of passes (dotted) of raw time–activity curve (solid) and computed kinetic parameters for each method.

  • FIGURE 6.
    • Download figure
    • Open in new tab
    • Download powerpoint
    FIGURE 6.

    Bland–Altman plot of agreement between Tmax obtained by FLT and F121 for left (A) and right (B) kidneys in patients.

Tables

  • Figures
    • View popup
    TABLE 1

    MC Study Characteristics

    StudyLRF (%)Tmax for both kidneys (min)T1/2 LK (min)T1/2 RK (min)Clearance (mL/min)
    150
    2203.76.66.2260
    370
    450
    5204.09.89.2130
    670
    • Each study contains 5 series with 1 posterior RS and 2 posterior and anterior studies with 100 and 50 MBq, respectively, of injected activity. Time values were obtained from RS.

    • View popup
    TABLE 2

    Results for 12 Simulations of RMS Error Between RS and RS with Poisson Noise Added for Different Processing Methods

    Processing methodMeanSD
    None57.8*14.3
    FLT18.13.6
    F121, 2 passes32.8*5.7
    F121, 4 passes34.6*4.0
    F121, 6 passes39.0*4.2
    F121, 8 passes43.6*4.7
    • ↵* Statistically different from FLT (P < 0.0001).

    • Data are for 6 methods and 2 kidneys. Number of coefficients for FLT was automatically determined, and number of F121 passes was varied from 2 to 8.

    • View popup
    TABLE 3

    Summary Statistics of Linear Regression on MC Data for LRF

    ParameterSlopeR2Intercept (%)
    Hermes − FLT0.9750.9961.317
    Hermes − F1210.9660.9961.753
    FLT − F1210.9900.9990.495
    • View popup
    TABLE 4

    Statistical Analysis for MC Data

    Mean (min)SD (min)MSEHermes/FLTHermes/F121F121/FLT
    StudyE (min)HermesFLTF121HermesFLTF121HermesFLTF121FPFPFP
    Tmax 1–33.73.773.743.780.590.190.280.340.040.0810.13<0.001*4.55<0.001*2.230.017*
    Tmax 4–64.03.93.954.080.600.290.500.360.080.244.34<0.001*1.480.152.930.002*
    T1/2 LK 1–36.64.966.496.391.720.300.425.470.100.2132.62<0.001*16.87<0.001*1.930.11
    T1/2 RK 1–36.25.446.216.290.820.210.251.200.040.0715.15<0.001*10.66<0.001*1.420.25
    T1/2 LK 4–69.86.349.379.272.970.811.2820.220.801.8213.35<0.001*5.350.002*2.490.05
    T1/2 RK 4–69.27.039.39.181.750.620.897.540.370.757.83<0.001*3.830.008*2.040.10
    • ↵* Statistically significant under Holm–Bonferroni adjustment for multiple comparisons.

    • E = expected value from Table 1; MSE = mean squared error (Embedded Image/N).

    • Mean, SD, and MSE are from expected value for studies 1–3 with clearance of 260 mL/min and studies 4–6 with clearance of 130 mL/min. Hermes/FLT, Hermes/F121, and F121/FLT are ratio of variance obtained with F test and associated P value. LK = left kidney; RK = right kidney.

    • View popup
    TABLE 5

    Bias and SD Obtained from Bland–Altman Analysis of Different Parameters for Each Pairwise Method Comparison on Patient Data

    BiasSD
    ParameterHermes − FLTHermes − F121FLT − F121Hermes − FLTHermes − F121FLT − F121
    LRF (%)0.0250.150.1251.481.540.72
    Tmax LK−0.62−0.46−0.151.891.850.39
    Tmax RK0.240.22−0.021.91.790.35
    T1/2 LK−4.09−3.90.234.734.720.54
    T1/2 RK−2.82−2.060.13.773.110.65
    • LK = left kidney; RK = right kidney.

PreviousNext
Back to top

In this issue

Journal of Nuclear Medicine Technology: 48 (4)
Journal of Nuclear Medicine Technology
Vol. 48, Issue 4
December 1, 2020
  • Table of Contents
  • About the Cover
  • Index by author
Print
Download PDF
Article Alerts
Sign In to Email Alerts with your Email Address
Email Article

Thank you for your interest in spreading the word on Journal of Nuclear Medicine Technology.

NOTE: We only request your email address so that the person you are recommending the page to knows that you wanted them to see it, and that it is not junk mail. We do not capture any email address.

Enter multiple addresses on separate lines or separate them with commas.
Legendre Polynomials: A Fully Automatic Method for Noise Reduction in 99mTc-Mercaptoacetyltriglycine Renogram Analysis
(Your Name) has sent you a message from Journal of Nuclear Medicine Technology
(Your Name) thought you would like to see the Journal of Nuclear Medicine Technology web site.
Citation Tools
Legendre Polynomials: A Fully Automatic Method for Noise Reduction in 99mTc-Mercaptoacetyltriglycine Renogram Analysis
Michel Destine, Alain Seret
Journal of Nuclear Medicine Technology Dec 2020, 48 (4) 346-353; DOI: 10.2967/jnmt.120.244574

Citation Manager Formats

  • BibTeX
  • Bookends
  • EasyBib
  • EndNote (tagged)
  • EndNote 8 (xml)
  • Medlars
  • Mendeley
  • Papers
  • RefWorks Tagged
  • Ref Manager
  • RIS
  • Zotero
Share
Legendre Polynomials: A Fully Automatic Method for Noise Reduction in 99mTc-Mercaptoacetyltriglycine Renogram Analysis
Michel Destine, Alain Seret
Journal of Nuclear Medicine Technology Dec 2020, 48 (4) 346-353; DOI: 10.2967/jnmt.120.244574
Twitter logo Facebook logo LinkedIn logo Mendeley logo
  • Tweet Widget
  • Facebook Like
  • Google Plus One
Bookmark this article

Jump to section

  • Article
    • Abstract
    • MATERIALS AND METHODS
    • RESULTS
    • DISCUSSION
    • CONCLUSION
    • DISCLOSURE
    • Footnotes
    • REFERENCES
  • Figures & Data
  • Info & Metrics
  • PDF

Related Articles

  • No related articles found.
  • PubMed
  • Google Scholar

Cited By...

  • No citing articles found.
  • Google Scholar

More in this TOC Section

  • Single- Versus Dual-Time-Point Imaging for Transthyretin Cardiac Amyloid Using 99mTc-Pyrophosphate
  • Does Arthrography Improve Accuracy of SPECT/CT for Diagnosis of Aseptic Loosening in Patients with Painful Knee Arthroplasty: A Systematic Review and Metaanalysis
  • Software Discrepancies in Radionuclide-Derived Left Ventricular Ejection Fraction
Show more Imaging

Similar Articles

Keywords

  • MAG3
  • Legendre polynomials
  • renal function
  • denoising
  • renogram
SNMMI

© 2025 SNMMI

Powered by HighWire