


Abstract
Quantification tools for SPECT/CT are a field of ongoing research among hybrid imaging techniques. A recent multicenter study evaluating SUV SPECT software on phantoms showed that quantitative SPECT/CT is reproducible in Hybrid Viewer software. The aim of our study was to evaluate the intra- and interobserver agreement of quantitative SUV SPECT measurements in clinical settings for patients with solid renal tumors. Methods: The evaluation was part of a study that examined the role of 99mTc-sestamibi SPECT/CT in the characterization of solid kidney tumors and the differentiation of renal oncocytomas from renal cell carcinomas. Quantitative evaluation of SUV measurements was performed in Hybrid Viewer PDR, version 2.5. Forty-eight renal lesions were identified and examined twice by 2 independent readers. The agreement of the SUV measurements, concerning renal tumors and adjacent renal parenchyma, was evaluated using the intraclass correlation coefficient (ICC). Results: ICC for SUVmax measurements by the same reader was 97%–99% for solid renal tumors and 92%–98% for ipsilateral healthy renal parenchyma. ICC for SUVmax measurements between readers was 87%–89% for solid renal tumors and 72%–73% for ipsilateral healthy renal parenchyma. Estimated ICC for SUVmean measurements of solid renal tumors was 95%–98% for the same reader and 86%–89% between readers. Similar results were found for SUVpeak measurements. Conclusion: The high ICCs indicate a strong agreement among SUV measurements for patients with solid renal lesions undergoing 99mTc-sestamibi SPECT/CT, not only for measurements by the same reader but also for measurements between 2 different readers.
For many years, SPECT was undervalued in comparison to PET (1), not only because of the higher spatial resolution and sensitivity of PET but also because PET/CT was enabling quantification of tissue radioactivity concentrations (2). However, quantitative SPECT/CT is used routinely in some applications, such as targeted radionuclide therapy imaging (3). The demand for quantitative SPECT for diagnostic purposes is an old one (4). The introduction of SPECT/CT cameras and continued reduction of the absorbed dose from the CT component of this hybrid imaging method have revived interest in quantitative SPECT (5). This hybrid imaging technique is increasing the diagnostic accuracy of various nuclear medicine examinations in daily clinical practice (6). The introduction of new reconstruction methods with proper modeling of photon attenuation, scatter, and collimator resolution degradation has resulted in better image quality and improved quantification. Quantification with SPECT/CT is especially of interest when the use of longer–half-life radionuclides not available in PET/CT is required (7).
Recently, a commercial software product called SUV SPECT (Hermes Medical Solutions) was developed and tested in a multicenter study on phantoms (8). The study showed that quantitative SPECT is reproducible in this setting. On that basis, our institution conducted the MIDOR study (molecular imaging in differentiation of renal oncocytomas from renal cell carcinoma [RCC] by means of 99mTc-sestamibi SPECT/CT) on patients (9). 99mTc-sestamibi acts as a mitochondria-imaging agent that can trace possible renal oncocytomas, since such benign solid kidney tumors contain an increased number of mitochondria. The visual evaluation was of high diagnostic yield, with 11 of 12 correctly identified renal oncocytomas showing 99mTc-sestamibi uptake. However, the presence of false-positive results, namely RCC exhibiting 99mTc-sestamibi uptake, forced our group to explore whether quantitative tools could contribute to a more accurate characterization of the solid renal masses.
The MIDOR study is a part of a strategic innovation program founded by the Swedish Government that supports collaboration within academia, industry, and health care. Participation in this program gave our group access to SUV SPECT software designed for quantification of SPECT/CT studies. Other published studies using the SUV SPECT software demonstrated prominent results supporting its quantitative role for an accurate diagnostic approach in the evaluation of myocardial viability, in the absolute quantification of lumbar herniation, and in the evaluation of therapy response in prostate cancer patients with bone metastasis (10–13).
The aim of our present study was to evaluate the intra- and interobserver agreement of quantitative SUV SPECT measurements in clinical settings for patients with solid renal tumors undergoing 99mTc-sestamibi SPECT/CT. This is the first paper from our group that evaluates the consistency of SUV SPECT measurements in patients with primary solid kidney tumors.
MATERIALS AND METHODS
The Regional Ethical Review Board and the local Radiation Safety Committee approved the MIDOR study (diarienummer 2015/923-31/4). Written informed consent was acquired from all patients who participated in our study.
Forty-one patients with 48 solid renal tumors were included in this evaluation between September 2015 and May 2017. Before any invasive procedures (renal biopsy or surgical excision), all study participants underwent 99mTc-sestamibi SPECT/CT. Patients were injected intravenously with 925 ± 25 MBq of 99mTc-sestamibi (produced by the National Centre for Nuclear Research, Poland; distributed by S. Ahlén Medical Nordic AB). SPECT/CT imaging was performed 60–90 min after the injection using a dual-head SPECT/CT device (Symbia T16; Siemens) equipped with low-energy high-resolution collimators.
SPECT imaging was performed using a 128 × 128 pixel matrix (zoom factor, 1) and 32 projections per detector head. Each projection was acquired for 40 s. Directly after the SPECT acquisition, CT was performed using 130-kV tube voltage, a 5-mm slice width, and the automatic exposure control CARE Dose4D activated to provide proper tube current modulation, with a quality reference milliampere-second setting of 10. The projections were reconstructed using the SUV SPECT Hybrid Recon Oncology software (version 1.2; Hermes). The iterative ordered-subsets expectation-maximization algorithm (6 iterations, 16 subsets) was used, applying corrections for scatter, attenuation, and collimator resolution followed by postfiltration using a gaussian 3-dimensional filter (8 mm in full width at half maximum).
To enable quantitative evaluation, information about syringe activity, residual activity in the syringe, patient weight, time points of injection, and scan start time was specified in the reconstruction software. A calibration factor for the SPECT system was determined beforehand with a known amount of 99mTc in a cylindric phantom, which enabled conversion from pixel count rates to activity concentration and SUV normalized to patient body weight (decay-corrected tissue concentration [kBq/mL] divided by the dose injected per body weight [kBq/g]) (14).
Forty-eight solid renal lesions (6 chromophobe RCCs, 9 papillary RCCs, 12 clear RCCs, 12 oncocytomas, 3 hybrid oncocytic chromophobe renal tumors, 1 lymphoma, 1 metanephric adenoma, 1 angiomyolipoma, 1 chromophobe-papillary RCC, and 2 clear-papillary RCCs) were identified on the multiphase CT or MRI scans that patients had previously undergone for diagnostic purposes and detailed anatomic mapping. All images (diagnostic CT or MRI and the 99mTc-sestamibi SPECT/CT) were evaluated twice by 2 independent readers, and measurements were performed within a 1-wk interval in Hybrid Viewer PDR (version 2.5; Hermes) (Fig. 1).

Female patient with 15-mm solid neoplasm (arrows) on lateral aspect of left kidney. Scintigraphy coronal view (left) demonstrates absence of 99mTc-sestamibi in place of renal tumor. Directly after SPECT acquisition, CT scan (right) was performed for anatomic correlation. Middle panel is fused coronal SPECT/CT image. Renal tumor was diagnosed as clear cell carcinoma on histopathologic grounds.
The 2 readers had different professional backgrounds. One of the readers was a specialist in nuclear medicine dealing with scintigraphy studies in everyday clinical practice. The other reader was a consultant radiologist with experience in oncologic imaging. SUV measurements were performed on the solid renal tumors and the adjacent healthy renal parenchyma. The 2 readers drew regions of interest (ROIs) freehand at the site of the renal tumor on the axial fused SPECT/CT images, often guided by the diagnostic CT or MRI that each patient underwent previously for tumor staging. Freehand ROIs were also obtained from the ipsilateral healthy kidney parenchyma on the axial fused SPECT/CT images. The software could then generate volumes of interest based on the manually drawn ROIs. The 2 readers drew the ROIs for the tumors and the healthy tissues independently. No minimum or maximum number of ROIs was proposed. Additionally, the readers freely selected the regions of healthy renal parenchyma to be measured. At least 4 ROIs were obtained from the examined renal tumors and ipsilateral healthy kidney parenchyma. The software then extracted SUVmax, SUVmean, and SUVpeak for renal tumors and healthy renal parenchyma, according to the definitions given by Wahl et al. (15).
The level of agreement among the measurements was evaluated using the intraclass correlation coefficient (ICC) (16). To estimate ICC, a 2-way random single-measurement absolute-agreement approach was used. The purpose of the ICC was to estimate the amount of variability due to measurement uncertainty relative to the total variability in the samples. The estimate was given with a 95% confidence interval. ICC ranges from 0% to 100%, where absolute agreement between readers is 100%. The values of ICC depend heavily on the heterogeneity of the study population and the field of research; hence, there is little consensus in the statistical community on definite cutoffs for ICC or even on what is considered strong agreement.
The appearance, location, size, 99mTc-sestamibi uptake intensity, and nature (benign or malignant) of the kidney tumors were highly variable. These tumor features were not examined or correlated with the SUV measurements since this study examined only the level of agreement (high or low) among the different SUV SPECT measurements.
RESULTS
Figure 2 demonstrates in a purely descriptive way the individual values of SUVmax for the solid renal tumors and the healthy renal parenchyma measured twice by the 2 readers.

(A) All individual SUVmax measurements in solid renal tumors for both readers. (B) All individual SUVmax measurements in ipsilateral renal parenchyma. T = renal tumor; N = healthy renal parenchyma.
Subsequent statistical analysis showed the same tendencies of agreement among different measurements as are presented descriptively in Figure 2. Tables 1 and 2 summarize the ICCs and their upper and lower margins derived from SUV SPECT measurements performed by the 2 readers on solid renal tumors and adjacent healthy renal parenchyma.
ICCs for SUVmean, SUVmax, and SUVpeak for Repeated Measurements by Same Reader
ICCs for SUVmean, SUVmax, and SUVpeak for Repeated Measurements Between Readers
As Table 1 shows, ICC for SUVmean measurements of solid renal tumors by the same reader varied between 95% and 98%. ICC for SUVmean measurements of ipsilateral healthy renal parenchyma by the same reader varied between 93% and 98%. Table 2 shows that ICC between readers for SUVmean measurements of solid renal tumors varied between 86% and 89%. ICC for SUVmean measurements of ipsilateral healthy renal parenchyma between readers was 73%. In the same tables, ICCs for SUVpeak and SUVmax by the same reader and between readers are listed.
DISCUSSION
Regarding SUV SPECT measurements of renal tumors between readers, the estimated ICCs of 85%–90% indicate that 85%–90% of the observed variability was due to actual variability among the solid renal tumors and only 10%–15% was due to variability between readers’ measurements. This is considered high in many fields of research, although more information within this specific field would be needed for comparison.
SPECT/CT with 99mTc-sestamibi has been used for diagnosis of renal oncocytomas by another research group, from John Hopkins Hospital, under the guidance of Steven P. Rowe and Michael A. Gorin. This group developed its own quantitative SPECT/CT (QSPECT) reconstruction models for quantification. In their evaluations, any ICC above 80% was considered a good correlation (17). Our group also agrees that a 10%–15% measurement error is acceptable in everyday clinical practice (18). The ICCs for the same reader concerning SUV SPECT measurements of the kidney lesions were even higher, with values around 97%.
Apart from the well-known intrinsic limitations of SPECT/CT imaging (1–4), further limitations were observed in this study. The different backgrounds of the readers can affect how easily the renal tumor is detected on the CT or the MRI scan and subsequently how the ROIs are drawn on the fused SPECT/CT images. The reader participating in this study with the radiologic profile generated more consistent measurements.
Since some of the examined renal tumors were very small, difficulties in obtaining SUVpeak were often encountered. By definition, SUVpeak represents the maximum activity concentration in a 1-cm3 volume of a larger volume of interest drawn. This explains the difficulties in measuring SUVpeak in tumors smaller than 15 mm. The readers had to be precise when drawing ROIs on those small lesions, to include the whole tumor mass in the measurement. The last-mentioned difficulty did not seem to affect the ICCs compared with those of SUVmean or SUVmax measurements. ICCs for SUVpeak between readers were actually higher than ICCs for SUVmean or SUVmax measurements.
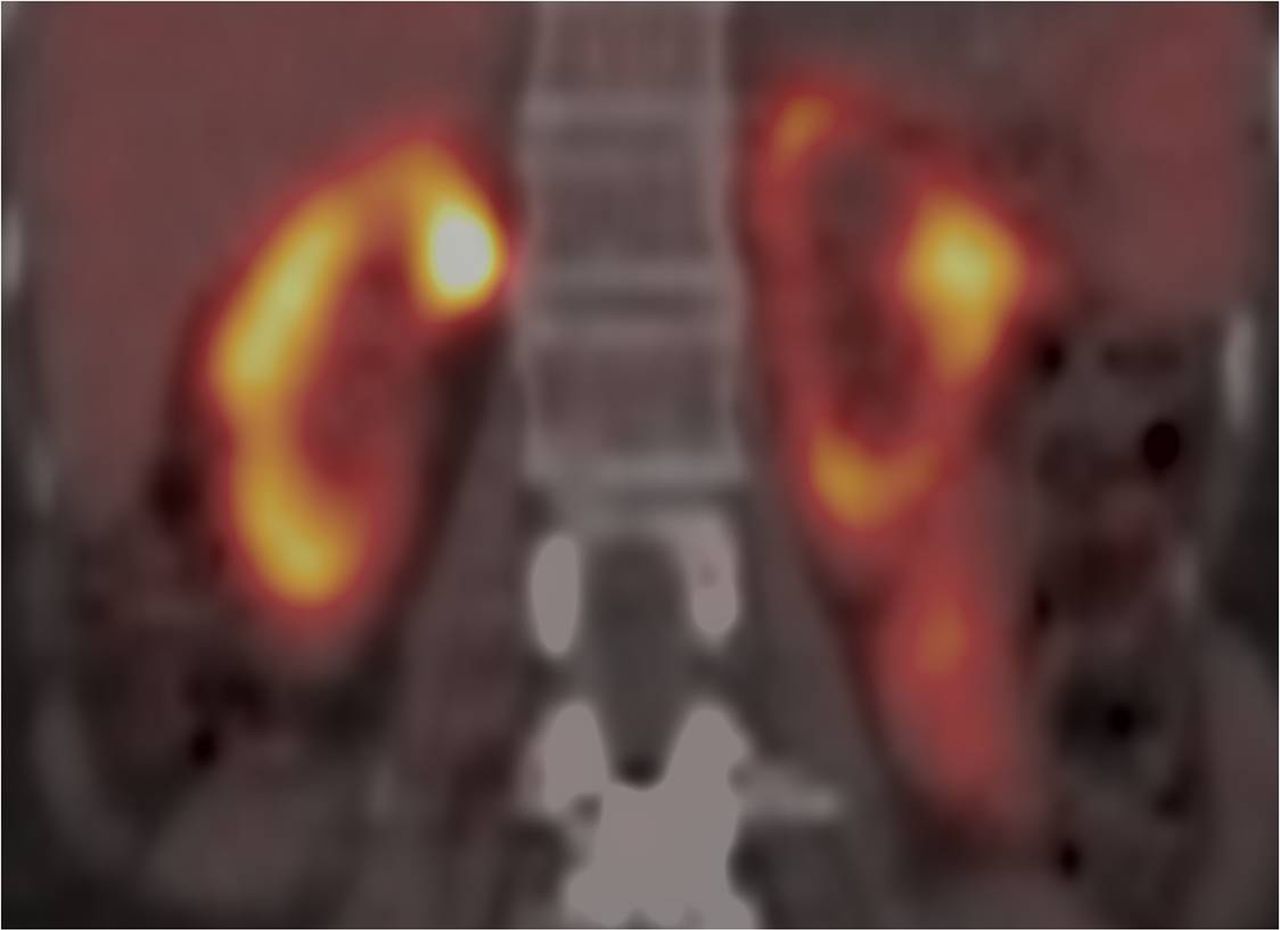
Bigger renal tumors often exhibit regions of cystic degeneration or necrosis that are difficult to assess. The readers measured the solid components of these tumors that exhibited higher 99mTc-sestamibi uptake than the necrotic parts. A similar strategy can be adopted for SUV measurements of healthy renal parenchyma. It is easier for readers to perform SUV measurements on the regions of healthy parenchyma with the highest 99mTc-sestamibi uptake; in those cases, that uneven uptake was observed (Fig. 3). In many cases, though, the 99mTc-sestamibi uptake was equally distributed in the healthy renal parenchyma.

Coronal 99mTc-sestamibi SPECT/CT fused image of bilaterally healthy kidney parenchyma, with regions of uneven uptake in left kidney and more even uptake in right kidney.
Our measurements were done unsystematically on the healthy renal parenchyma of the ipsilateral kidney, partly explaining the low ICCs (∼70%) obtained between the 2 readers, compared with the very high ICCs from the renal tumors, which are by definition more focal and often well-defined lesions. The ICCs for the healthy renal parenchyma in the same reader were very high, however, at around 95%.
The different nature of the solid renal tumors, namely the higher mitochondrial content of renal oncocytomas, hybrid oncocytic chromophobe renal tumor, and some variants of chromophobe RCC, clearly affects the uptake and distribution of the 99mTc-sestamibi, indicating the regions of maximal 99mTc-sestamibi uptake (19). Future clinical applications and SUV SPECT measurements should be performed on those regions exhibiting the highest 99mTc-sestamibi uptake since they are easily identified visually by any reader. No further analysis based on the nature (benign or malignant) of the examined solid renal lesions or correlation with the visual evaluation of 99mTc-sestamibi uptake was performed in the present study.
CONCLUSION
The ICCs of around 70% obtained between the 2 readers concerning measurements on healthy renal parenchyma suggest moderate agreement, a finding that is partly explained by the absence of predefined criteria about the location of SUV measurements. Regions of high radioisotope uptake on healthy renal parenchyma should be preferred for future measurements since they are easily detected by any reader. At the same time, the examination of solid renal lesions in this study with quantitative SUV SPECT showed high ICCs of around 90% not only for measurements by the same reader but also for measurements between 2 different readers. Those high ICCs indicate strong agreement among SUV measurements for patients with solid renal lesions undergoing 99mTc-sestamibi SPECT/CT.
DISCLOSURE
This pilot project was financially supported by VINNOVA (MIDOR study, diarienummer 2015-0180). No other potential conflict of interest relevant to this article was reported.
Footnotes
Published online Apr. 24, 2019.
REFERENCES
- Received for publication November 13, 2018.
- Accepted for publication January 31, 2019.


