


Article Figures & Data
Figures
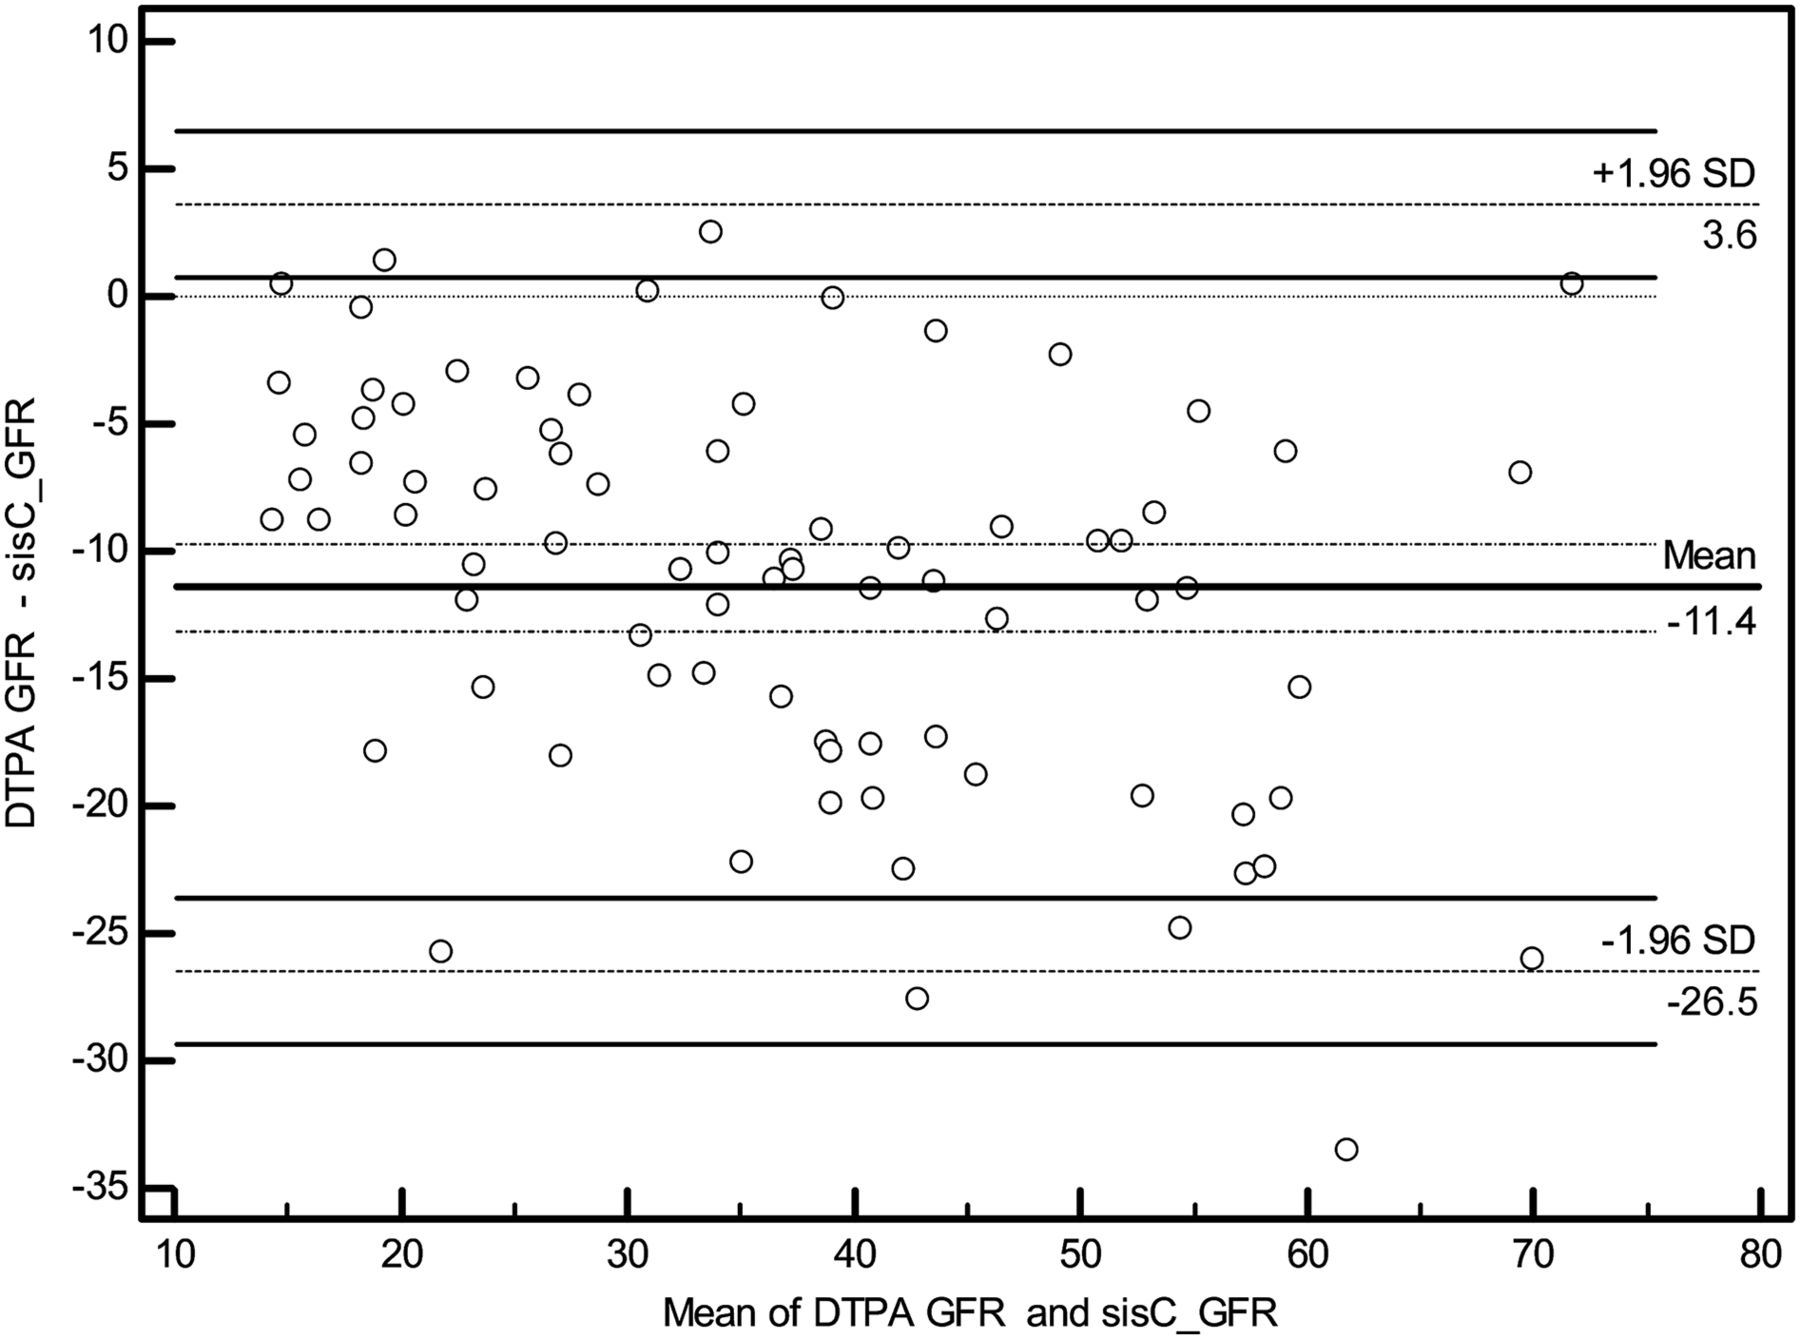
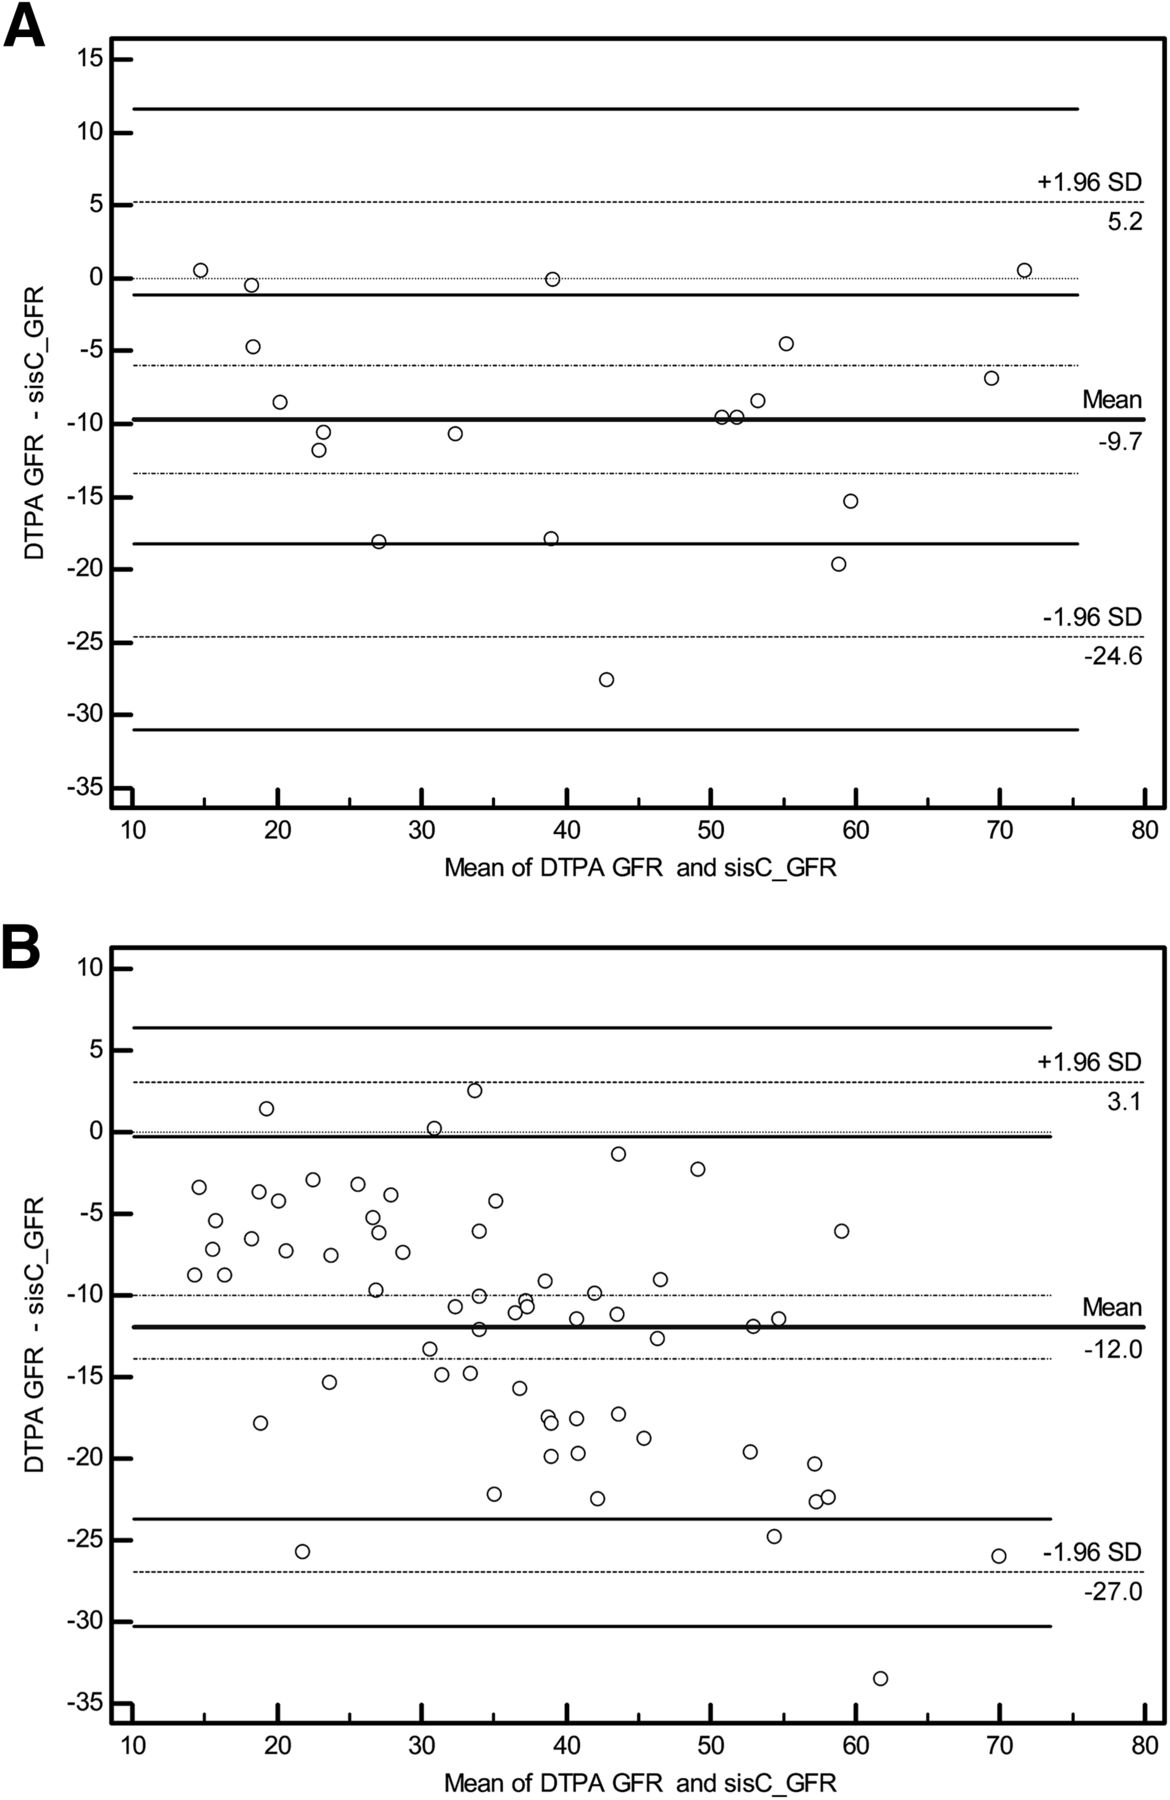
- FIGURE 1.
Scatterplot drawn using Bland–Altman analysis showing difference between 99mTc-DTPA GFR and cystatin C GFR at confidence level of 95%. sisC = cystatin C.
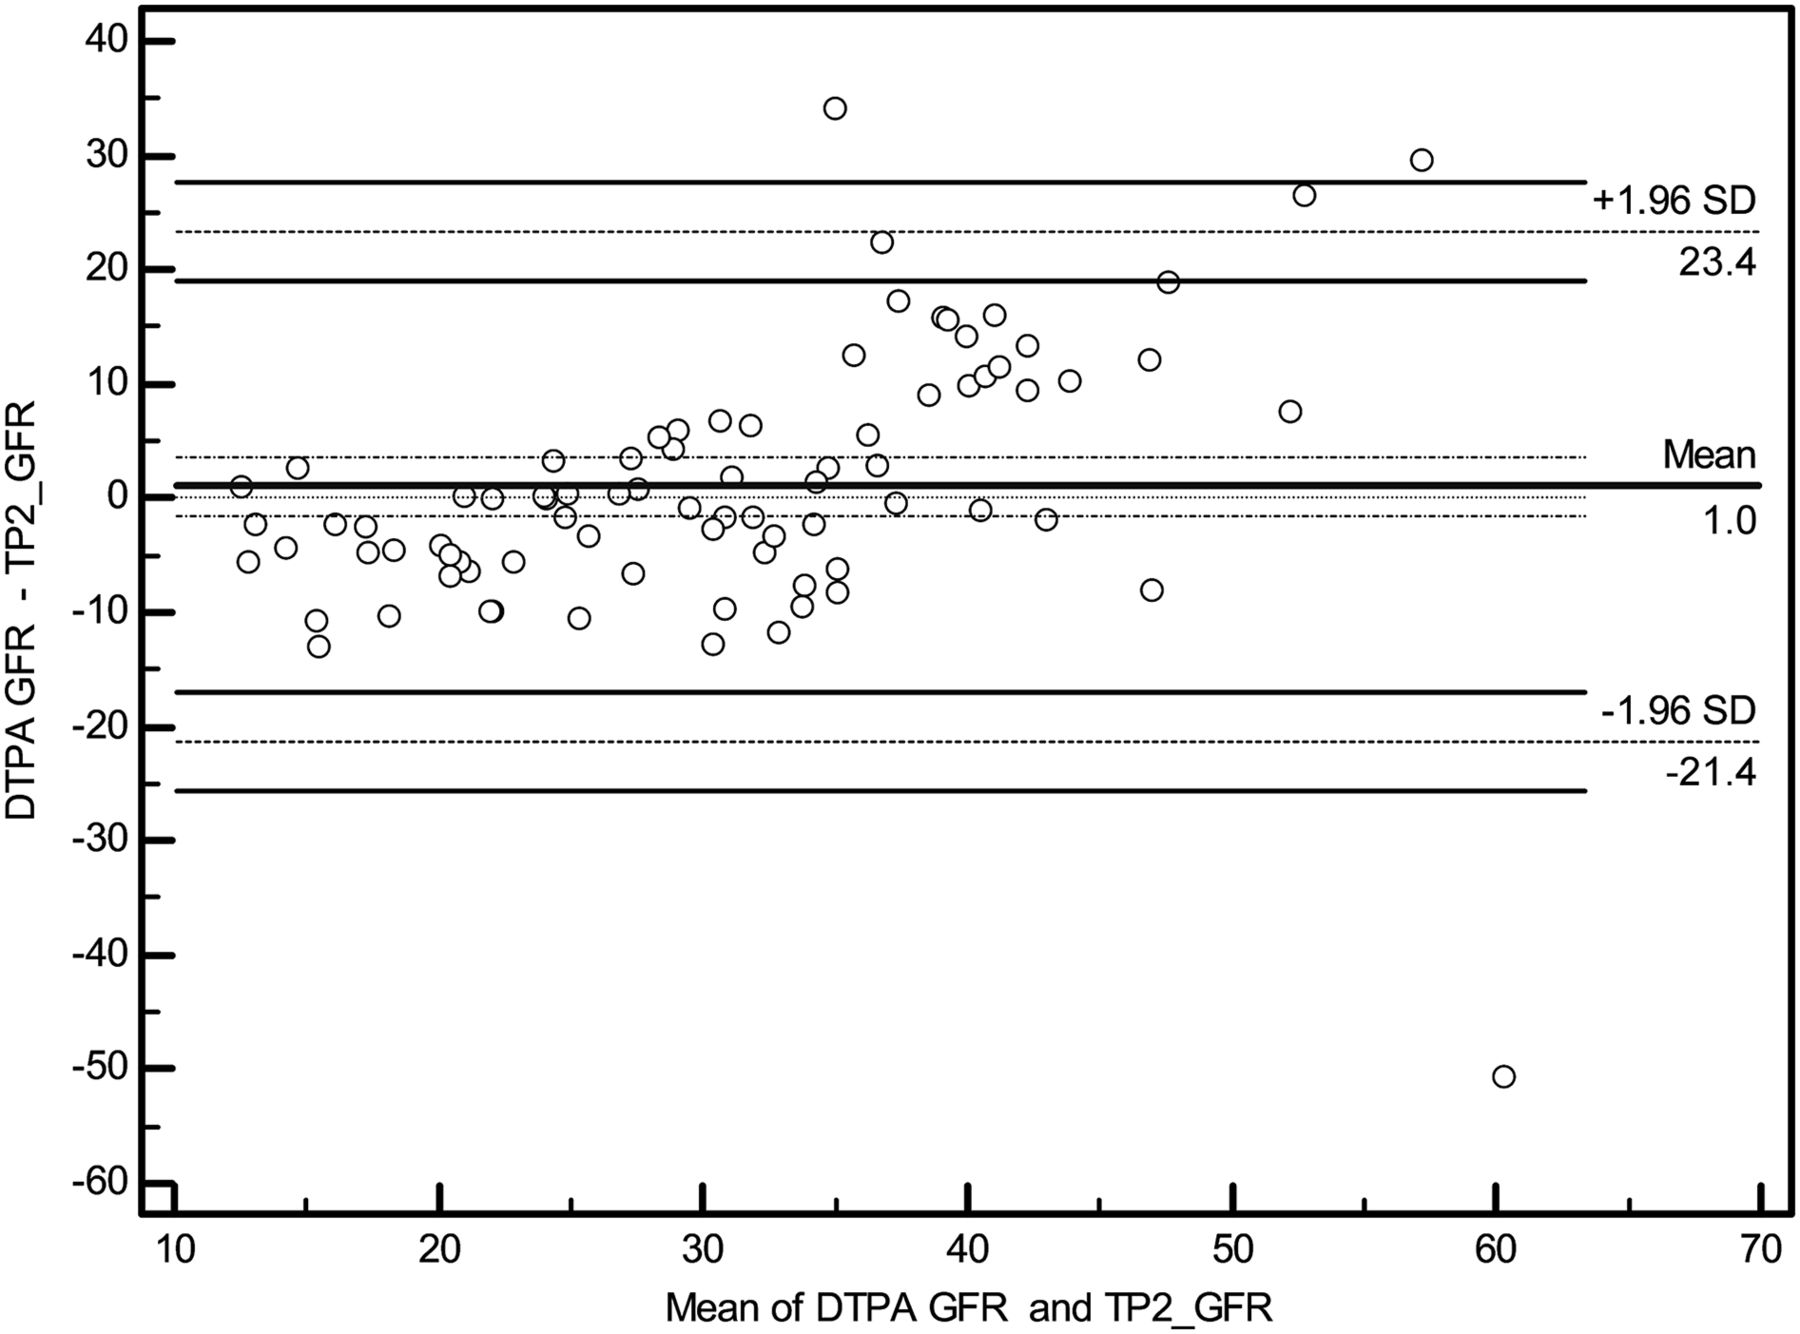
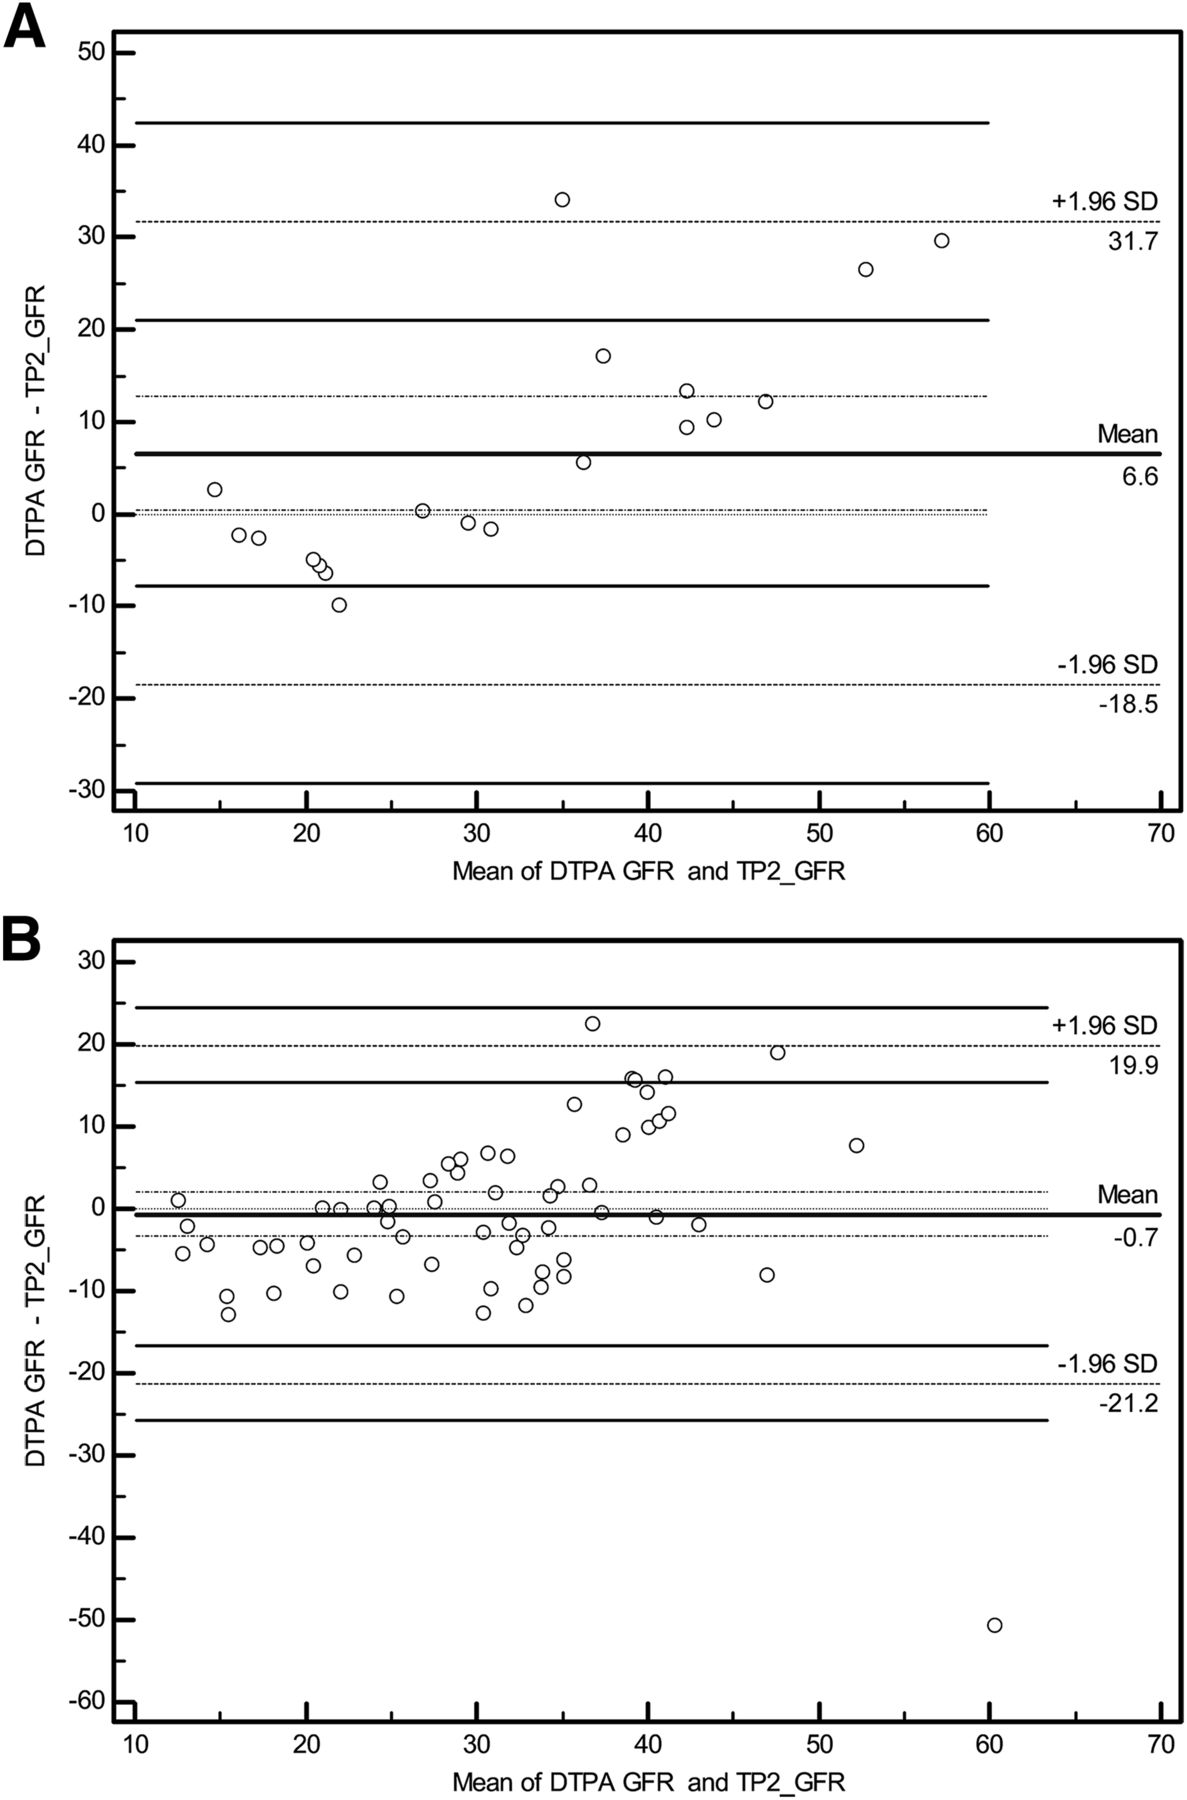
- FIGURE 2.
Scatterplot drawn using Bland–Altman analysis showing difference between 99mTc-DTPA GFR and β-trace protein GFR at confidence level of 95%. TP2 = β-trace protein.
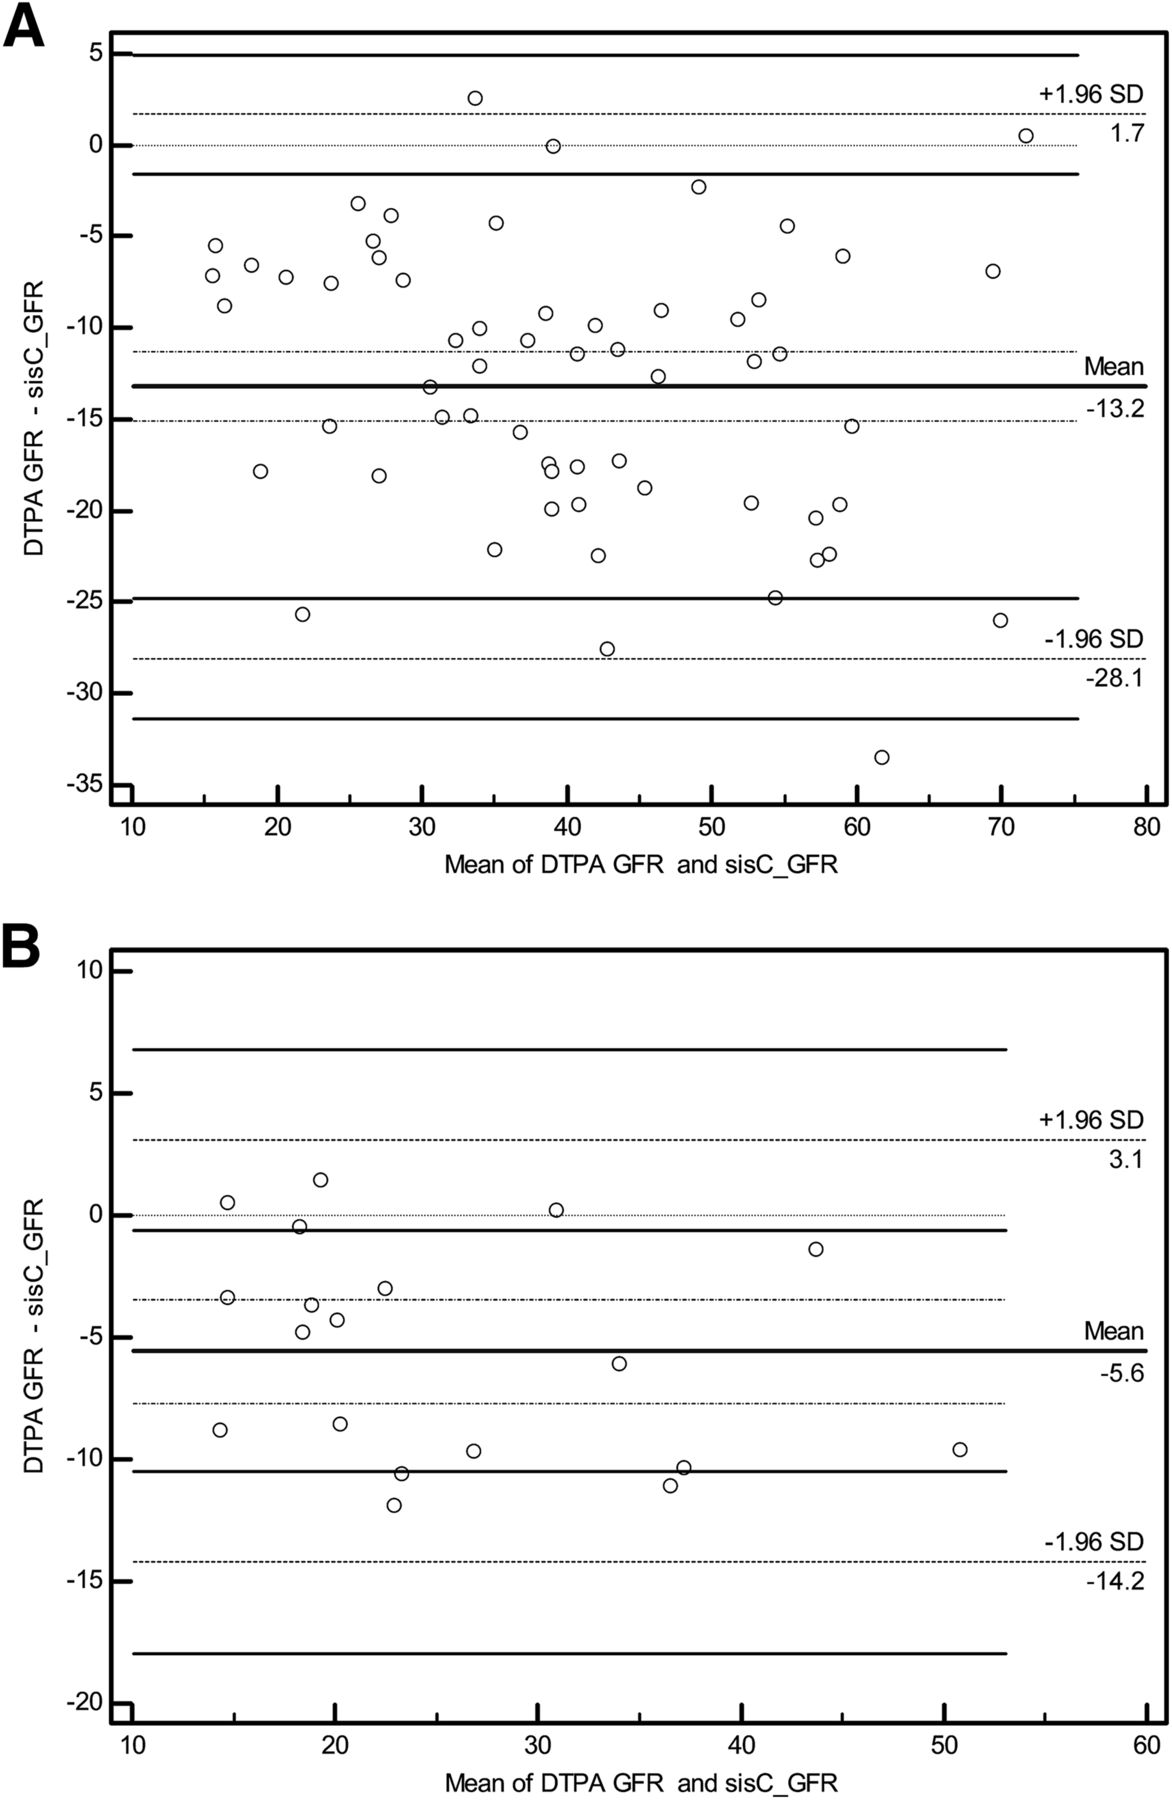
- FIGURE 3.
(A) Scatterplot drawn using Bland–Altman analysis showing difference between 99mTc-DTPA GFR and cystatin C GFR with urinary NAG ≤ 6.1 IU/L, at confidence level of 95%. (B) Scatterplot drawn using Bland–Altman analysis showing difference between 99mTc-DTPA GFR and cystatin C GFR with urinary NAG > 6.1 IU/L, at confidence level of 95%. sisC = cystatin C.
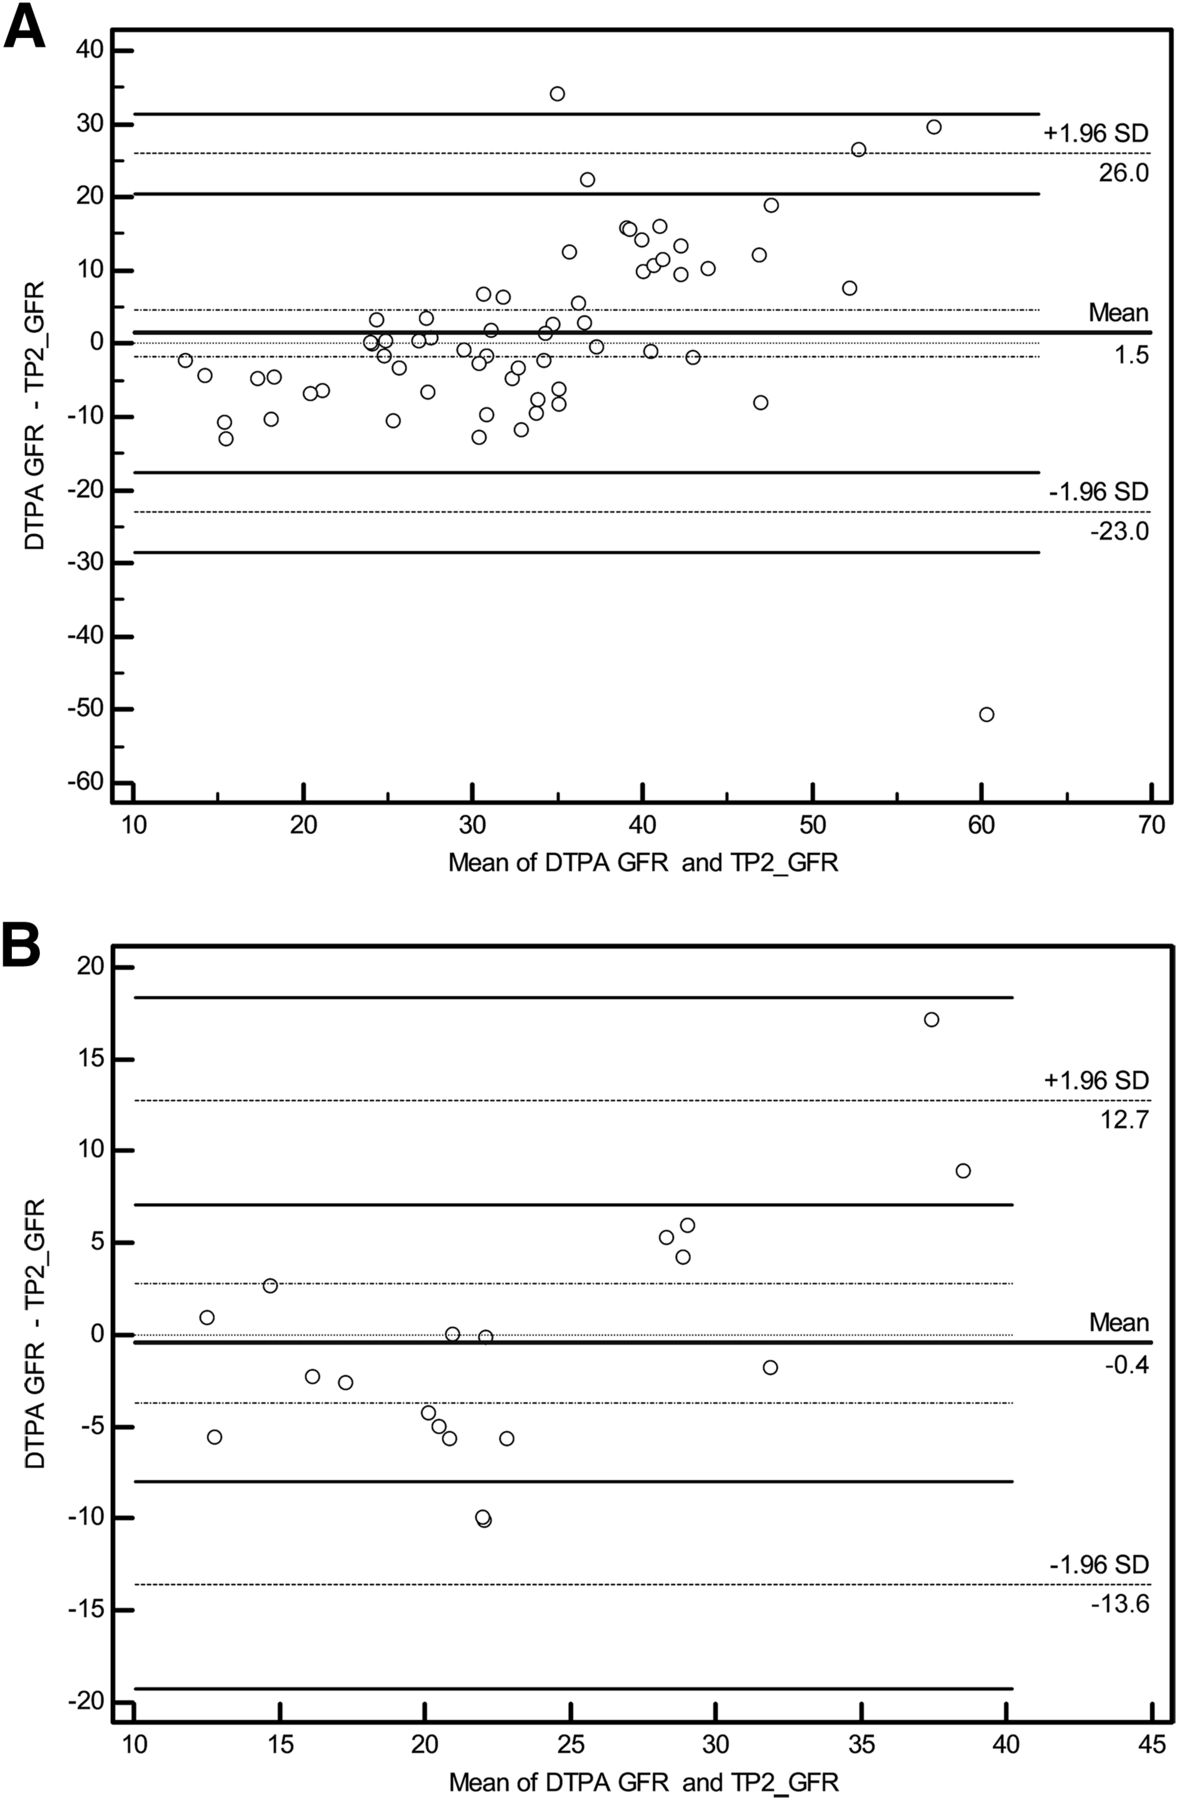
- FIGURE 4.
(A) Scatterplot drawn using Bland–Altman analysis showing difference between 99mTc-DTPA GFR and β-trace protein GFR with urinary NAG ≤ 6.1 IU/L, at confidence level of 95%. (B) Scatterplot drawn using Bland–Altman analysis showing difference between 99mTc-DTPA GFR and β-trace protein GFR with urinary NAG > 6.1 IU/L, at confidence level of 95%. TP2 = β-trace protein.
- FIGURE 5.
(A) Scatterplot drawn using Bland–Altman analysis showing difference between 99mTc-DTPA GFR and cystatin C GFR with urinary β2-microglobulin ≤ 0.2 mg/L, at confidence level of 95%. (B) Scatterplot drawn using Bland–Altman analysis showing difference between 99mTc-DTPA GFR and cystatin C GFR with urinary β2-microglobulin > 0.2 mg/L, at confidence level of 95%. sisC = cystatin C.
- FIGURE 6.
(A) Scatterplot drawn using Bland–Altman analysis showing difference between 99mTc-DTPA GFR and β-trace protein GFR with urinary β2 microglobulin ≤ 0.2 mg/L, at confidence level of 95%. (B) Scatterplot drawn using Bland–Altman analysis showing difference between 99mTc-DTPA GFR and BTP GFR with urinary β2 microglobulin > 0.2 mg/L, at confidence level of 95%. TP2 = β-trace protein.


Tables
Parameter n Minimum Maximum Mean ±SD TPSM 84 9 72 31.91 14.28 Urinary β2 microglobulin 84 0.2 28.2 2.58 5.86 Urinary cystatin C 84 0.23 1.45 0.35 0.29 Serum β2-microglobulin 84 0.8 15.7 6.60 3.69 Serum cystatin C 84 0.21 4.28 1.92 0.81 Serum creatinine 83 1.02 79.72 3.16 8.58 Serum sodium 84 118 145 135.76 4.77 Serum phosphorus 84 2.15 32.39 3.95 3.19 Serum blood urea nitrogen 84 12 225 36.04 25.77 Urinary creatinine 84 1.5 795.3 95.65 93.63 Urinary sodium 84 8 193 58.70 33.32 Urinary phosphorus 84 2.31 69.63 27.65 16.66 Urinary total protein 84 1.4 578.4 51.80 93.03 Urinary NAG (IU/L) 84 0.30 49.25 12.06 8.57 β-trace protein (ng/mL) 84 49 4,880 2,108.51 920.57 Serum FT4 84 0.5 1.5 1.24 0.21 Thyroid-stimulating hormone 84 0.2 33.760 1.86 3.71 Comparison Limits of agreement* SD Mean difference Cystatin C and TPSM Total −26.5, 3.6 7.7 −11.4 Group 1 −24.8, 6.2 7.9 9.3 Group 2 −23.8, 2.3 6.5 −10.8 Group 3 −29.2, 3.3 8.3 −12.9 β-trace protein and TPSM Total −21.4, 23.4 11.4 1.0 Group 1 −14.9, 3.2 4.6 −5.9 Group 2 −13.0, 4.8 4.5 −4.1 Group 3 −19.5, 30.9 12.9 5.7 ↵* 95% confidence interval.
- TABLE 4
Correlation Between TPSM GFR and β-Trace Protein and Cystatin C GFRs for the 2 Levels of NAG
NAG level Method ≤6.1 IU/L (n = 19) >6.1 IU/L (n = 63) P Cystatin C 0.957 (<0.0001) 0.887 (<0.0001) 0.0001 β-trace protein 0.801 (<0.0001) 0.694 (<0.0001) 0.0001 Data are r values followed by P values in parentheses.
- TABLE 5
Correlation Between TPSM GFR and β-Trace Protein and Cystatin C GFRs for the 2 Levels of Urinary β2 Microglobulin
Urinary β2 microglobulin Method ≤0.2 (mg/L) (n = 19) >0.2 (mg/L) (n = 63) P Cystatin C 0.892 (<0.0001) 0.839 (<0.01) 0.0001 β-trace protein 0.626 (<0.0001) 0.722 (<0.0001) 0.02


Jump to section
Related Articles
Cited By...
- No citing articles found.