


Abstract
In the wake of the Food and Drug Administration (FDA) recall, many clinics have had to reduce their examination volumes to meet the new generator volume usage requirements. This review tests 3 common infusion methods and how they affect patient dose, generator volume usage, image counts, and generator volume limits. Methods: Three common configurations of the 82Rb infusion system settings—standard 50-mL, volume-limiting, and bolus methods—were tested to determine how they affect patient dose, generator volume, and image counts. Each injection configuration was tested daily for the duration of 3 consecutive generators by injection into separate vials. Each injection configuration was also infused into a beaker and imaged to determine the impact of image counts for each method. The total estimated volumes for multiple examination and quality assurance clinical situations were simulated to observe the use of each method relative to the new FDA volume alert and expiration limits. Results: Vial tests confirmed that the bolus method used the least amount of volume per infusion and stayed the most consistent throughout the life of the generator. The bolus method also produced a lower patient dose after approximately 10 d of use. The beaker tests in the scanner showed that the standard 50-mL method produced the greatest number of total counts for the flow and uptake images. On the basis of the estimated total volume simulations, the bolus method allowed for the most examinations over the life of the generator while staying within the new FDA limits. Conclusion: All 3 methods for augmenting the 82Rb infusion system produced different outcomes for patient dose, image counts, and total generator volume use. The standard 50-mL method ensured the maximum amount of counts available for imaging throughout the life of the generator. The bolus method provided a consistent and predictable amount of volume use. The volume-limiting method fell somewhere in the middle of volume predictability and count preservation.
In the wake of the Food and Drug Administration recall, many clinics have reduced their patient volumes to meet the new generator volume usage requirements for preventing unintended radiation exposure to 82Sr and 85Sr (1). This review of 3 different infusion methods shows how those methods affect patient dose, generator volume usage, image counts, and generator volume limits.
MATERIALS AND METHODS
Infusion Methods
There are multiple infusion settings on the 82Rb CardioGen-82 Infusion System (Bracco). According to the CardioGen-82 user tools manual, the elution volume and infusion rate (1) should never be changed from 3,663 MBq (99 mCi) and 37 MBq/s (1 mCi/s), respectively. However, patient volume (20–50 mL) and patient dose (370–2,220 MBq [10–60 mCi]) may be changed (2). Three common configurations of these 2 settings were tested to determine how they affect patient dose, generator volume, and image counts.
Standard 50-mL Protocol
In the standard 50-mL protocol, the patient volume is set for 50 mL, and the patient dose is set for 1,850 MBq (50 mCi) for the life of the generator. The protocol is referred to as 50 mL hereafter.
Volume-Limiting 30-mL Protocol
The volume-limiting 30-mL protocol has been recently recommended by Bracco to reduce the total volume per injection, thereby allowing more patient examinations per generator. However, its effect on generator volumes has not been reported. The patient volume is set for 30 mL, and the patient dose is set for 1,850 MBq (50 mCi). The protocol is referred to as 30 mL hereafter.
Bolus Protocol
For the bolus protocol, the goal is timing to include only the volume of the bolus of activity delivered by the generator, excluding portions of the infusion with activity under approximately 18.5 MBq (0.5 mCi). The patient volume is set for 50 mL, and the patient dose is changed daily based on the generator output. The protocol is referred to as bolus hereafter.
In Vitro Vial Test
Each infusion method was tested daily by collecting eluate in separate 50-mL glass quality assurance (QA) vials. The patient dose at the end of the infusion and the elution volume were recorded from the printed strip for each infusion for 3 consecutive generators.
Beaker Scan Test
In the first 10 d of a generator, the 3 protocols yielded similar activity and volumes per injection. However, after 10 d as generator yield started to decline, the different protocols yielded increasingly different results that we also examined. Accordingly, to quantify the greatest expected differences among the 3 protocols as proof of concept, we selected day 34 of a subsequent generator to examine 2 imaging scenarios: a 2-min image, followed by a 5-min image corresponding to our early 2-min arterial input image and subsequent 5-min myocardial uptake image because both are needed for quantifying perfusion in mL/min/gm.
Using a 500-mL glass beaker filled with tap water, we infused 82Rb into the beaker according to each of the 3 infusion protocols and imaged for 2 min starting as soon as counts appeared in the scanner field of view in order to capture time–activity curves. Time was allowed for the beaker to decay to background between infusions. The dose, total counts, and time–activity curves were collected for this early arterial image for all infusion methods.
For the late-uptake phase, the beaker was prepared in the same way. After infusion completion and a 90-s delay, the beaker was imaged for 5 min after each infusion method; this delay is typical for standard relative uptake imaging in which arterial input and absolute perfusion in mL/min/gm are not measured. The dose, total counts, and time–activity curves were collected for this late-uptake image for all infusion methods.
RESULTS
In Vitro Vial Test Results
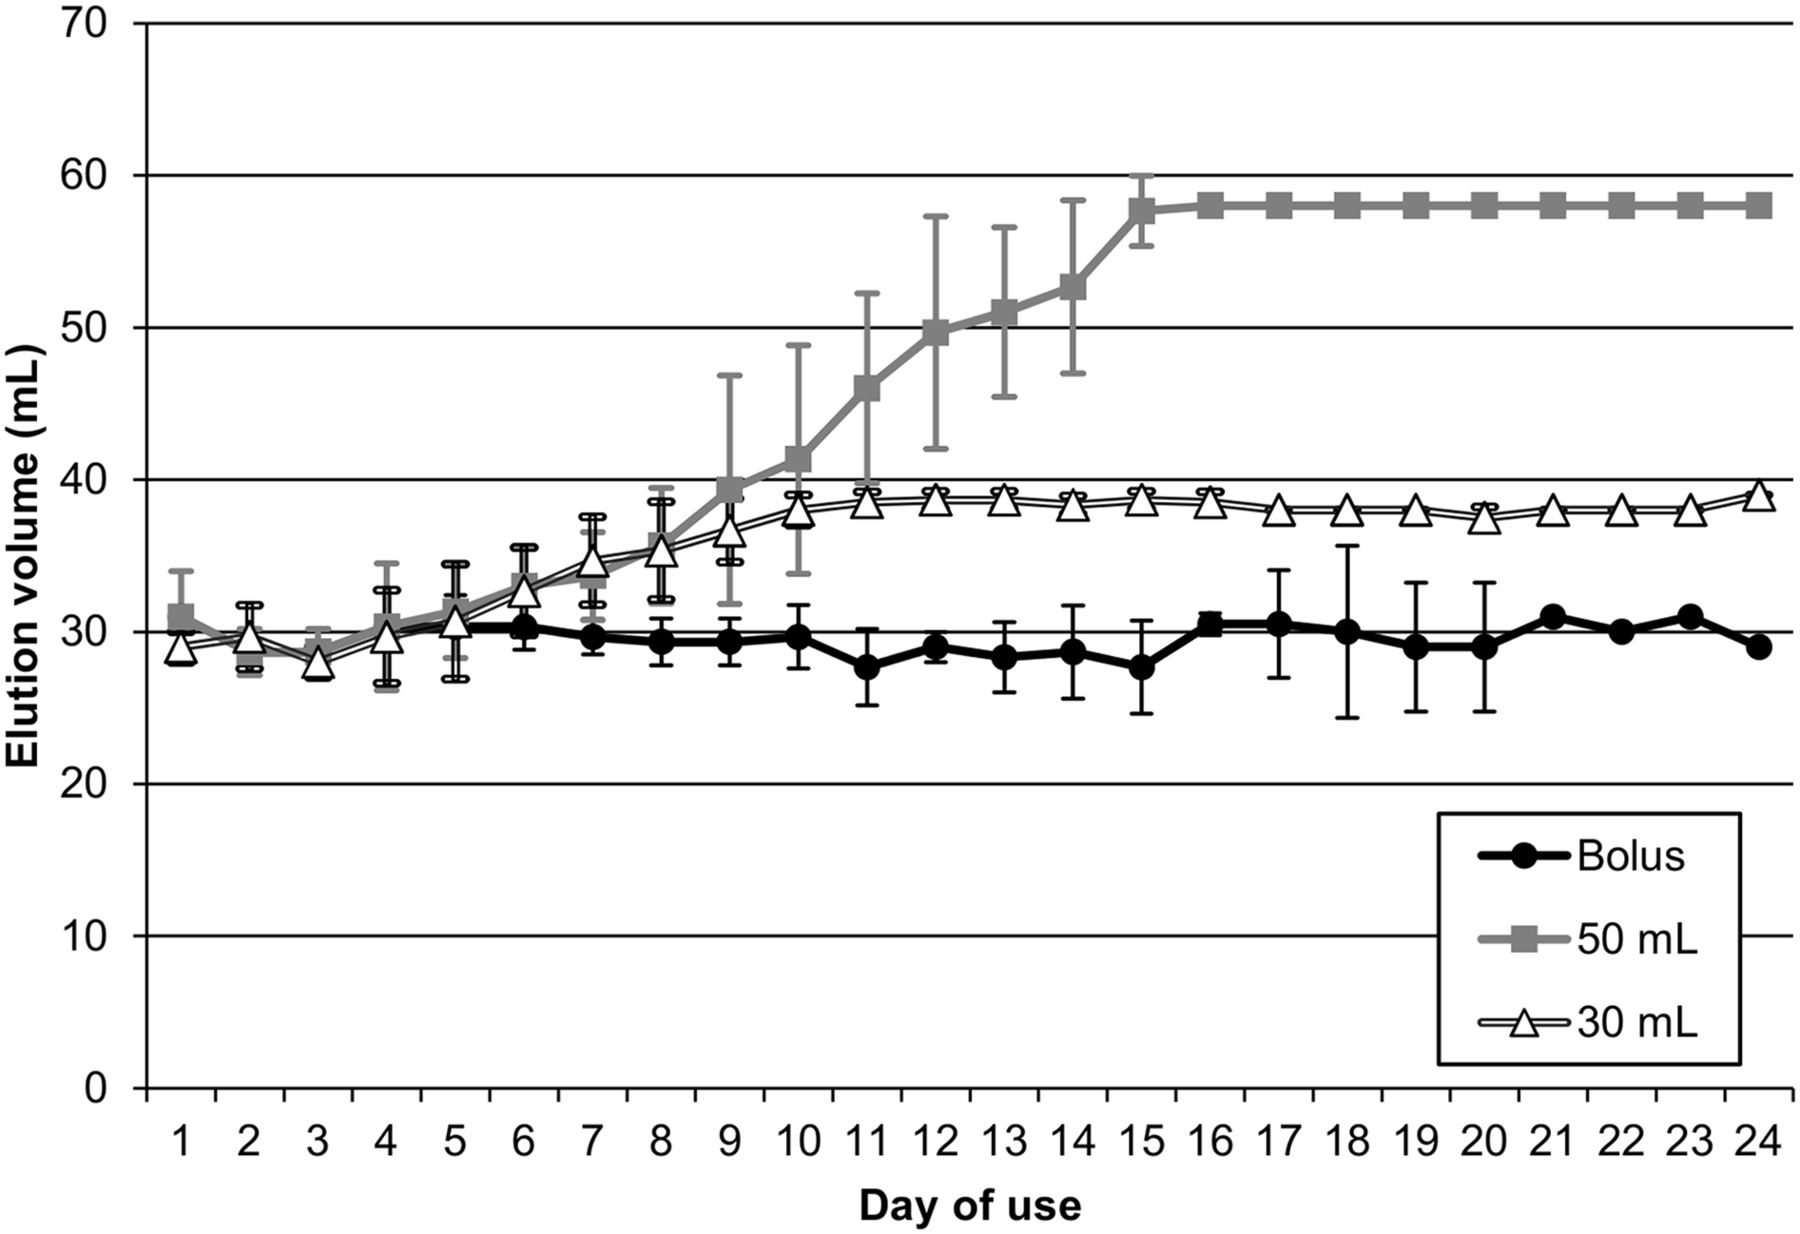
Table 1 and Figure 1 confirm that the bolus protocol uses the least amount of volume per infusion and remains the most consistent throughout the life of the generator. Over the lifetime use of the generator, the average total volume for the bolus protocol in generator 1 was 31% and 12.9% less than the 50-mL and 30-mL protocols, respectively; for generator 2, it was 34.2% and 19.3% less the 50-mL and 30-mL protocols; and for generator 3, it was 33.9% and 13.4% less than the 50-mL and 30-mL protocols.
Vial Test Volume in Milliliters

Graph of average daily volume differences between each method for all 3 generators. Error bars represent SD for each infusion method. Generator 2 was used for 20 d and generator 3 for 15 d.
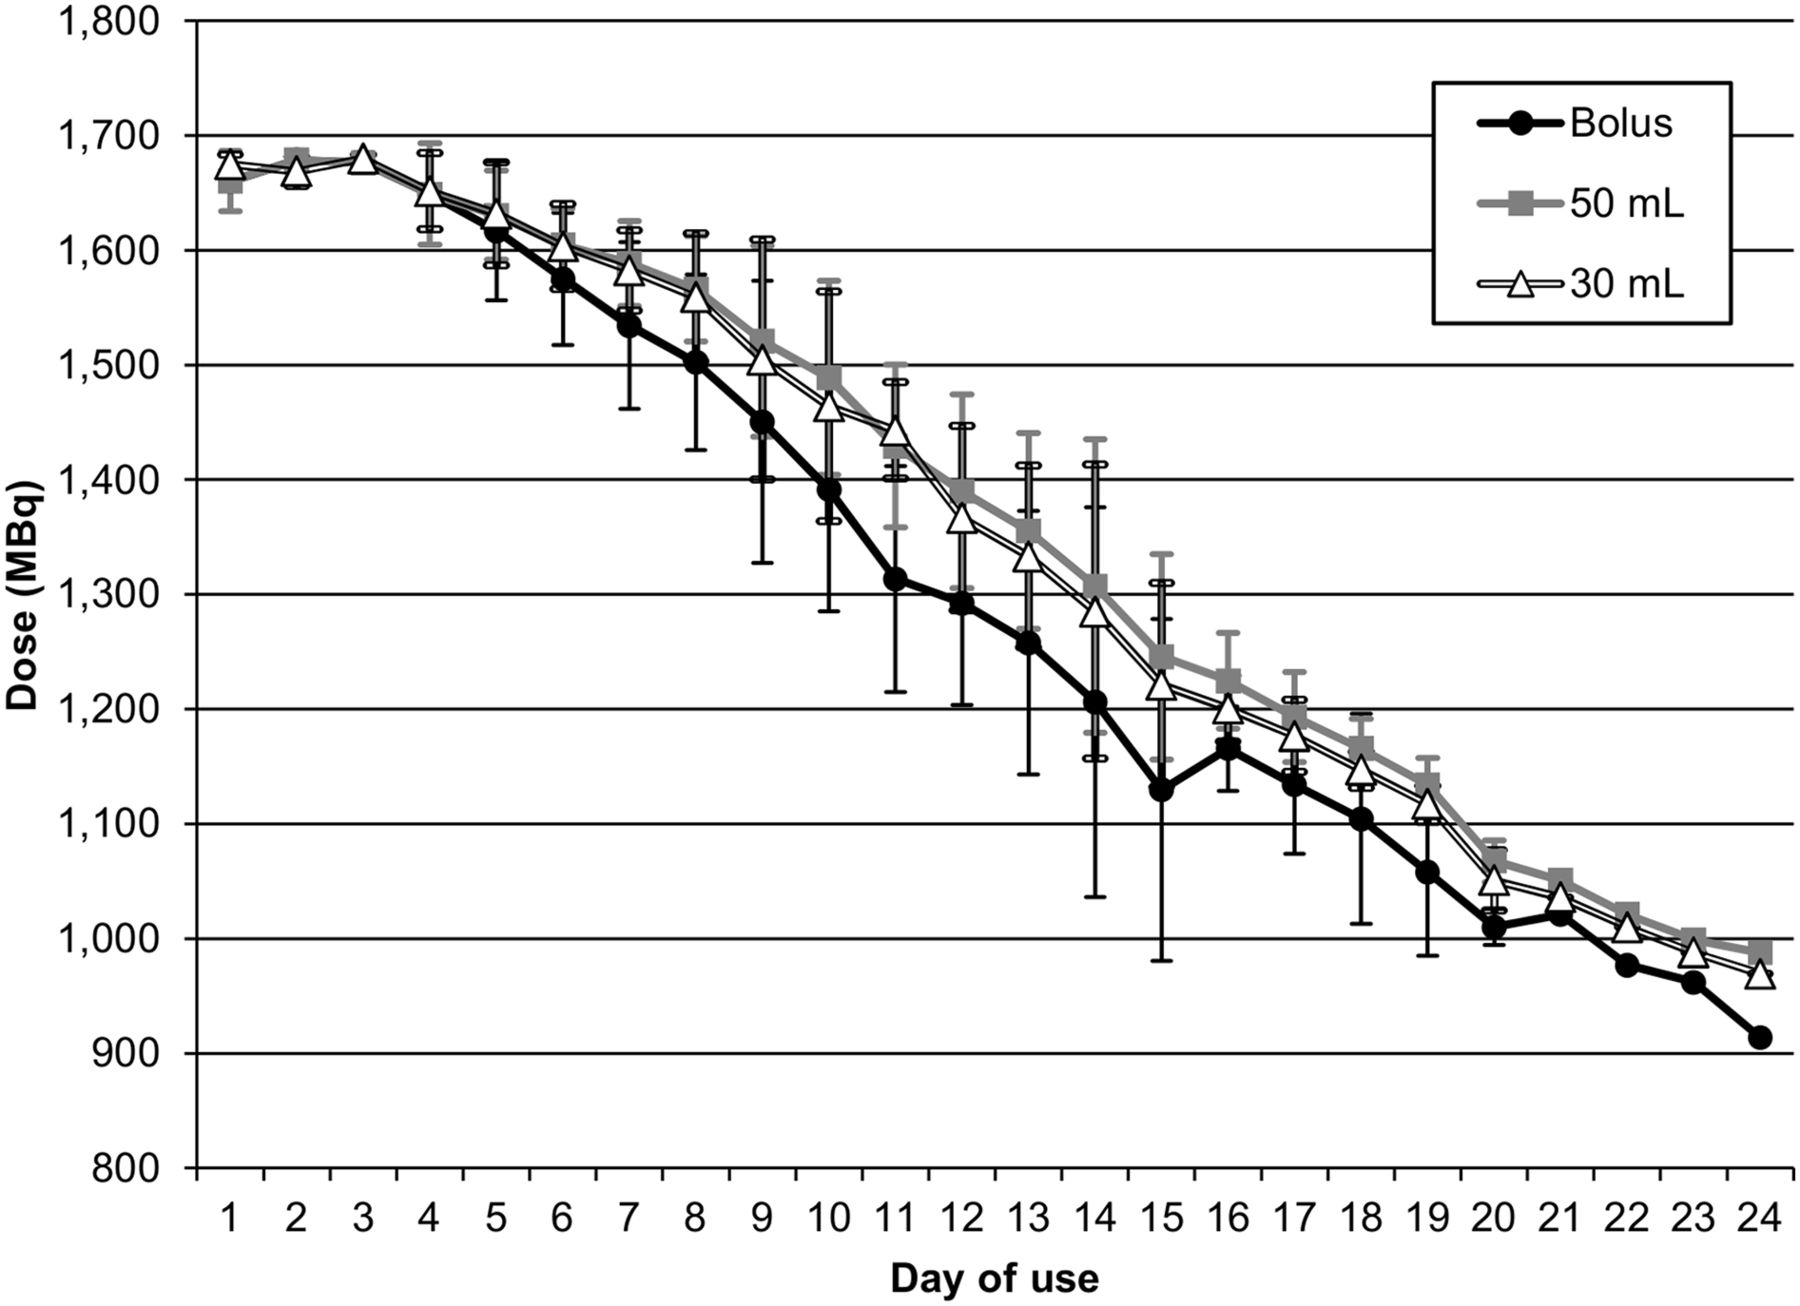
However, the bolus protocol also produced a slightly lower patient dose after approximately 10 d of use. Table 2 and Figure 2 display the dose range data throughout the usage of the generators. The differences in dose ranged from 0% to 7.5% less than the 50-mL protocol and from 0% to 5.7% less than the 30-mL method for generator 1. For Generator 2, dose differences were 0%–9.9% and 0%–9% less than the 50-mL and 30-mL protocols, respectively, and for generator 3 they were 0%–16.2% and −0.1%–14.5% less than the 50-mL and 30-mL protocols, respectively.
Dose Ranges

Graph of average daily dose differences for each method across all 3 generators. Error bars represent SD for each infusion method. Generator 2 was used for 20 d and generator 3 for 15 d.
Beaker Scan Results
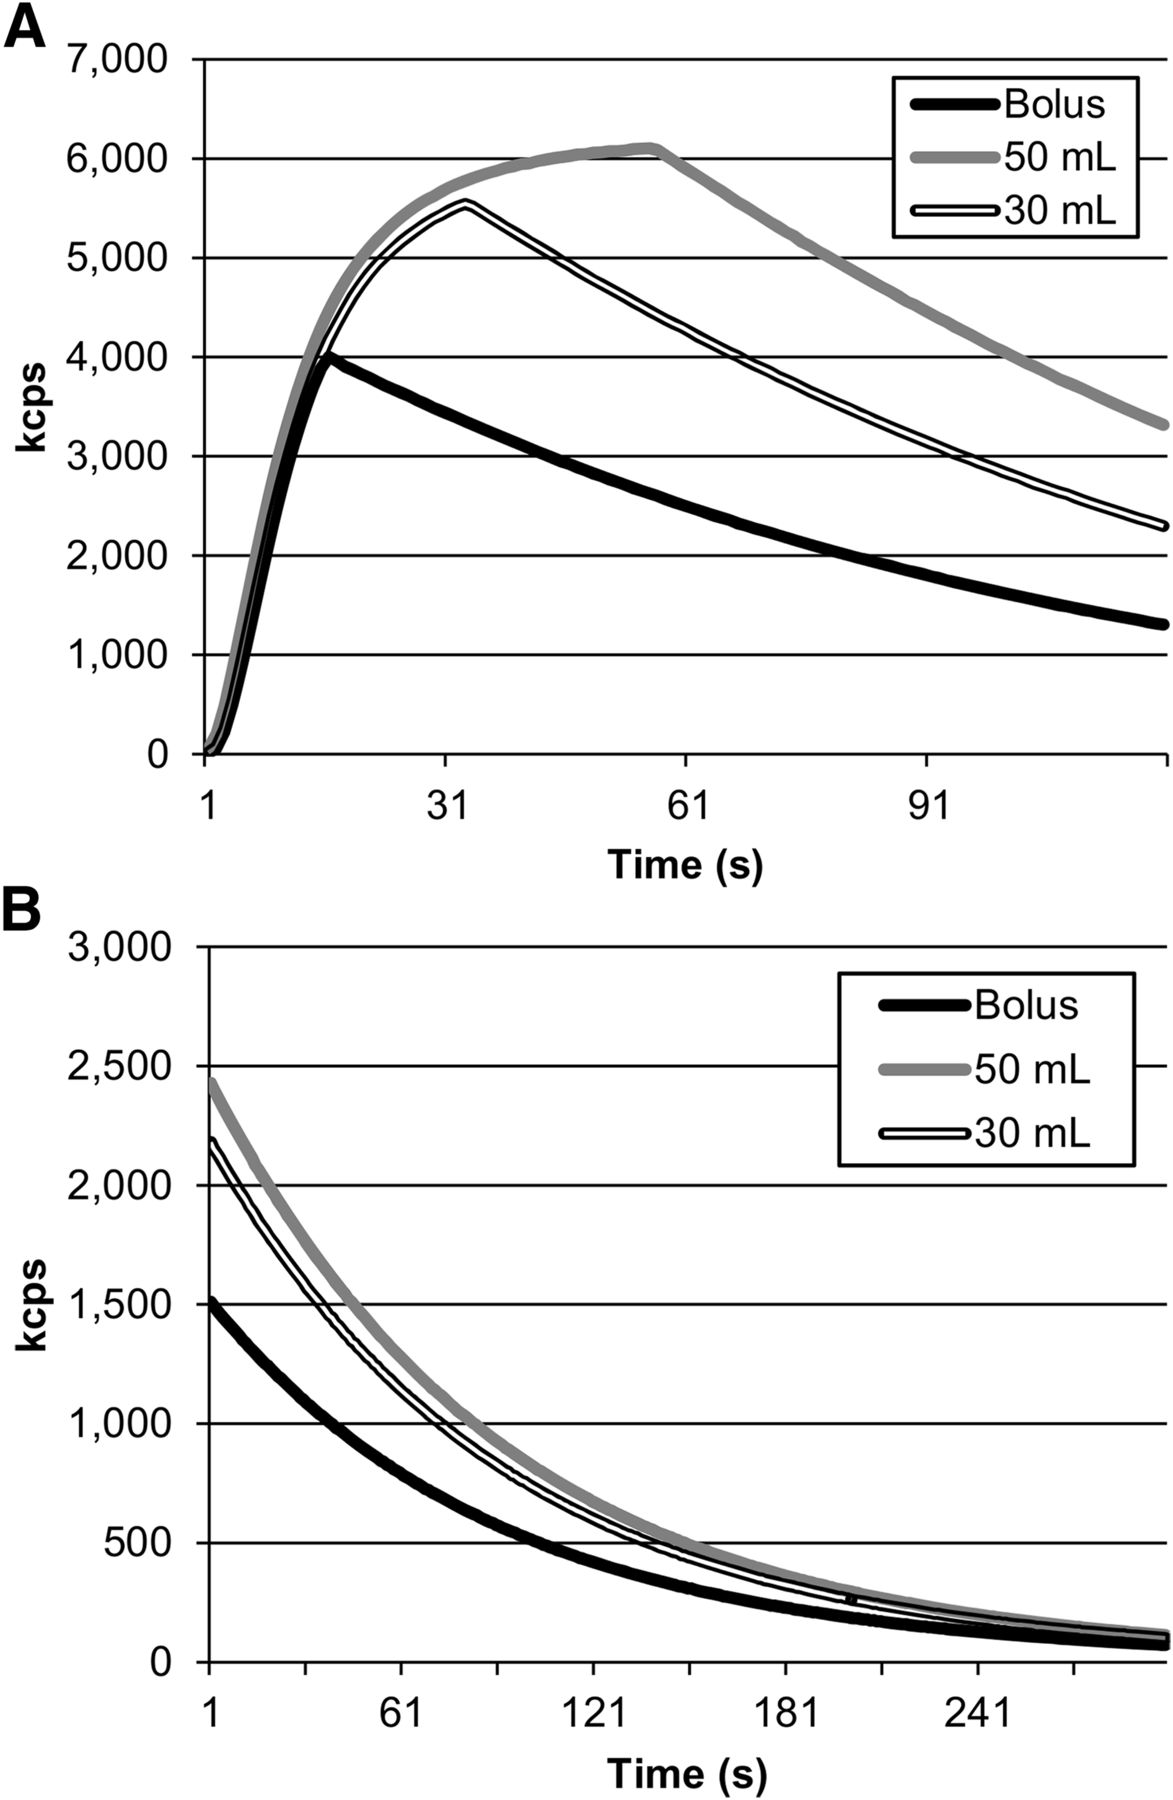
The standard 50-mL protocol produced the greatest number of total counts for the early-arterial and late-uptake images, compared with somewhat less for the 30-mL protocol and substantially less for the bolus protocol seen in Table 3 and Figure 3. For the early-arterial images, activity injected into the beaker for the standard 50-mL protocol was 4% higher than the 30-mL protocol and 23% higher than the bolus protocol. The total acquired counts for the early-arterial standard 50-mL protocol were 21% greater than the 30-mL protocol and 50% greater than the bolus protocol. For the late-uptake images, the activity injected into the beaker for the standard 50-mL protocol was 4% higher than the 30-mL protocol and 23% higher than the bolus protocol. The total acquired counts for the late-uptake standard 50-mL protocol were 11% greater than the 30-mL protocol and 37% greater than the bolus protocol.
Imaged Activity

Difference in counts per s (kcps) for each method for early-arterial and late-uptake acquisitions. (A) 2 min flow. (B) 5 min uptake.
Generator Volume Limits
Current volume limits for the 82Rb CardioGen-82 Infusion System are 14 L as an alert limit and 17 L for expiration. In this study, days of use were defined as days QA was completed and patients scanned. Twenty-four days (5 calendar weeks) was the longest this site used a generator during this study, so that generator’s life span was chosen to extrapolate theoretic patient usage volumes in Figure 4. The actual daily QA and the vial injection volumes were used to simulate total generator volume for each method.
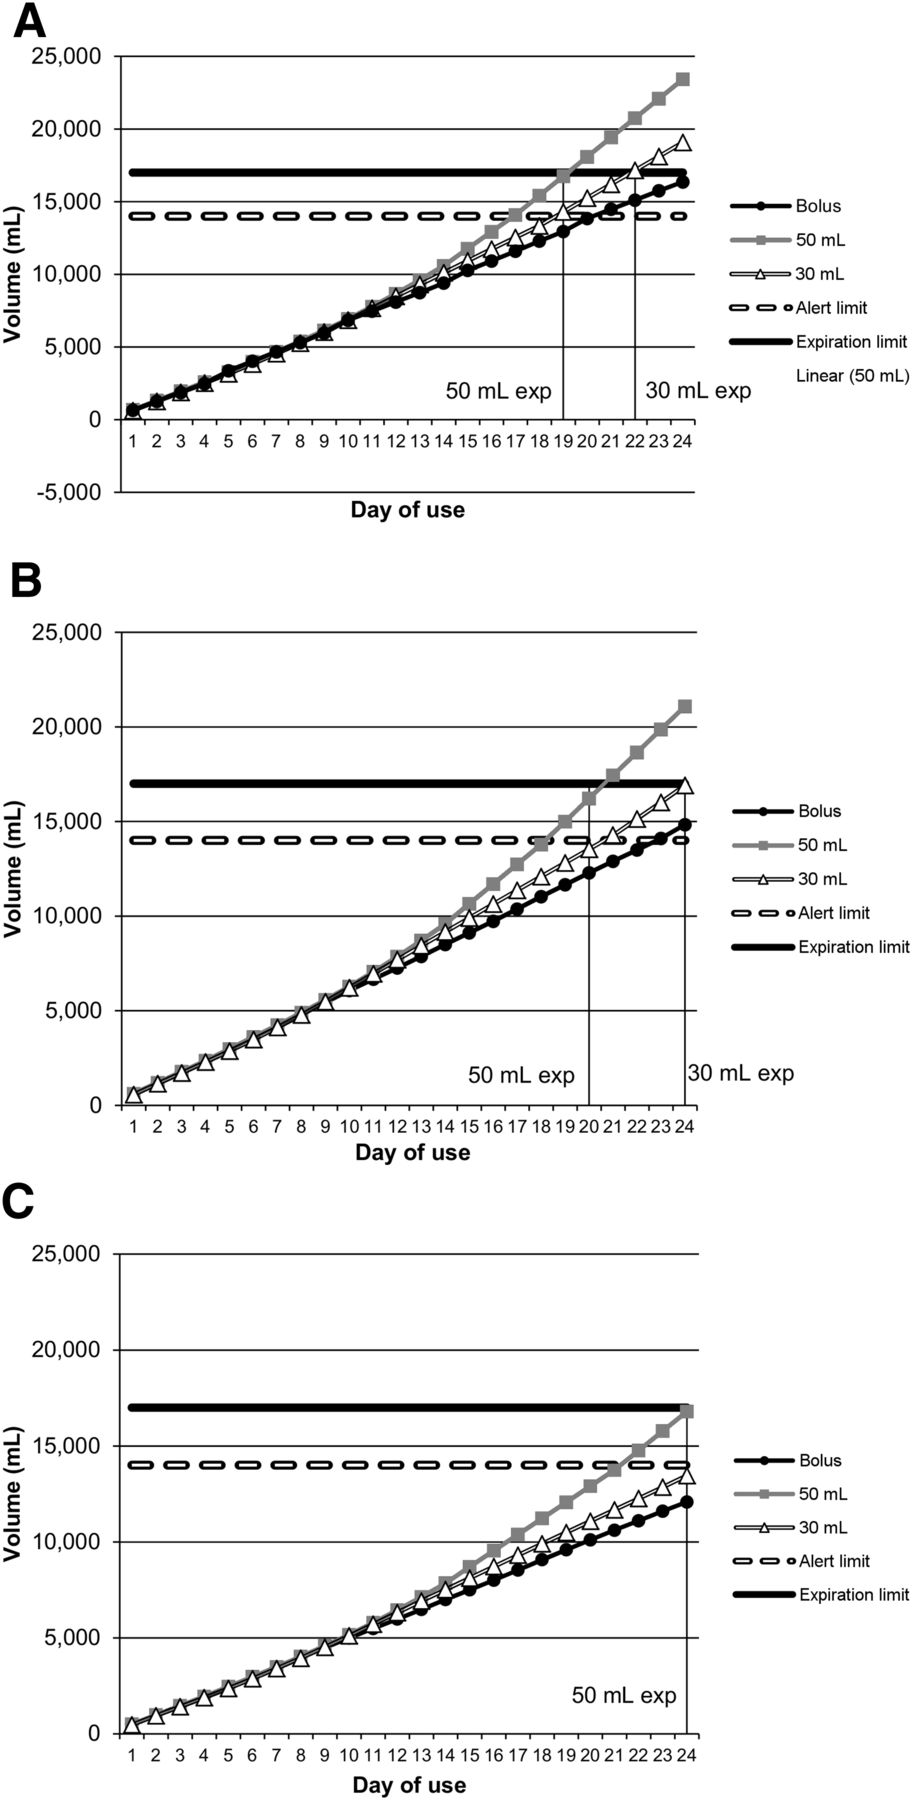
Total estimated volume use for each examination volume and QA simulation. (A) 204 examinations. (B) 180 examinations. (C) 138 examinations.
As shown in Figure 4, when a volume of 204 examinations plus QA volume over 24 d of use was used, the bolus method would be above the alert limit on day 21 but would not reach the 17-L expiration limit. The 30- and 50-mL method would both hit the expiration volume limits before the end of the 24-d usage. The 30 mL would expire on day 22 and the 50 mL on day 19.
When 180 examinations plus QA volume over 24 d of use was used, the 30-mL method would not expire for the entire 24-d period, the 1,850-MBq (50-mCi) method would expire on day 20, and the bolus method would reach the alert limit on day 23.
And last, the maximum volume that could be used to prevent the 50-mL method from expiring in 24 d of use was 138 examinations plus QA volume (Fig. 4).
DISCUSSION
All 3 methods for augmenting the 82Rb CardioGen-82 Infusion System produced different outcomes for patient dose, image counts, and generator volume use. The standard 50-mL method ensured the maximum amount of counts available for imaging throughout the life of the generator. The bolus method provided a consistent and predictable amount of volume use. The volume-limiting 30-mL method represented a compromise between volume predictability and count preservation.
CONCLUSION
Each infusion method affects patient dose, image counts, and total generator volume use. Each infusion method should be reviewed internally to determine which meets the needs of the individual patient care setting based on the past or expected patient volume at each site. We currently use the 50-mL method to produce images with the greatest amount of statistics.
DISCLOSURE
All research was supported by internal endowment funds of the Weatherhead PET Center for Preventing and Reversing Atherosclerosis and the Weatherhead Endowment of the University of Texas Health Science Center, Houston, Texas. This study was also supported by internal funding from the Weatherhead PET Center for Preventing and Reversing Atherosclerosis. Nils P. Johnson has signed nonfinancial, nondisclosure agreements with St. Jude Medical and Volcano Corporation to discuss coronary physiology projects and has received significant institutional research support from both companies. K. Lance Gould is the 510(k) applicant for cfrQuant approved by the FDA. He has arranged that all his royalties permanently go to a University of Texas scholarship fund. UT has a commercial nonexclusive agreement with Positron Corporation to distribute and market cfrQuant in exchange for royalties. However, K. Lance Gould retains the ability to distribute cost-free versions to selected collaborators for research. Additionally, K. Lance Gould has signed a nonfinancial, mutual nondisclosure agreement with Volcano Corporation and St. Jude Medical (makers of FFR pressure wires) to discuss coronary physiology projects and has research support from these companies to his institution unrelated to PET imaging or any aspect of this manuscript. No other potential conflict of interest relevant to this article was reported.
Footnotes
-
Published online May 8, 2015.
- Received for publication December 4, 2014.
- Accepted for publication April 2, 2015.


Jump to section
Related Articles
Cited By...
- No citing articles found.