
Main menu

  • Home
  • Content
    • Current
      • JNMT Supplement
    • Ahead of print
    • Past Issues
    • Continuing Education
    • JNMT Podcast
    • SNMMI Annual Meeting Abstracts
  • Subscriptions
    • Subscribers
    • Rates
    • Journal Claims
    • Institutional and Non-member
  • Authors
    • Submit to JNMT
    • Information for Authors
    • Assignment of Copyright
    • AQARA Requirements
  • Info
    • Reviewers
    • Permissions
    • Advertisers
    • Corporate & Special Sales
  • About
    • About Us
    • Editorial Board
    • Contact Information
  • More
    • Alerts
    • Feedback
    • Help
    • SNMMI Journals
  • SNMMI
    • JNMT
    • JNM
    • SNMMI Journals
    • SNMMI

User menu

  • Subscribe
  • My alerts
  • Log in
  • My Cart

Search

  • Advanced search
Journal of Nuclear Medicine Technology
  • SNMMI
    • JNMT
    • JNM
    • SNMMI Journals
    • SNMMI
  • Subscribe
  • My alerts
  • Log in
  • My Cart
Journal of Nuclear Medicine Technology

Advanced Search

  • Home
  • Content
    • Current
    • Ahead of print
    • Past Issues
    • Continuing Education
    • JNMT Podcast
    • SNMMI Annual Meeting Abstracts
  • Subscriptions
    • Subscribers
    • Rates
    • Journal Claims
    • Institutional and Non-member
  • Authors
    • Submit to JNMT
    • Information for Authors
    • Assignment of Copyright
    • AQARA Requirements
  • Info
    • Reviewers
    • Permissions
    • Advertisers
    • Corporate & Special Sales
  • About
    • About Us
    • Editorial Board
    • Contact Information
  • More
    • Alerts
    • Feedback
    • Help
    • SNMMI Journals
  • Watch or Listen to JNMT Podcast
  • Visit SNMMI on Facebook
  • Join SNMMI on LinkedIn
  • Follow SNMMI on Twitter
  • Subscribe to JNMT RSS feeds
Research ArticleIMAGING

Effect of Varying Number of OSEM Subsets on PET Lesion Detectability

A. Michael Morey and Dan J. Kadrmas
Journal of Nuclear Medicine Technology December 2013, 41 (4) 268-273; DOI: https://doi.org/10.2967/jnmt.113.131904
A. Michael Morey
Department of Radiology, Utah Center for Advanced Imaging Research (UCAIR), and Department of Bioengineering, University of Utah, Salt Lake City, Utah
  • Find this author on Google Scholar
  • Find this author on PubMed
  • Search for this author on this site
Dan J. Kadrmas
Department of Radiology, Utah Center for Advanced Imaging Research (UCAIR), and Department of Bioengineering, University of Utah, Salt Lake City, Utah
  • Find this author on Google Scholar
  • Find this author on PubMed
  • Search for this author on this site
  • Article
  • Figures & Data
  • Info & Metrics
  • PDF
Loading

Article Figures & Data

Figures

  • Tables
  • FIGURE 1.
    • Download figure
    • Open in new tab
    • Download powerpoint
    FIGURE 1.

    Whole-body phantom, shown on PET/CT scanner table (top), consists of brain compartment; thorax with liver, lungs, and rib cage/spine; and pelvis with bladder. It models patient of approximately 92 kg. Coronal CT (bottom left) and PET (bottom right) images show main phantom compartments and structures. Example lesions can also be seen in PET image in both lungs, mediastinum, and pelvis regions.
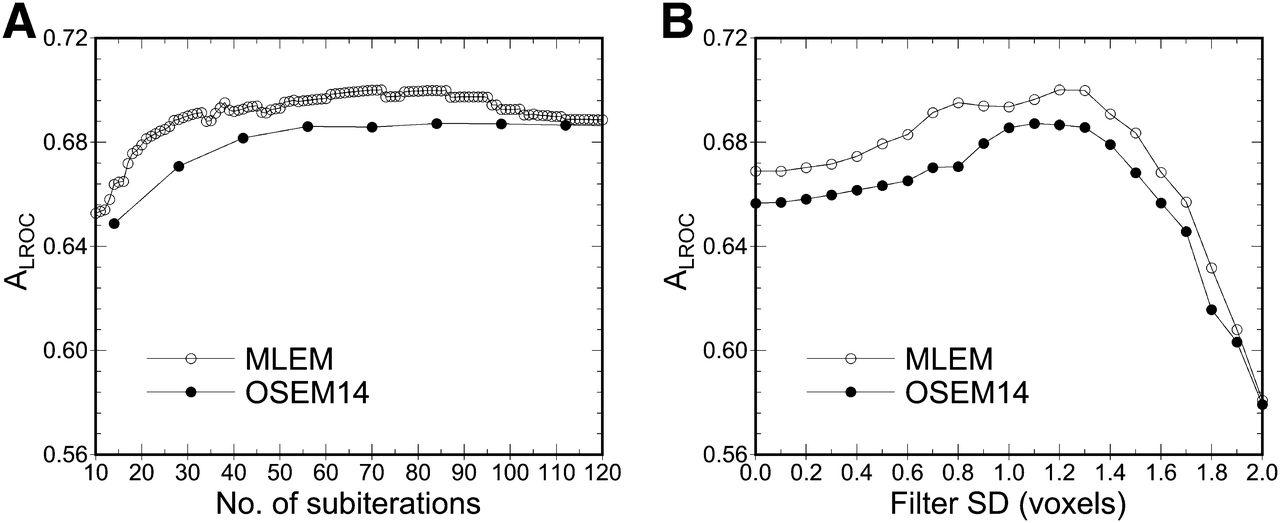
  • FIGURE 2.
    • Download figure
    • Open in new tab
    • Download powerpoint
    FIGURE 2.

    Example analysis results used for selecting number of iterations and filter strength for each case studied. Plot on left (A) shows ALROC vs. subiteration for MLEM and OSEM14 (where 1 subiteration represents 1 full pass through data; i.e., 1 iteration MLEM = 1 subiteration, and 1 iteration OSEM14 = 14 subiterations). Here, data are shown for filter that maximized ALROC at each subiteration. Analogous plot on right (B) shows ALROC vs. filter SD, where each datum is shown for number of iterations that maximized ALROC for that filter strength. These data represent portion of multidimensional sampling used to optimize number of iterations and filter strength for phantom data used in this work.
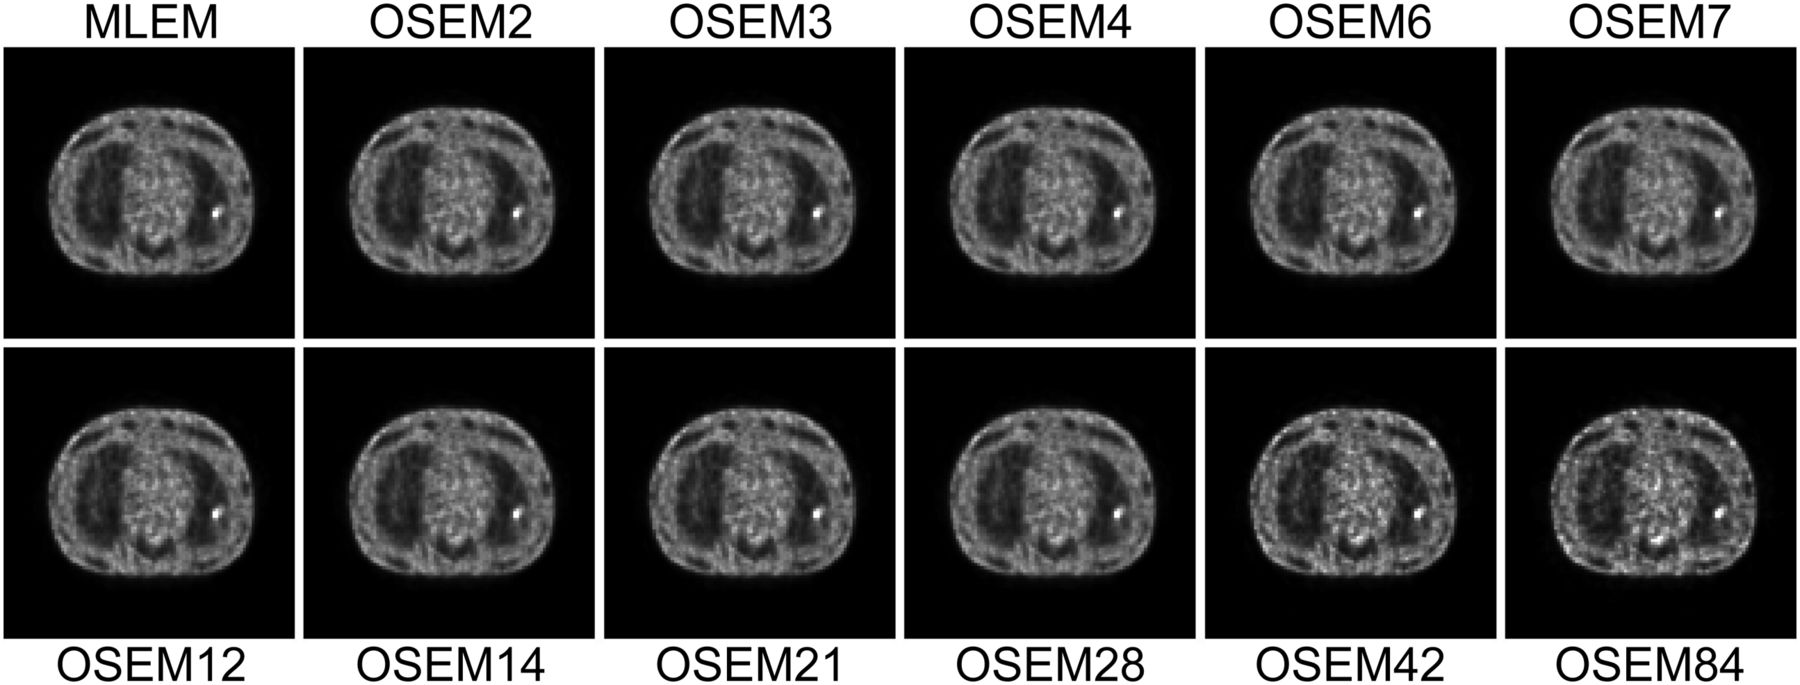
  • FIGURE 3.
    • Download figure
    • Open in new tab
    • Download powerpoint
    FIGURE 3.

    Example reconstructed images with TOF for each number of OSEM subsets, showing slice in mediastinum with 10-mm-diameter hot lesion in left lung. Each image is shown at approximately 56 MLEM-equivalent iterations. Increasing noise and subtle shape-related artifacts can be observed in images as number of subsets increases.
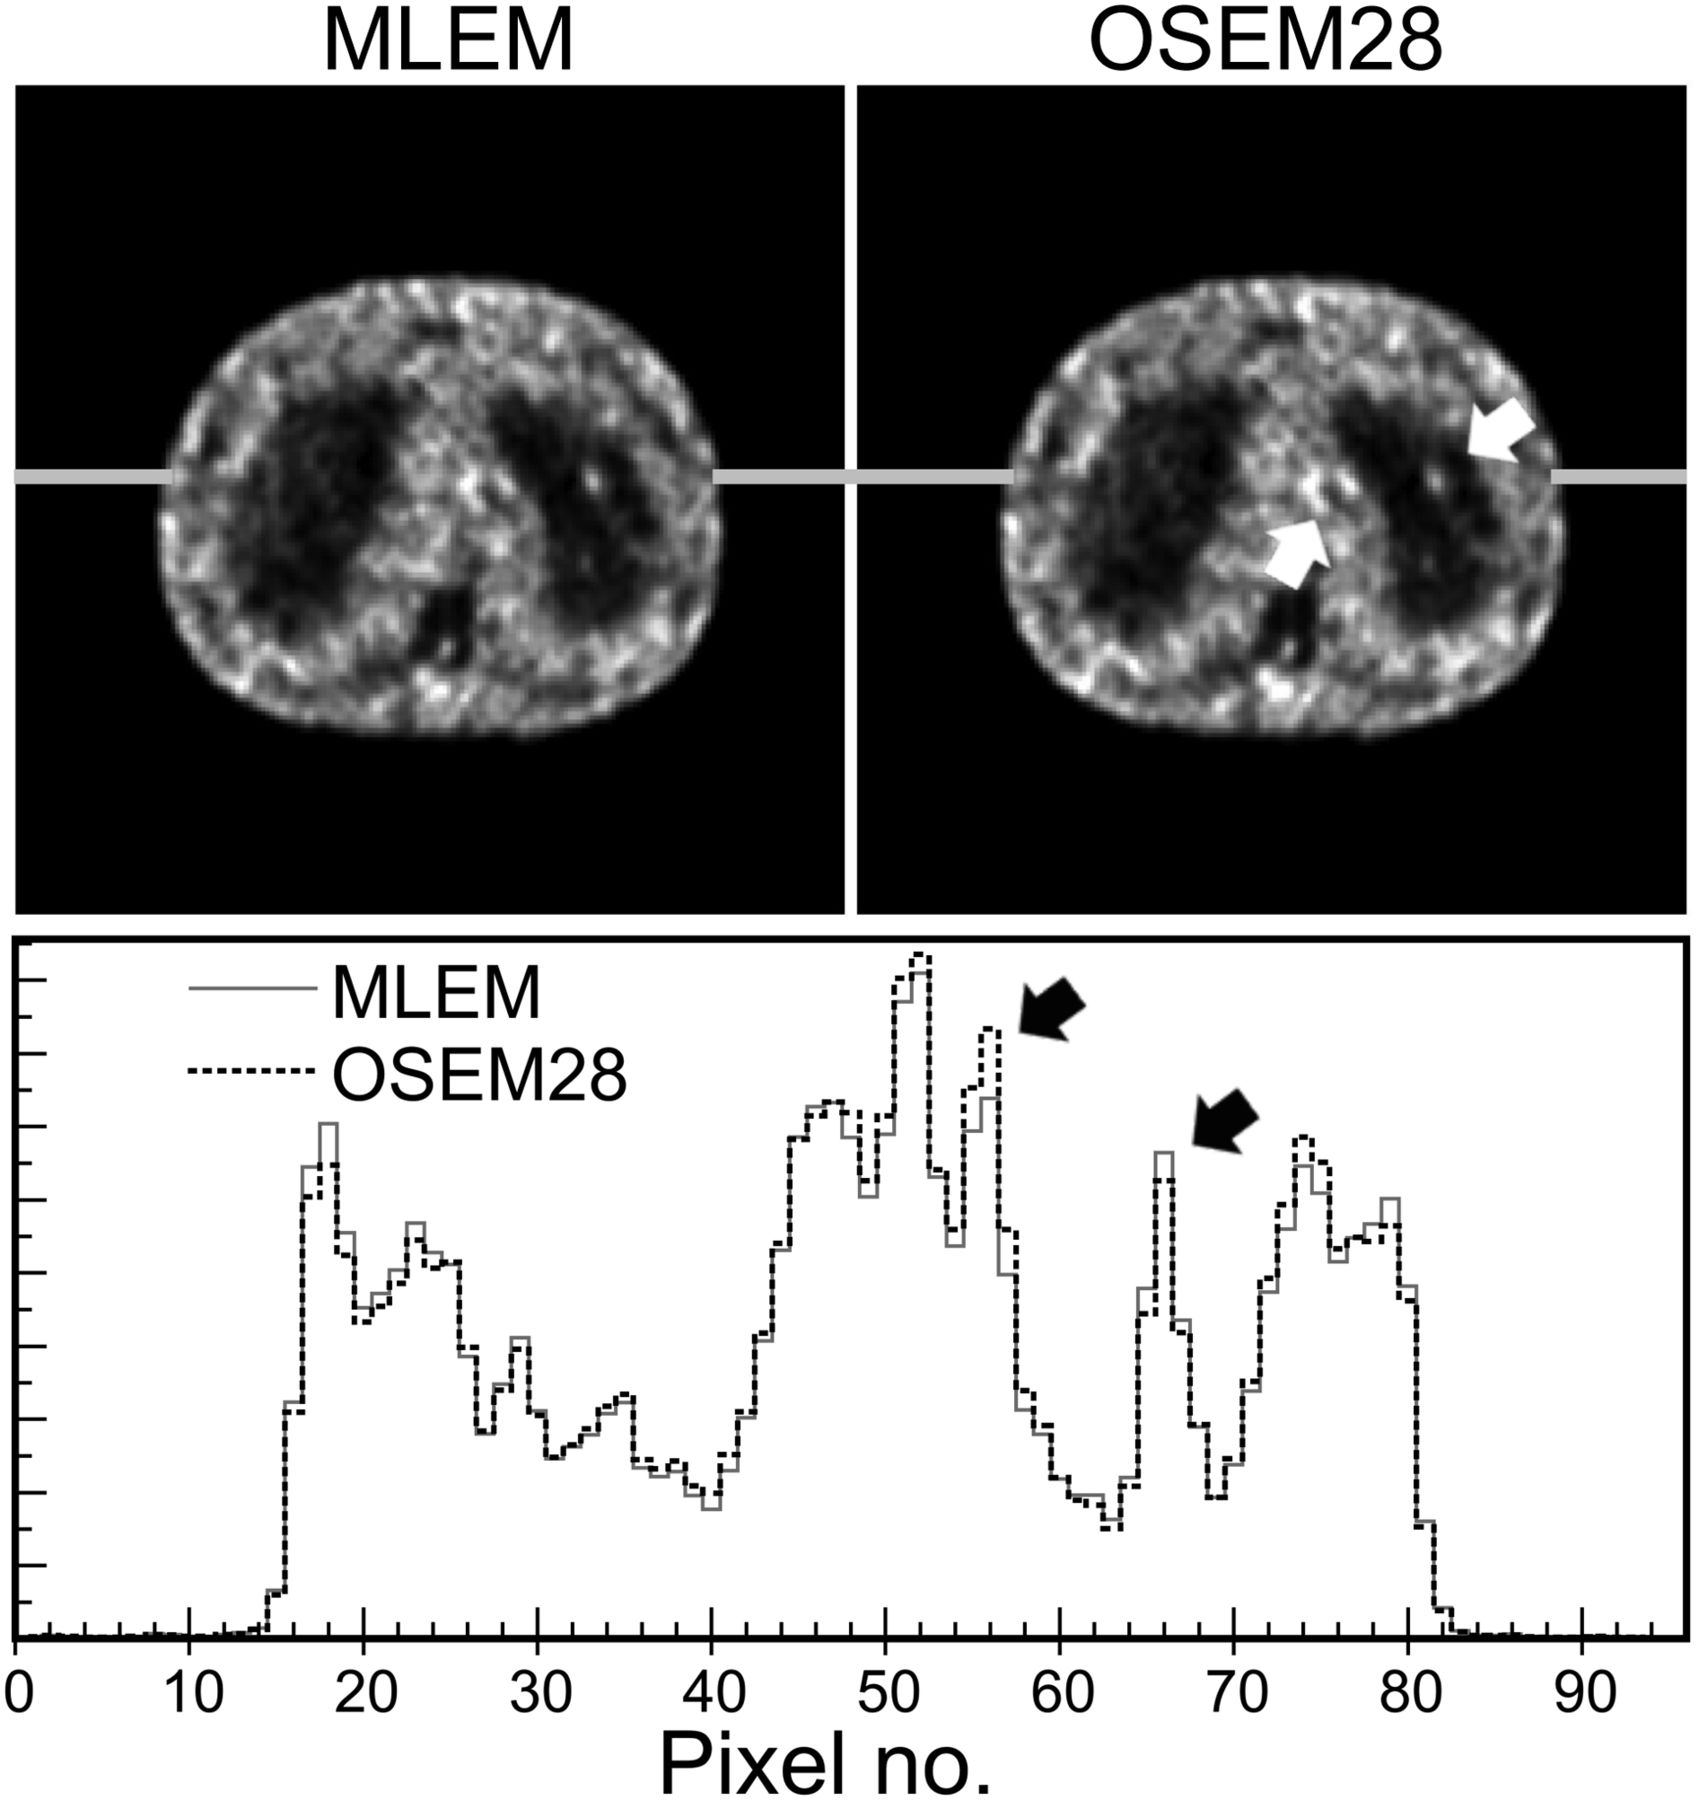
  • FIGURE 4.
    • Download figure
    • Open in new tab
    • Download powerpoint
    FIGURE 4.

    Example TOF images for MLEM and OSEM28 with optimal iteration and filter as determined by this study, demonstrating potential effects on lesion detectability. Focus in left lung is true 8-mm hot lesion, and foci in mediastinum are noise artifacts. Horizontal profiles showing relative intensity (arbitrary units) demonstrate that OSEM28 resulted in loss of contrast for lung lesion (right black arrow), coupled with increase in contrast for mediastinal noise blobs (left black arrow), as compared with MLEM. This example represents case in which observer identified correct (lung) lesion on MLEM image (i.e., true-positive reading) but misidentified mediastinal noise blob as lesion on OSEM28 image (i.e., false-positive).
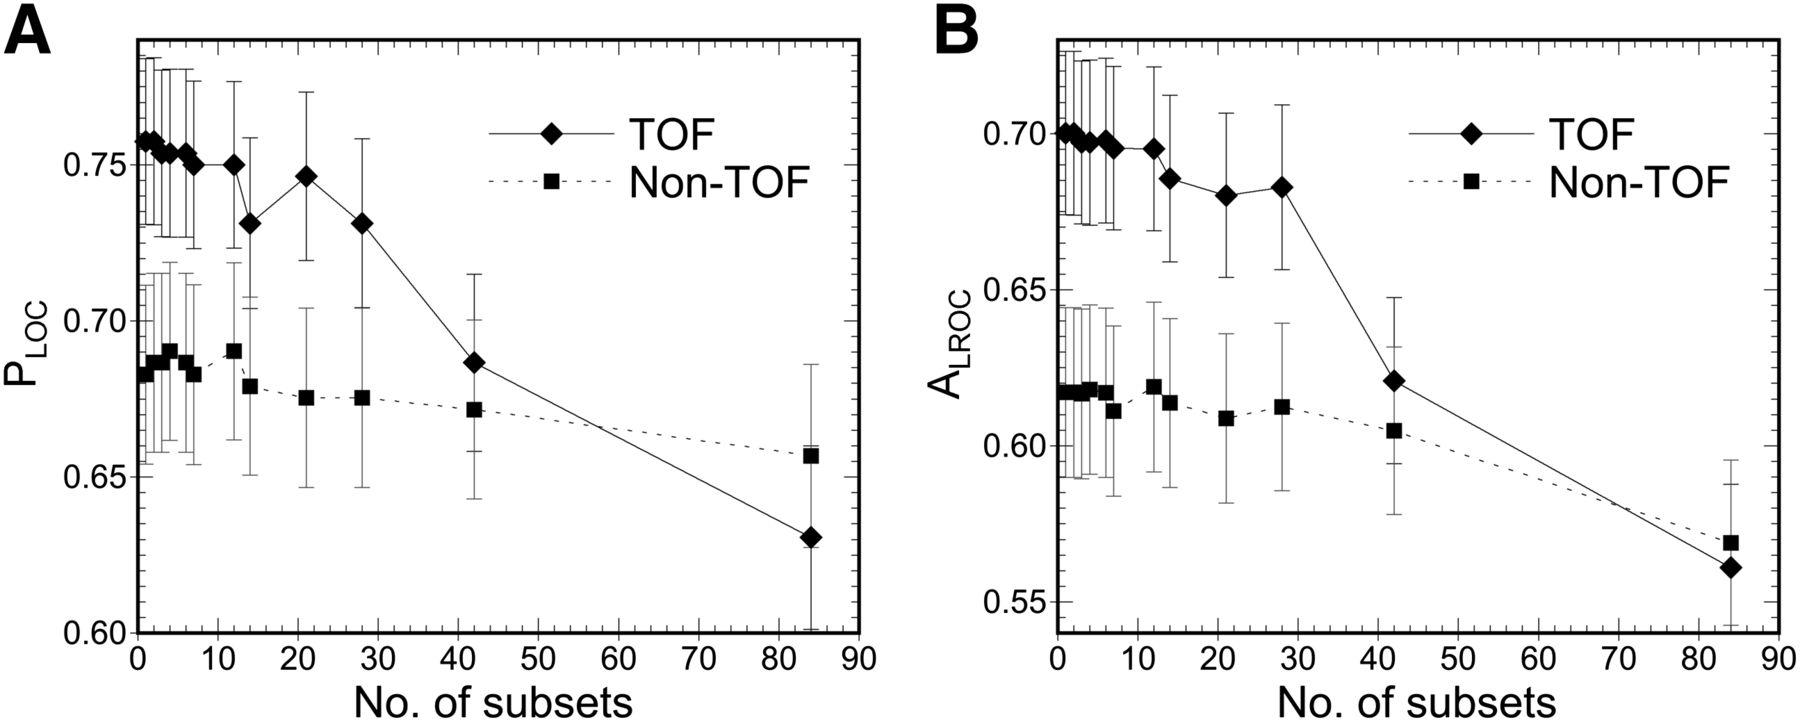
  • FIGURE 5.
    • Download figure
    • Open in new tab
    • Download powerpoint
    FIGURE 5.

    Lesion-detection performance, as measured by PLOC (A) and ALROC (B), plotted as function of number of OSEM subsets for both TOF and non-TOF reconstructions. Performance declined overall as number of subsets increased, with marked drop in performance beyond approximately 28 subsets. For TOF reconstructions, performance drop at 42 subsets effectively canceled benefit of TOF.
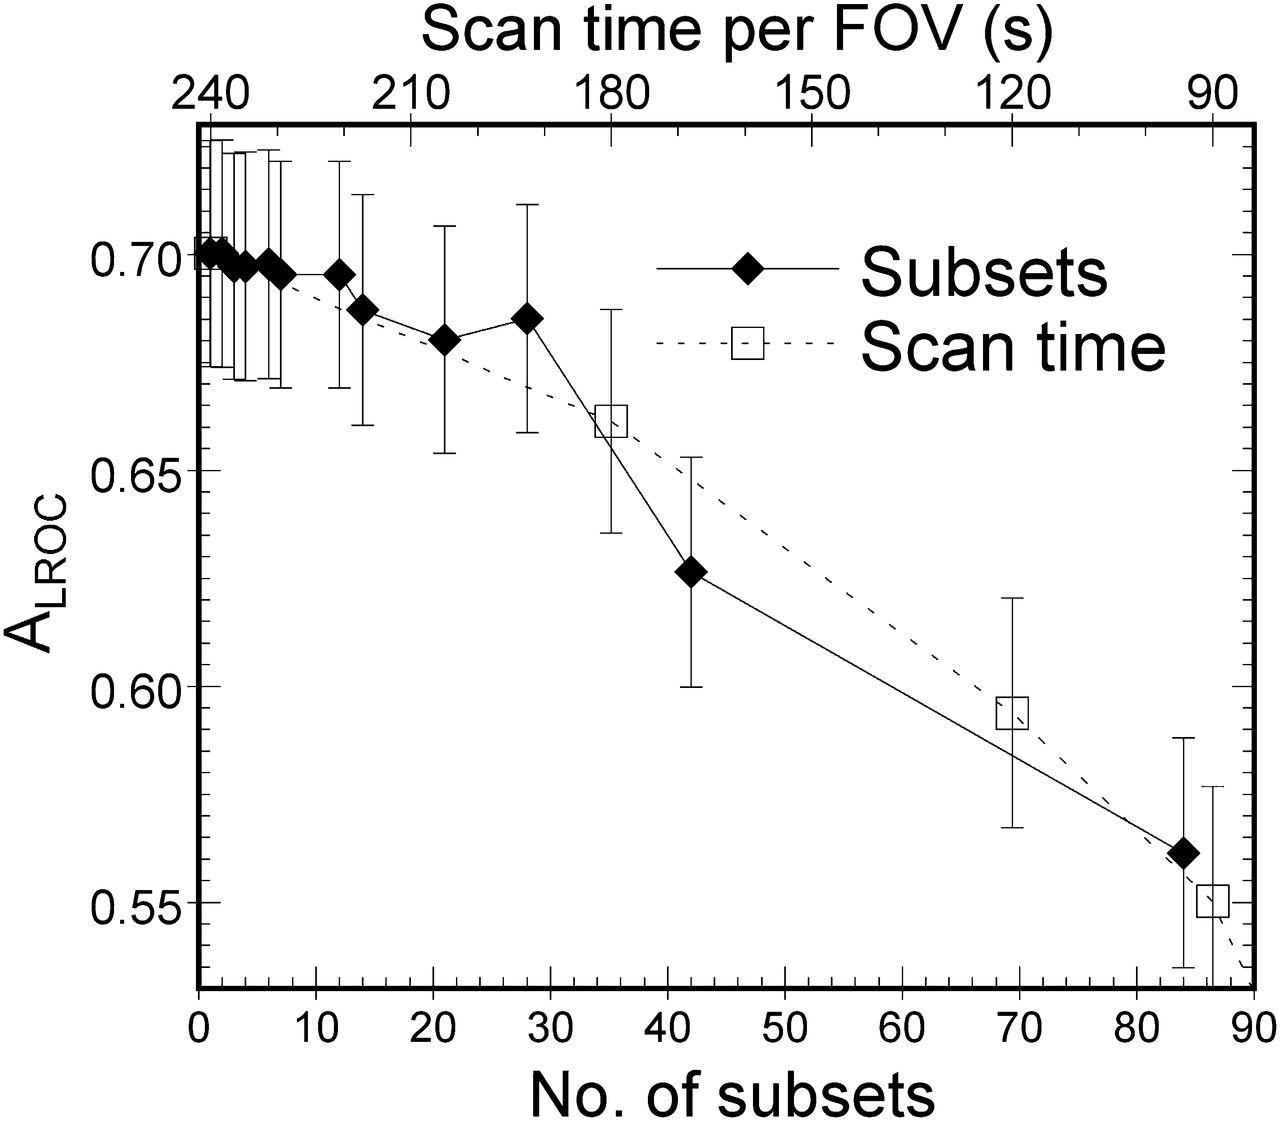
  • FIGURE 6.
    • Download figure
    • Open in new tab
    • Download powerpoint
    FIGURE 6.

    Comparison of how lesion-detection performance, as quantified by ALROC, is affected by increasing number of OSEM subsets or decreasing scan time for TOF reconstructions. These data provide context for interpreting significance of changes in ALROC observed in this work. For example, use of approximately 32 subsets would result in same loss of performance as shortening scan time from 240 to 180 s per bed position.

Tables

  • Figures
    • View popup
    TABLE 1

    Selected Reconstruction Parameters

    Non-TOFTOF
    No. of subsetsNo. of iterationsFilter SD (voxels)No. of iterationsFilter SD (voxels)
    11201.3721.2
    2581.3361.2
    3371.4231.2
    4241.2211.2
    6191.470.9
    7181.4131.3
    12101.351.2
    14101.561.1
    2171.230.9
    2871.431.2
    4241.220.8
    8451.310.8
PreviousNext
Back to top

In this issue

Journal of Nuclear Medicine Technology: 41 (4)
Journal of Nuclear Medicine Technology
Vol. 41, Issue 4
December 1, 2013
  • Table of Contents
  • About the Cover
  • Index by author
Print
Download PDF
Article Alerts
Sign In to Email Alerts with your Email Address
Email Article

Thank you for your interest in spreading the word on Journal of Nuclear Medicine Technology.

NOTE: We only request your email address so that the person you are recommending the page to knows that you wanted them to see it, and that it is not junk mail. We do not capture any email address.

Enter multiple addresses on separate lines or separate them with commas.
Effect of Varying Number of OSEM Subsets on PET Lesion Detectability
(Your Name) has sent you a message from Journal of Nuclear Medicine Technology
(Your Name) thought you would like to see the Journal of Nuclear Medicine Technology web site.
Citation Tools
Effect of Varying Number of OSEM Subsets on PET Lesion Detectability
A. Michael Morey, Dan J. Kadrmas
Journal of Nuclear Medicine Technology Dec 2013, 41 (4) 268-273; DOI: 10.2967/jnmt.113.131904

Citation Manager Formats

  • BibTeX
  • Bookends
  • EasyBib
  • EndNote (tagged)
  • EndNote 8 (xml)
  • Medlars
  • Mendeley
  • Papers
  • RefWorks Tagged
  • Ref Manager
  • RIS
  • Zotero
Share
Effect of Varying Number of OSEM Subsets on PET Lesion Detectability
A. Michael Morey, Dan J. Kadrmas
Journal of Nuclear Medicine Technology Dec 2013, 41 (4) 268-273; DOI: 10.2967/jnmt.113.131904
Twitter logo Facebook logo LinkedIn logo Mendeley logo
  • Tweet Widget
  • Facebook Like
  • Google Plus One
Bookmark this article

Jump to section

  • Article
    • Abstract
    • MATERIALS AND METHODS
    • RESULTS
    • DISCUSSION
    • CONCLUSION
    • DISCLOSURE
    • Acknowledgments
    • Footnotes
    • REFERENCES
  • Figures & Data
  • Info & Metrics
  • PDF

Related Articles

  • No related articles found.
  • PubMed
  • Google Scholar

Cited By...

  • Image Quality of Cardiac Silicon Photomultiplier PET/CT Using an Infant Phantom of Extremely Low Birth Weight
  • Clinical Impact of Respiratory Motion Correction in Simultaneous PET/MR, Using a Joint PET/MR Predictive Motion Model
  • Google Scholar

More in this TOC Section

  • Early 10-Minute Postinjection [18F]F-FAPI-42 uEXPLORER Total-Body PET/CT Scanning Protocol for Staging Lung Cancer Using HYPER Iterative Reconstruction
  • Single- Versus Dual-Time-Point Imaging for Transthyretin Cardiac Amyloid Using 99mTc-Pyrophosphate
  • Monte Carlo Simulation of Characteristics of Discovery NM/CT 670 Pro SPECT System for Routinely Used Diagnostic and Therapeutic Radionuclides
Show more Imaging

Similar Articles

Keywords

  • positron emission tomography (PET)
  • OSEM
  • lesion detection
  • observer study
  • LROC
SNMMI

© 2025 SNMMI

Powered by HighWire