


Abstract
Iterative reconstruction has become the standard for routine clinical PET imaging. However, iterative reconstruction is computationally expensive, especially for time-of-flight (TOF) data. Block-iterative algorithms such as ordered-subsets expectation maximization (OSEM) are commonly used to accelerate the reconstruction. There is a tradeoff between the number of subsets and reconstructed image quality. The objective of this work was to evaluate the effect of varying the number of OSEM subsets on lesion detection for general oncologic PET imaging. Methods: Experimental phantom data were taken from the Utah PET Lesion Detection Database, modeling whole-body oncologic 18F-FDG PET imaging of a 92-kg patient. The experiment consisted of 24 scans over 4 d on a TOF PET/CT scanner, with up to 23 lesions (diameter, 6–16 mm) distributed throughout the thorax, abdomen, and pelvis. Images were reconstructed with maximum-likelihood expectation maximization (MLEM) and with OSEM using 2–84 subsets. The reconstructions were repeated both with and without TOF. Localization receiver-operating-characteristic (LROC) analysis was applied using the channelized nonprewhitened observer. The observer was first used to optimize the number of iterations and smoothing filter for each case that maximized lesion-detection performance for these data; this was done to ensure that fair comparisons were made with each test case operating near its optimal performance. The probability of correct localization and the area under the LROC curve were then analyzed as functions of the number of subsets to characterize the effect of OSEM on lesion-detection performance. Results: Compared with the baseline MLEM algorithm, lesion-detection performance with OSEM declined as the number of subsets increased. The decline was moderate out to about 12–14 subsets and then became progressively steeper as the number of subsets increased. Comparing TOF with non-TOF results, the magnitude of the performance drop was larger for TOF reconstructions. Conclusion: PET lesion-detection performance is degraded when OSEM is used with a large number of subsets. This loss of image quality can be controlled using a moderate number of subsets (e.g., 12–14 or fewer), retaining a large degree of acceleration while maintaining high image quality. The use of more aggressive subsetting can result in image quality degradations that offset the benefits of using TOF or longer scan times.
Iterative reconstruction algorithms that model Poisson statistics have become the standard for routine clinical PET imaging. Maximum-likelihood expectation maximization (MLEM) is the foundational algorithm; however, it is computationally expensive and requires many iterations to reach a suitable image. This problem is exacerbated by the emergence of time-of-flight (TOF) imaging, where the computational cost per iteration can be an order of magnitude slower than non-TOF (1). Block-iterative algorithms such as ordered-subsets expectation maximization (OSEM) are widely used to accelerate iterative image reconstruction (2–8). Here, the projection data are divided into subsets that are operated on sequentially during each OSEM iteration. The number of subsets provides the approximate acceleration factor—one iteration of OSEM with N subsets provides an image roughly similar to that from N iterations of MLEM (4–6). However, there is a tradeoff between the number of subsets and image quality. When the number of subsets is large, the size of each subset is small and each contains less tomographic and statistical information, potentially resulting in enhanced noise structures and other subset-related artifacts in the final image (4).
When OSEM is used in the clinic, it is important to understand the tradeoff between increasing the number of subsets (more acceleration) and image quality degradations (noise, artifacts). One approach would be to study how spatial resolution, contrast, and noise are affected by changing the number of subsets; however, these measures of image fidelity do not necessarily predict performance for clinical tasks. The accepted approach for objectively evaluating image quality in PET is to perform task-based assessments in which the different images are evaluated in terms of an observer’s ability to perform a given task, such as detecting a lesion in the image. This task includes both detecting a lesion that is actually present (sensitivity) and correctly ruling out noise blobs that are not lesions (specificity) (9). The objective of this work was to evaluate the relationship between the number of OSEM subsets and image quality in terms of lesion detectability for general oncologic PET imaging with 18F-FDG.
Our group has established techniques for evaluating PET lesion-detection performance using specially designed phantom experiments (10–13), and these data and methodologies have been combined in a resource called the Utah PET Lesion Detection Database Resource (14). The resource consists of experimental data and routines for performing localization receiver-operating-characteristic (LROC) analysis (15–17) with the channelized nonprewhitened (CNPW) numeric observer (18). Model observers such as the CNPW have been shown to correlate with human observers for simple lesion-detection tasks (10,11,18–24), and they offer the ability to quickly and repeatedly review large numbers of images. These data and LROC methods have previously been used to evaluate PET lesion-detection performance when modeling the point spread function (10), using TOF data (11), and reducing scan times (13).
In this work, experimental data from the Utah PET Lesion Detection Database were reconstructed with the MLEM algorithm (i.e., 1 subset) as a baseline and with OSEM using 11 different numbers of subsets (2–84 subsets). The reconstructions were repeated both with and without TOF data. Lesion-detection performance was assessed for each case using the CNPW observer with LROC analysis. The following sections describe the experimental data, reconstruction and data processing, LROC study methods, and results. The effect of increasing the number of OSEM subsets on lesion detectability is then analyzed, and conclusions based on the results are drawn.
MATERIALS AND METHODS
Experimental Data for Lesion-Detection Assessment
The lesion-detectability study used experimental data from the Utah PET Lesion Detection Database (14) for the custom large whole-body phantom scanned on a Biograph mCT TOF PET/CT scanner (Siemens Medical Solutions) with timing resolution of 527.5 ± 4.9 ps (25). The phantom, shown in Figure 1, had 3 main components: a 3-dimensional brain phantom; an anthropomorphic thorax phantom containing liver, lungs, and rib cage; and a pelvis with bladder compartment. The approximate dimensions of the phantom are 43 × 28.0 cm at the widest points, and total length is approximately 83.1 cm. Accounting for the missing mass of the arms and legs, the phantom models an approximately 92-kg patient. The phantom also had several custom modifications designed to increase realism for modeling whole-body oncologic 18F-FDG PET (14).

Whole-body phantom, shown on PET/CT scanner table (top), consists of brain compartment; thorax with liver, lungs, and rib cage/spine; and pelvis with bladder. It models patient of approximately 92 kg. Coronal CT (bottom left) and PET (bottom right) images show main phantom compartments and structures. Example lesions can also be seen in PET image in both lungs, mediastinum, and pelvis regions.
The experiment consisted of 6 back-to-back whole-body scans acquired each day over the 4 d of the experiment. Each whole-body scan acquired list-mode data for 4 min per bed position over 6 bed positions. Three of the 4 d had 21–23 shell-less 68Ge (half-life, 270.8 d) sources modeling lesions (26) with diameters of 6–16 mm distributed throughout the phantom lungs, liver, and soft-tissue compartments (mediastinum, abdomen, pelvis) to model tumors with focal 18F-FDG uptake. On the final day, no lesions were present, providing true-negative images for the observer study. This multiscan protocol provided numerous images and lesions with varying count levels and lesion target-to-background ratios. The overall activity levels for the 6 scans broadly covered the full range of activity levels representative of sites administering 370–555 MBq of 18F-FDG with uptake times ranging from 60 to 120 min.
Image Reconstruction and Processing
The raw scan data, including list-mode files, attenuation maps, scanner calibrations, and scatter and randoms estimates, were loaded to an offline workstation and reconstructed using manufacturer-supplied software (Siemens Medical Solutions). The baseline reconstruction algorithm was ordinary Poisson line-of-response MLEM with spatially variant point-spread function modeling (27), and each scan was reconstructed both with and without TOF. The reconstructed image matrix was 168 × 168, with 4.073-mm pixels and 2.027-mm slice thickness. After reconstructing with MLEM, the reconstructions were repeated using OSEM with every available number of subsets. The sinogram data had 168 angles, and the reconstruction software required that the number of angles per subset be a multiple of 2, giving the following numbers of subsets: 2, 3, 4, 6, 7, 12, 14, 21, 28, 42, and 84. Thus, 12 non-TOF and 12 TOF reconstructions were performed for each scan: MLEM and 11 versions of OSEM covering 2–84 subsets.
One challenge in comparing different OSEM reconstructions is that the rate of iterative convergence depends on the number of subsets, and similarly the noise properties (and hence the best postreconstruction filter) also depend on the number of subsets and iterations. To provide a fair comparison, it was important to objectively select the number of iterations and filter used for each case. The standard approach used with the Utah PET Lesion Detection Database (10–14) is to empirically optimize the number of iterations and postreconstruction filter for each algorithm that maximizes lesion-detection performance for that algorithm. As such, each algorithm was run out to at least 120 MLEM-equivalent iterations (e.g., 20 iterations for OSEM6), with a minimum of 10 iterations for each case, and the intermediate images from each iteration were stored for subsequent processing and analysis. The optimal number of iterations and smoothing filter were then selected using preliminary LROC studies.
The true location of each lesion in the phantom was determined from phantom setup coordinate grids and was confirmed on the CT scans. As reported previously (13), scans 2–5 were found to provide the most clinically representative activity and noise levels, and data from these scans were used for the remainder of the study. This provided a total of 268 lesion-present test images (21–23 lesions × 4 scans/d × 3 d with lesions present) plus 268 corresponding lesion-absent test images (from the scans without lesions) to be used for the LROC study for each reconstruction algorithm.
LROC Analysis
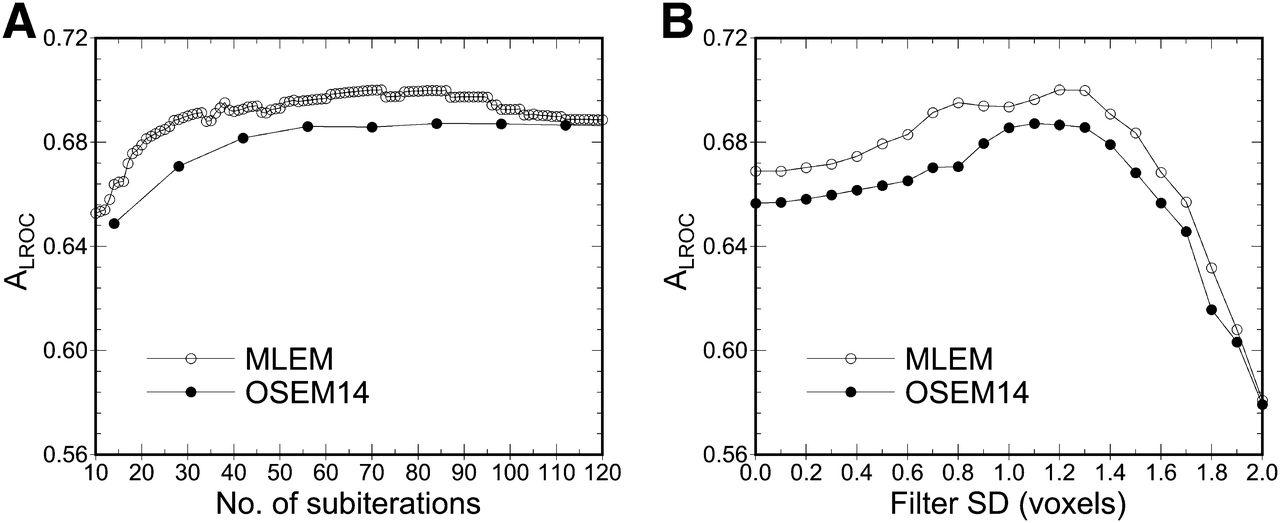
Preliminary LROC studies were first used to select the optimal number of iterations and postreconstruction filter for each algorithm, ensuring that each algorithm was fairly compared at near-maximum performance. Here, 21 different 3-dimensional gaussian filters were applied to the images from each iteration, with SD ranging from 0.0 (no filter) to 2.0 voxels in 0.1-voxel increments. The area under the LROC curve (ALROC) was computed for each iteration–filter combination. Figure 2 shows how ALROC changed as a function of iteration and filter for 2 TOF reconstruction cases and demonstrates that local changes to iteration and filter have minimal effects on ALROC. The iteration and filter that maximized ALROC were identified and selected for each algorithm; these values are listed in Table 1. These parameters maximized ALROC for this particular set of experimental data, and they do not necessarily represent near-optimal or optimal parameters for clinical use. The topic of optimizing the number of iterations and filters for clinical use is large and complex and falls outside the scope of this work.

Example analysis results used for selecting number of iterations and filter strength for each case studied. Plot on left (A) shows ALROC vs. subiteration for MLEM and OSEM14 (where 1 subiteration represents 1 full pass through data; i.e., 1 iteration MLEM = 1 subiteration, and 1 iteration OSEM14 = 14 subiterations). Here, data are shown for filter that maximized ALROC at each subiteration. Analogous plot on right (B) shows ALROC vs. filter SD, where each datum is shown for number of iterations that maximized ALROC for that filter strength. These data represent portion of multidimensional sampling used to optimize number of iterations and filter strength for phantom data used in this work.
Selected Reconstruction Parameters
Empiric selection of the best number of iterations and filters required reading 7,834,176 test images to cover 268 lesion-present and lesion-absent test cases for each algorithm, iteration, and filter. It would not have been feasible to read this many images with human observers; however, the CNPW numeric observer completed this task within a few days. The CNPW observer computes a numeric rating, analogous to a human observer’s confidence level, regarding the presence or absence of a lesion at each image location. The location with the highest rating was selected as the most probable lesion location for the LROC analysis. Additional details on the CNPW observer (18,21) and its training and application to our experimental phantom data (10–13) can be found in the references. As in this prior work, a radius of correct localization equal to 2.5 voxels was found to correctly identify hits while minimizing random localizations and was used throughout this study. Two figures of merit were used to quantify lesion-detection performance: the probability of correct localization (PLOC) and ALROC. PLOC is simply the fraction of lesions correctly localized within the 2.5-voxel threshold. ALROC plots the correctly localized true-positive fraction versus the false-positive fraction, computed from the observer rating data and known truth. Higher values for these measures indicate higher lesion-detection performance.
RESULTS
Example Images
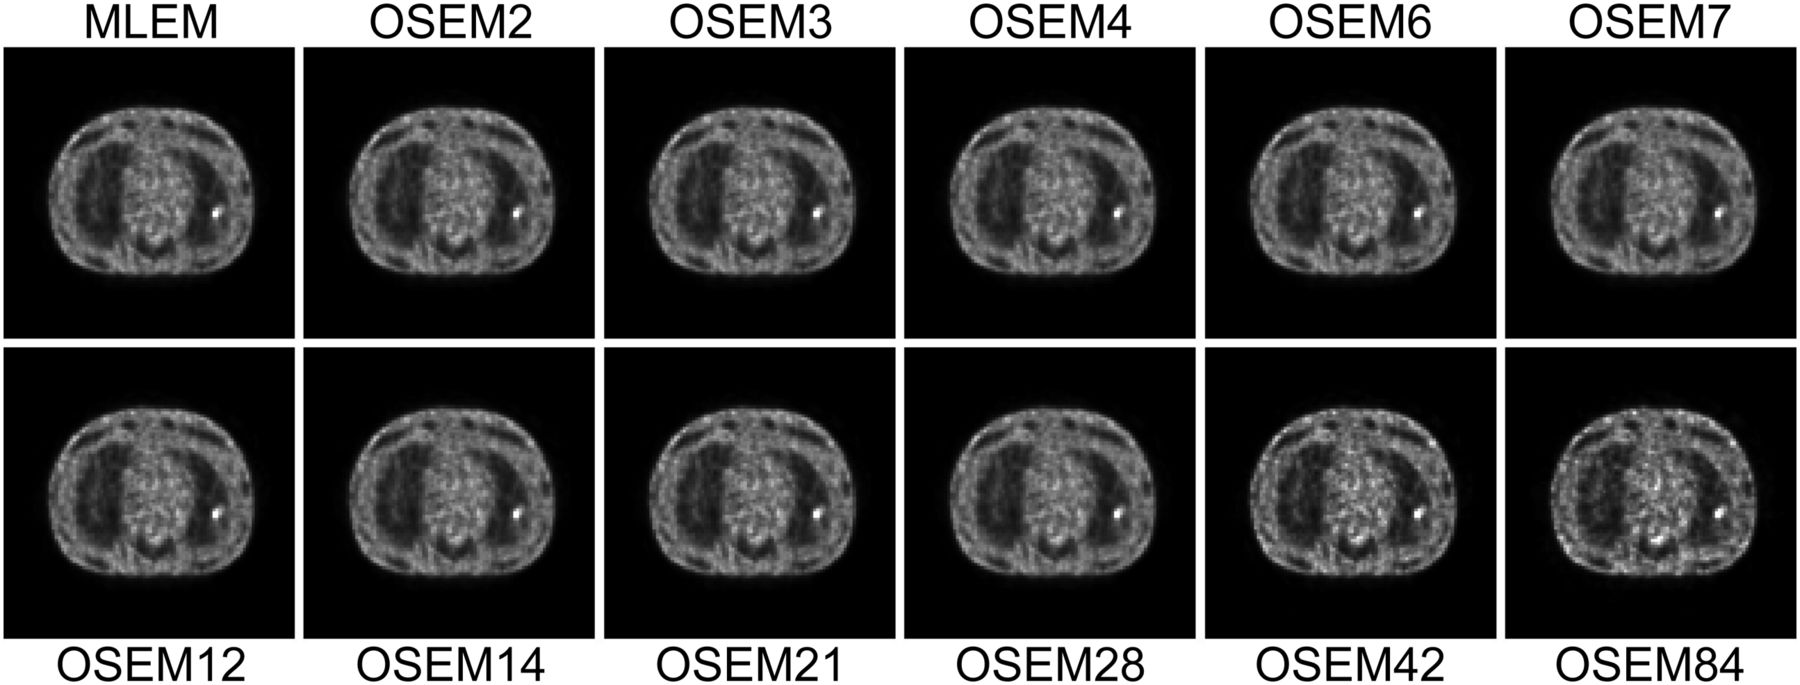
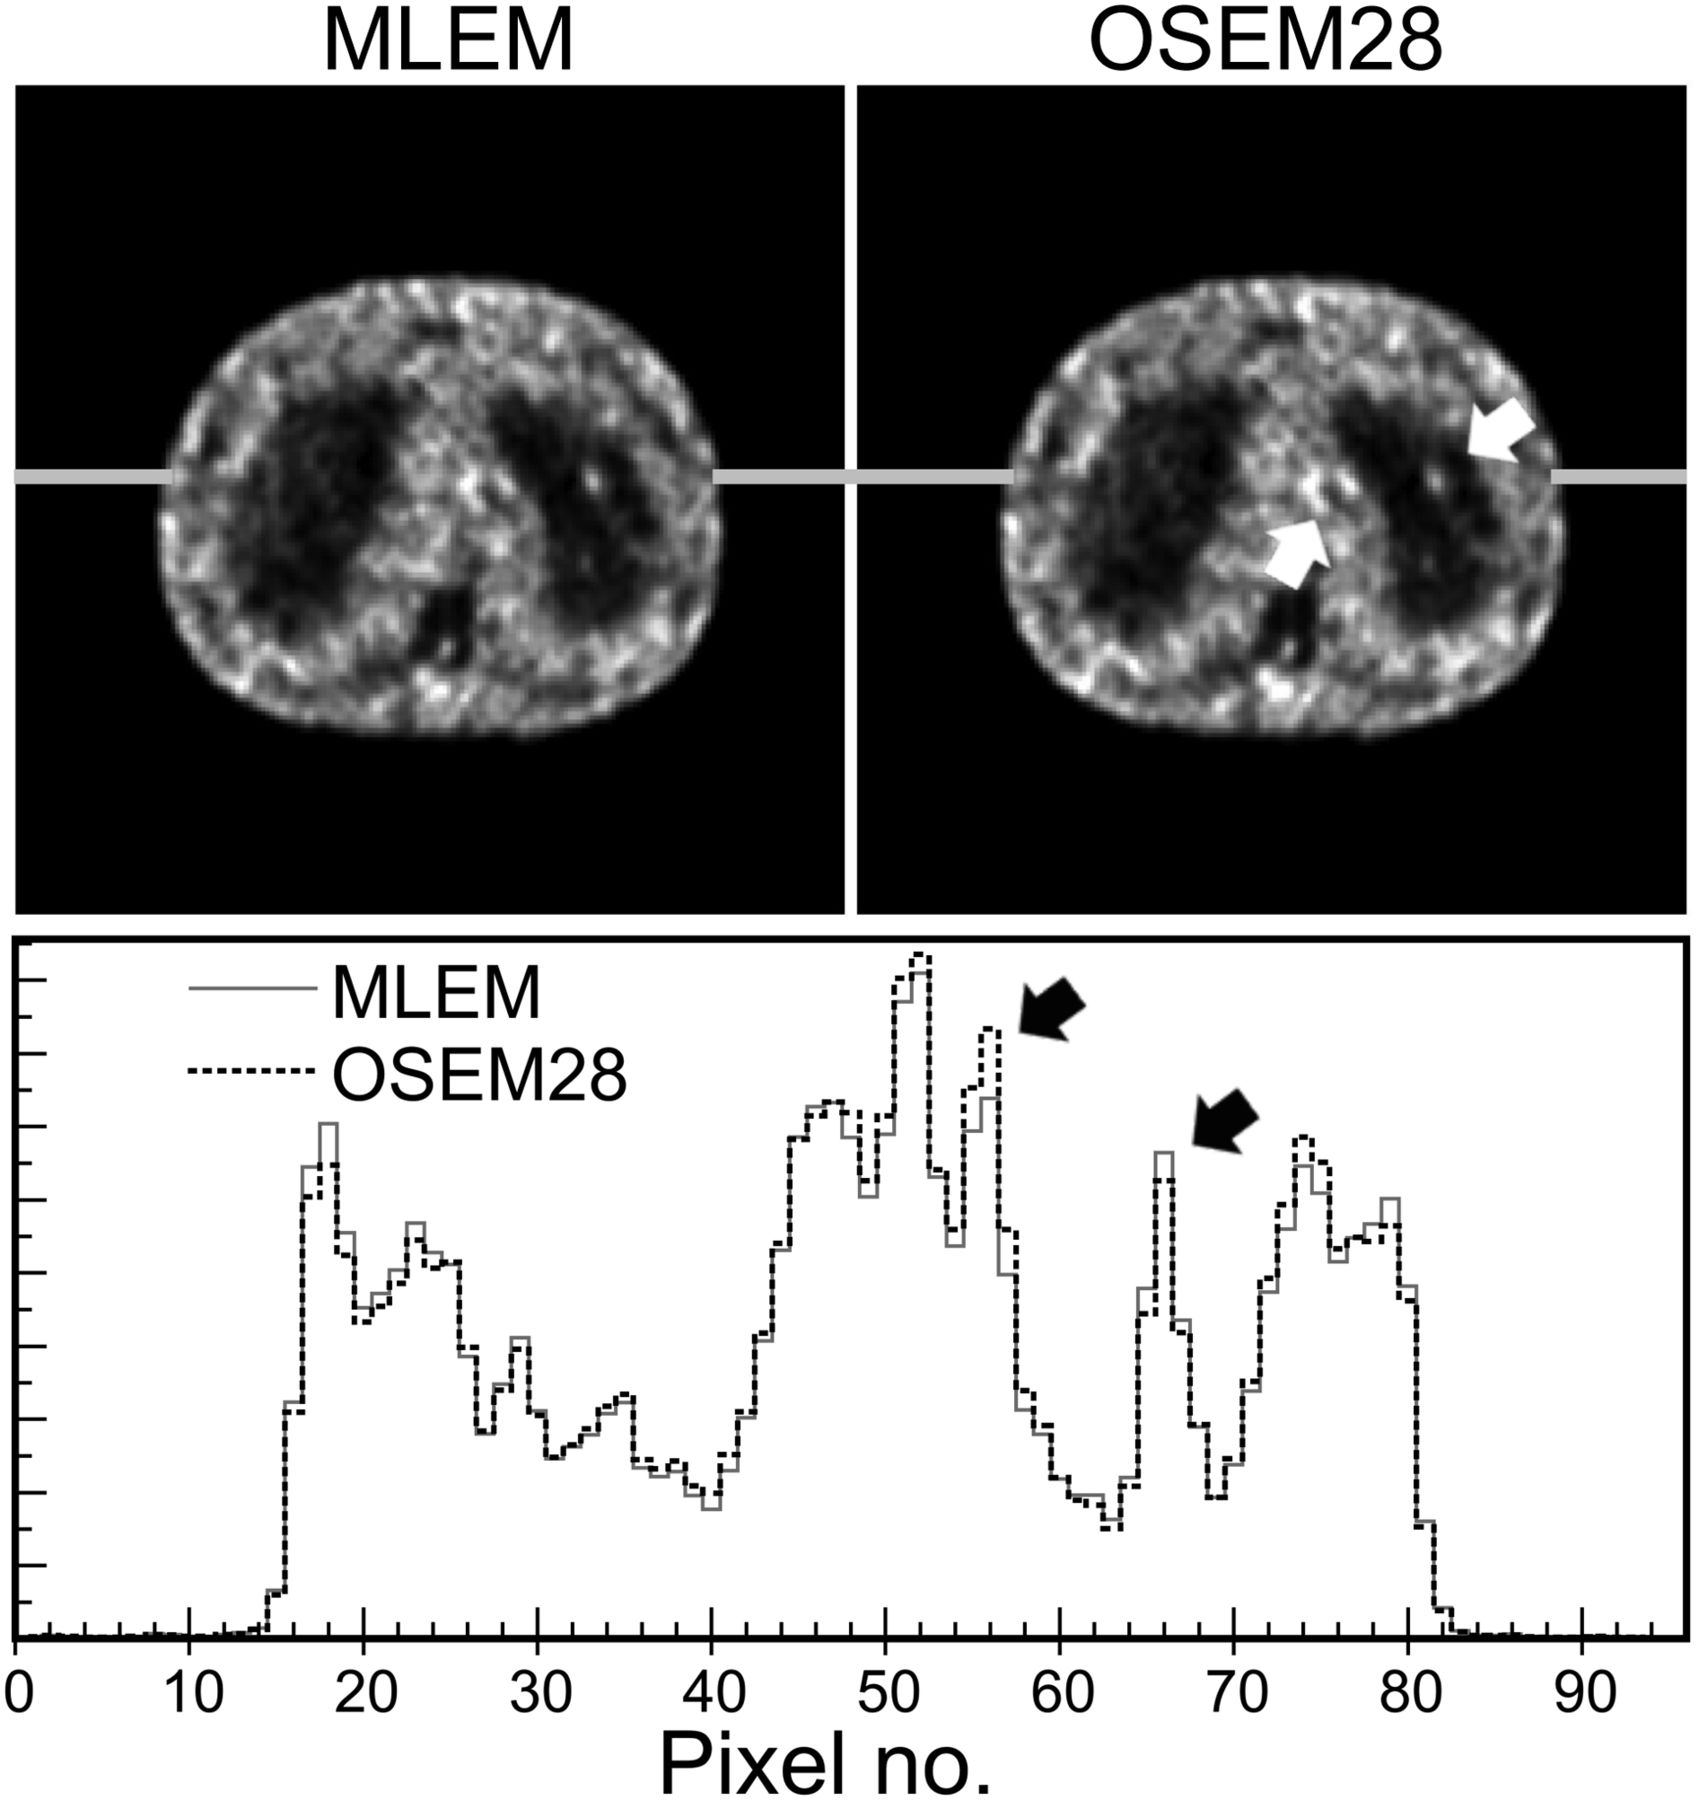
Example images reconstructed for each number of OSEM subsets are shown in Figure 3. The MLEM image provides the baseline for comparison and corresponds to OSEM with 1 subset. Increasing the number of subsets resulted in increased noise and subtle shape artifacts in these images, especially for the highest numbers of subsets. The overall objective of this work was to evaluate how these changes in the images affect lesion-detection performance for general oncologic PET imaging. Consider, for example, the sample images shown in Figure 4. This case had a true 8-mm lesion in the left lung and noise blobs of similar size and contrast in the mediastinum. The use of OSEM with 28 subsets resulted in lower contrast for the true (lung) lesion as compared with MLEM, coupled with increased contrast of the mediastinal noise blob. In this example, the CNPW observer correctly identified the lung lesion (true-positive) on the MLEM image but falsely identified the mediastinal noise blob (false-positive) on the OSEM28 image. This example illustrates how subset-related artifacts can affect lesion-detection performance.

Example reconstructed images with TOF for each number of OSEM subsets, showing slice in mediastinum with 10-mm-diameter hot lesion in left lung. Each image is shown at approximately 56 MLEM-equivalent iterations. Increasing noise and subtle shape-related artifacts can be observed in images as number of subsets increases.

Example TOF images for MLEM and OSEM28 with optimal iteration and filter as determined by this study, demonstrating potential effects on lesion detectability. Focus in left lung is true 8-mm hot lesion, and foci in mediastinum are noise artifacts. Horizontal profiles showing relative intensity (arbitrary units) demonstrate that OSEM28 resulted in loss of contrast for lung lesion (right black arrow), coupled with increase in contrast for mediastinal noise blobs (left black arrow), as compared with MLEM. This example represents case in which observer identified correct (lung) lesion on MLEM image (i.e., true-positive reading) but misidentified mediastinal noise blob as lesion on OSEM28 image (i.e., false-positive).
Lesion Detectability Versus Number of Subsets
Figure 5 presents the main results of this paper, showing how PLOC and ALROC changed as functions of the number of OSEM subsets. Lesion-detection performance declined overall as the number of subsets increased. The decline was moderate out to about 12–14 subsets and then became progressively steeper as the number of subsets increased. When TOF and non-TOF results were compared, the same trend in performance was observed, but the magnitude of the performance drop was much larger for TOF. Overall, these results demonstrate that lesion-detection performance is only slightly degraded when a moderate number of subsets is used, suggesting that acceleration factors of as much as approximately 10 times can be safely attained with OSEM. However, more aggressive subsetting can cause more significant losses in image quality and adversely affect lesion detectability.
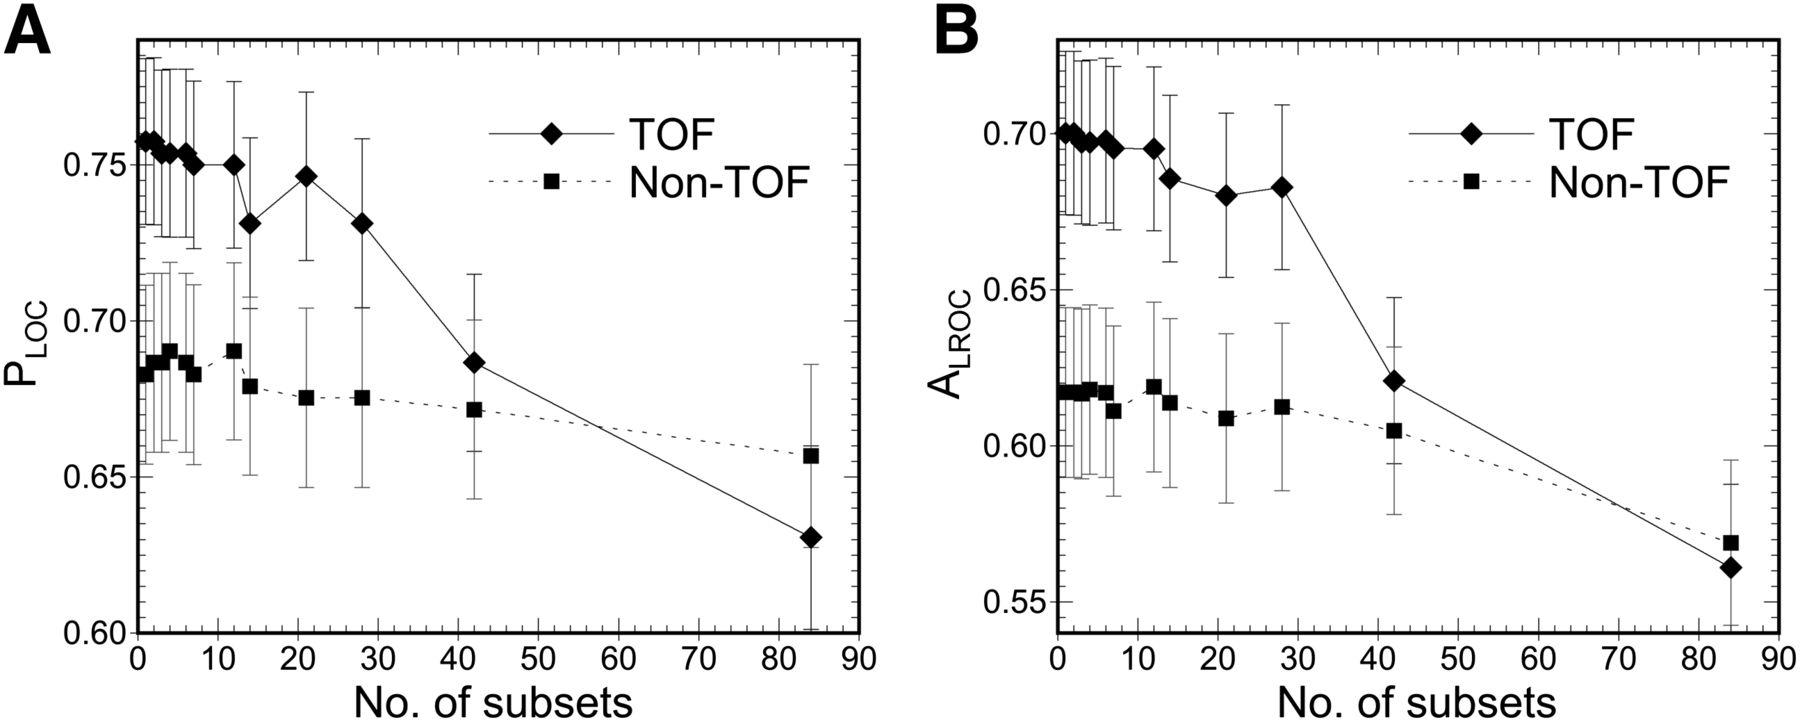
Lesion-detection performance, as measured by PLOC (A) and ALROC (B), plotted as function of number of OSEM subsets for both TOF and non-TOF reconstructions. Performance declined overall as number of subsets increased, with marked drop in performance beyond approximately 28 subsets. For TOF reconstructions, performance drop at 42 subsets effectively canceled benefit of TOF.
DISCUSSION
When LROC studies are performed, it is important to provide a context for interpreting the magnitude of differences in the figures of merit (i.e., in PLOC and ALROC) in clinically relevant terms. The absolute magnitudes of PLOC and ALROC are determined largely by the experimental design. For example, one could include many large, high-contrast lesions that are easily detected—pushing the values of PLOC and ALROC close to one for all algorithms studied. Conversely, one could include many small, low-contrast lesions in the test dataset, resulting in PLOC and ALROC values closer to zero. Ideally, the test dataset would exactly model the clinically encountered distribution, in which case the absolute magnitude of the results would impart clinical meaning; however, such a distribution is not well understood and would vary widely by disease state. Furthermore, such a distribution would include many always-detectable lesions (found by all test algorithms) as well as many invisible lesions (e.g., micrometastases), neither of which would add to the statistical power of the study for differentiating the test algorithms. The lesion test data used here, as for most lesion-detectability studies, were designed to provide high statistical power for differentiating and ranking the test algorithms studied. As such, the differences in the results should be interpreted within a meaningful context.
We provide 2 such contexts in this work. First, the impact of TOF versus non-TOF on PET lesion-detection performance has previously been evaluated in both phantoms and patients and is becoming well understood (11,13,28–30). Comparing the TOF versus non-TOF results in Figure 5, one sees that the TOF reconstruction with 42 subsets provided approximately the same lesion-detection performance as the non-TOF reconstruction with MLEM. In essence, the degradation of using 42 subsets balanced and offset the benefit of using TOF in these data. The degradation from using 28 subsets cost approximately 20% of the benefit of TOF. Although these results should not be construed as exact quantifications, they do provide a context for assessing the significance of the changes observed in the results.
To provide additional context for interpreting the results, we repeated the MLEM TOF reconstructions and computed ALROC as a function of scan time. Here, the raw list-mode PET data files were statistically pruned from 240 s per bed position to 180, 120, and 90 s per bed position (corresponding to whole-body scan times of 24, 18, 12, and 9 min, respectively). The technique was the same as that presented in a previous publication (13). Repeating the LROC analysis for these images, we computed the change in ALROC as a function of scan time for MLEM. The results are shown in Figure 6, plotted alongside the results for changing the number of subsets. Here, using OSEM with 21 subsets was found to result in the same loss of detectability as found for MLEM when the scan time was reduced from 240 to approximately 205 s per bed position. Overall, these data suggest that reconstructing with OSEM up to about 12–14 subsets has only a moderate effect on lesion-detection performance but that using more subsets can result in more significant degradations.
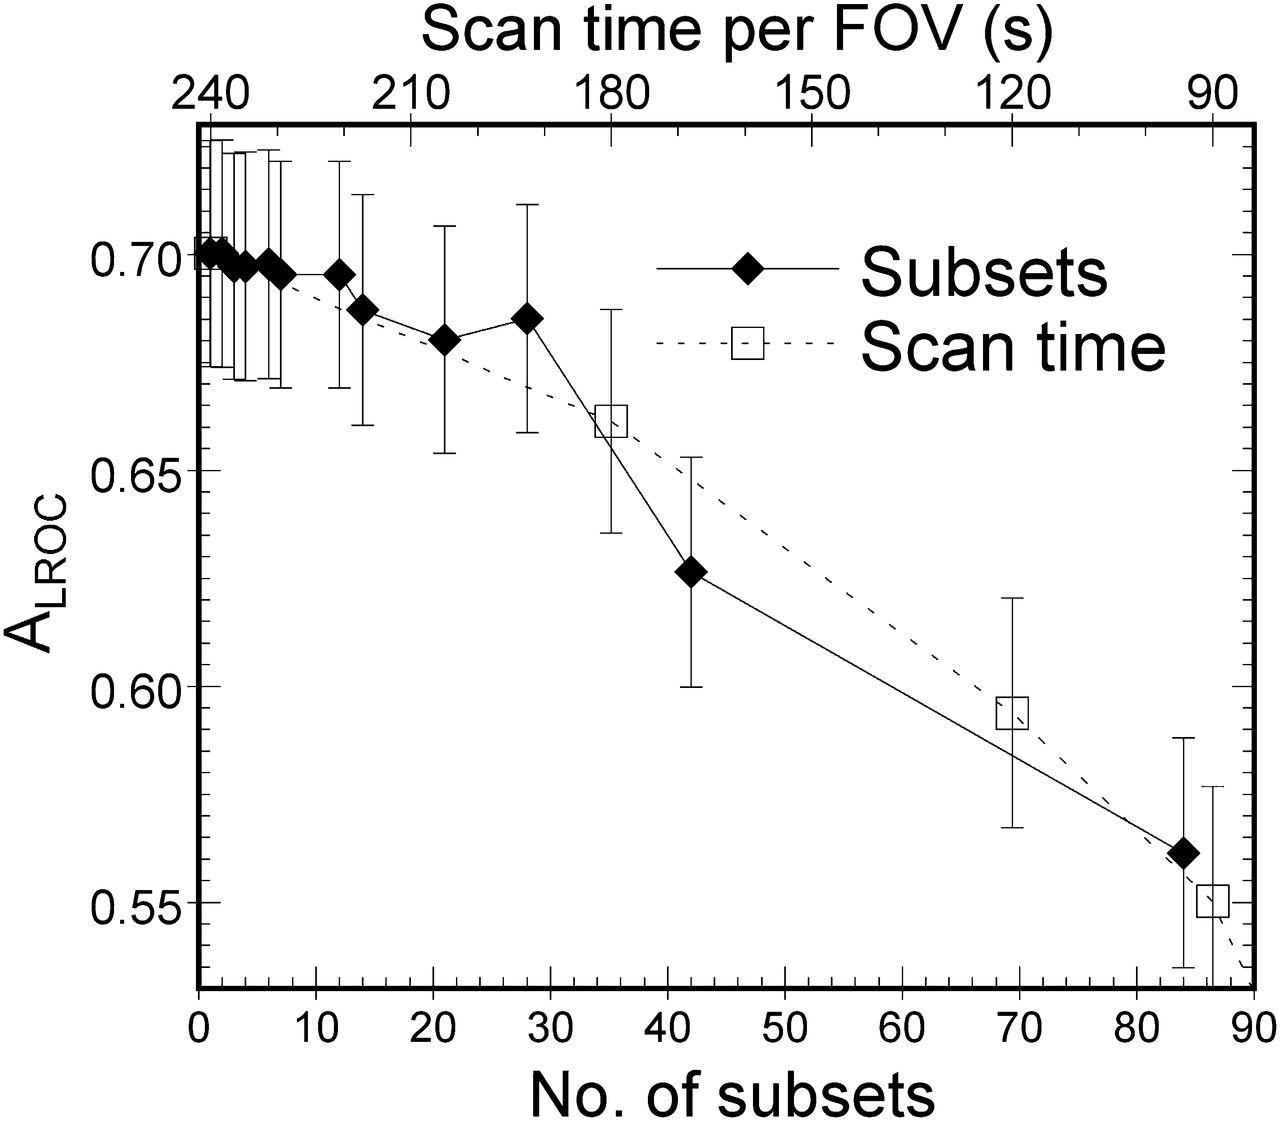
Comparison of how lesion-detection performance, as quantified by ALROC, is affected by increasing number of OSEM subsets or decreasing scan time for TOF reconstructions. These data provide context for interpreting significance of changes in ALROC observed in this work. For example, use of approximately 32 subsets would result in same loss of performance as shortening scan time from 240 to 180 s per bed position.
CONCLUSION
When OSEM is used for tomographic reconstruction, the number of subsets provides the approximate acceleration factor for this algorithm as compared with MLEM. However, increasing the number of subsets also results in increased noise and subset-related artifacts in the image. This work evaluated the effect of changing the number of OSEM subsets on lesion-detection performance for general oncologic PET imaging. As compared with the baseline MLEM algorithm, lesion-detection performance declined as the number of OSEM subsets increased. The decline was moderate out to approximately 12–14 subsets for the data studied here, beyond which performance dropped more rapidly with the number of subsets. TOF PET reconstructions showed greater effect than non-TOF reconstructions. The degree of loss of lesion detectability with 21 subsets was similar to that observed when the scan time was reduced from 240 to 205 s per bed position. Similarly, the use of 42 subsets with TOF data offset the value of TOF, resulting in the same ALROC as non-TOF reconstructed with MLEM. We conclude that PET lesion-detection performance is degraded when OSEM is used with a large number of subsets for both non-TOF and TOF reconstructions. This loss of image quality can be controlled by using a moderate number of subsets (e.g., 12–14 or fewer), retaining a large degree of acceleration while maintaining high image quality.
DISCLOSURE
This work was supported by grant R03EB014454 from the National Institute of Biomedical Imaging and Bioengineering. Support for the experimental data was also provided in part by the National Cancer Institute under grant R01CA107353, by Siemens Medical Solutions, and by the Ben B. and Iris M. Margolis Foundation. No other potential conflict of interest relevant to this article was reported.
Acknowledgments
The authors would like to thank the anonymous reviewers, whose comments and suggestions greatly improved the paper.
Footnotes
Published online Nov. 12, 2013.
REFERENCES
- Received for publication September 3, 2013.
- Accepted for publication October 23, 2013.


