
Main menu

  • Home
  • Content
    • Current
      • JNMT Supplement
    • Ahead of print
    • Past Issues
    • SNMMI Annual Meeting Abstracts
  • Subscriptions
    • Subscribers
    • Rates
    • Journal Claims
    • Institutional and Non-member
  • Authors
    • Submit to JNMT
    • Information for Authors
    • Assignment of Copyright
    • AQARA Requirements
  • Info
    • Permissions
    • Continuing Education
    • Advertisers
    • Corporate & Special Sales
  • About
    • About Us
    • Editorial Board
    • Editorial Contact
  • More
    • Alerts
    • Feedback
    • Help
    • SNMMI Journals
  • SNMMI
    • JNMT
    • JNM
    • SNMMI Journals
    • SNMMI

User menu

  • Subscribe
  • My alerts
  • Log in
  • My Cart

Search

  • Advanced search
Journal of Nuclear Medicine Technology
  • SNMMI
    • JNMT
    • JNM
    • SNMMI Journals
    • SNMMI
  • Subscribe
  • My alerts
  • Log in
  • My Cart
Journal of Nuclear Medicine Technology

Advanced Search

  • Home
  • Content
    • Current
    • Ahead of print
    • Past Issues
    • SNMMI Annual Meeting Abstracts
  • Subscriptions
    • Subscribers
    • Rates
    • Journal Claims
    • Institutional and Non-member
  • Authors
    • Submit to JNMT
    • Information for Authors
    • Assignment of Copyright
    • AQARA Requirements
  • Info
    • Permissions
    • Continuing Education
    • Advertisers
    • Corporate & Special Sales
  • About
    • About Us
    • Editorial Board
    • Editorial Contact
  • More
    • Alerts
    • Feedback
    • Help
    • SNMMI Journals
  • Follow SNMMI on Twitter
  • Visit SNMMI on Facebook
  • Join SNMMI on LinkedIn
  • Subscribe to JNMT RSS feeds
OtherIMAGING

Scan-Time Reduction Using Noise-Matched Images in 2- and 3-Dimensional Bismuth Germanate PET/CT: Clinical Study in Head and Neck Cancer

Bal Sanghera, Gerry Lowe, David Wellstead, John Lowe, Jane Chambers and WaiLup Wong
Journal of Nuclear Medicine Technology June 2009, 37 (2) 74-82; DOI: https://doi.org/10.2967/jnmt.108.055855
Bal Sanghera
  • Find this author on Google Scholar
  • Find this author on PubMed
  • Search for this author on this site
Gerry Lowe
  • Find this author on Google Scholar
  • Find this author on PubMed
  • Search for this author on this site
David Wellstead
  • Find this author on Google Scholar
  • Find this author on PubMed
  • Search for this author on this site
John Lowe
  • Find this author on Google Scholar
  • Find this author on PubMed
  • Search for this author on this site
Jane Chambers
  • Find this author on Google Scholar
  • Find this author on PubMed
  • Search for this author on this site
WaiLup Wong
  • Find this author on Google Scholar
  • Find this author on PubMed
  • Search for this author on this site
  • Article
  • Figures & Data
  • Info & Metrics
  • PDF
Loading

Article Figures & Data

Figures

  • Tables
  • FIGURE 1. 
    • Download figure
    • Open in new tab
    • Download powerpoint
    FIGURE 1. 

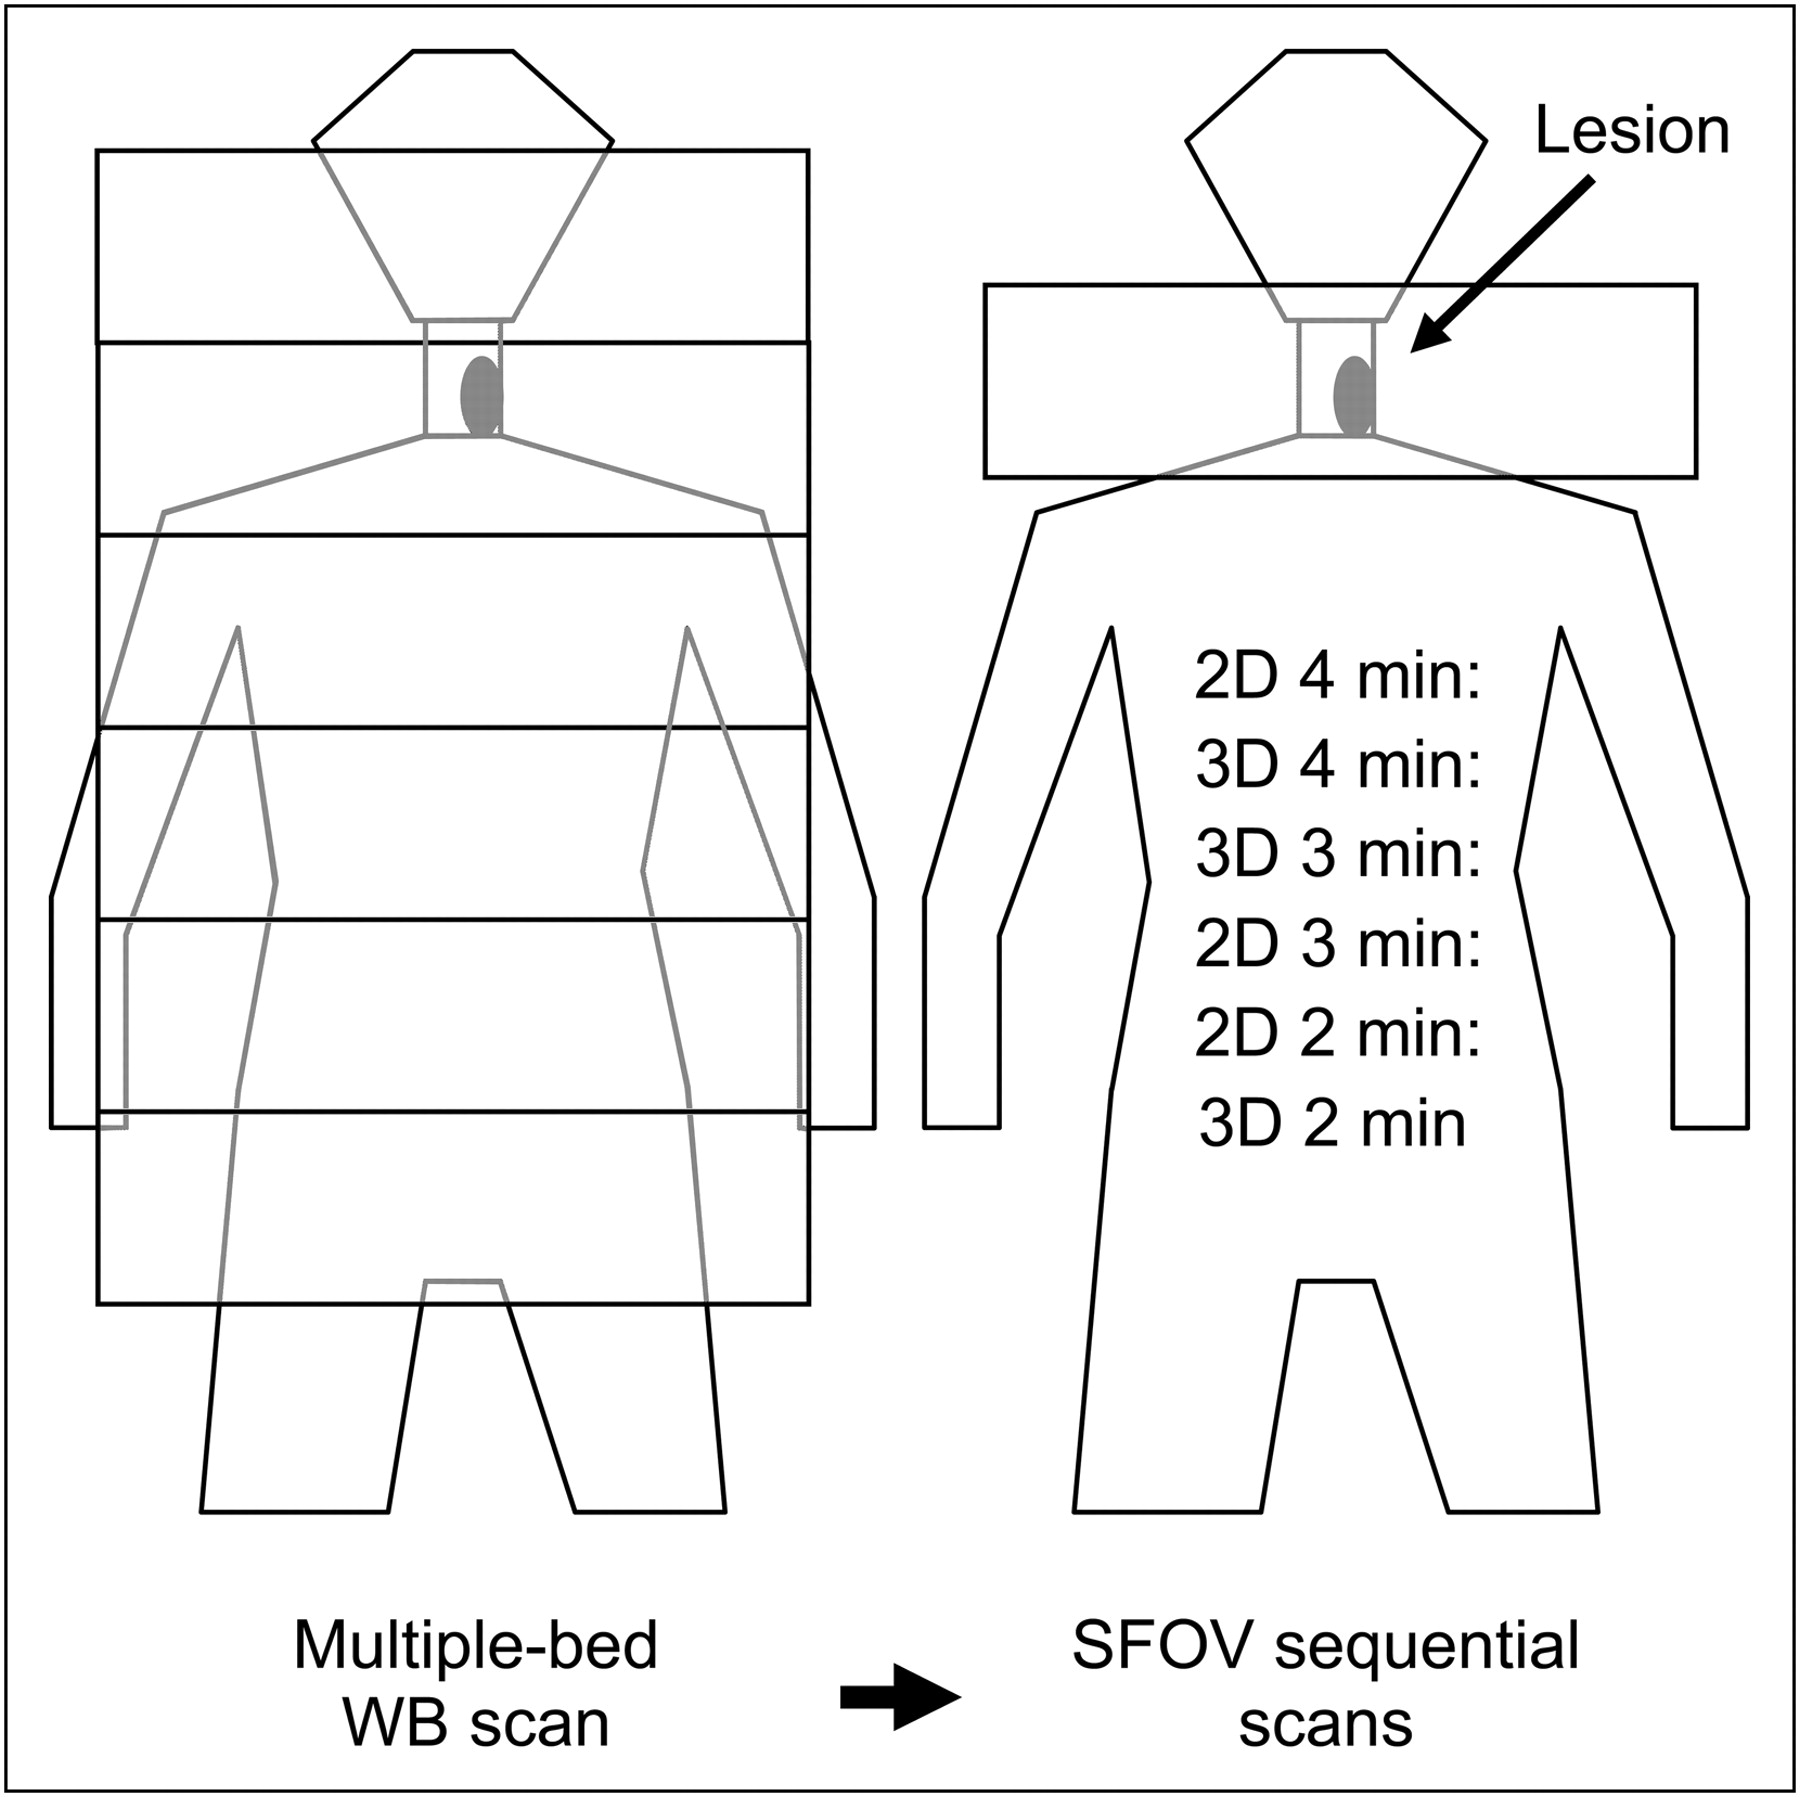
    Procedure used to investigate acquisition mode and scan time in head and neck cancer patients. Protocol allowed standard WB scanning to be performed, followed by optimized SFOV scans, without extra radiation burden to subject.

  • FIGURE 2. 
    • Download figure
    • Open in new tab
    • Download powerpoint
    FIGURE 2. 

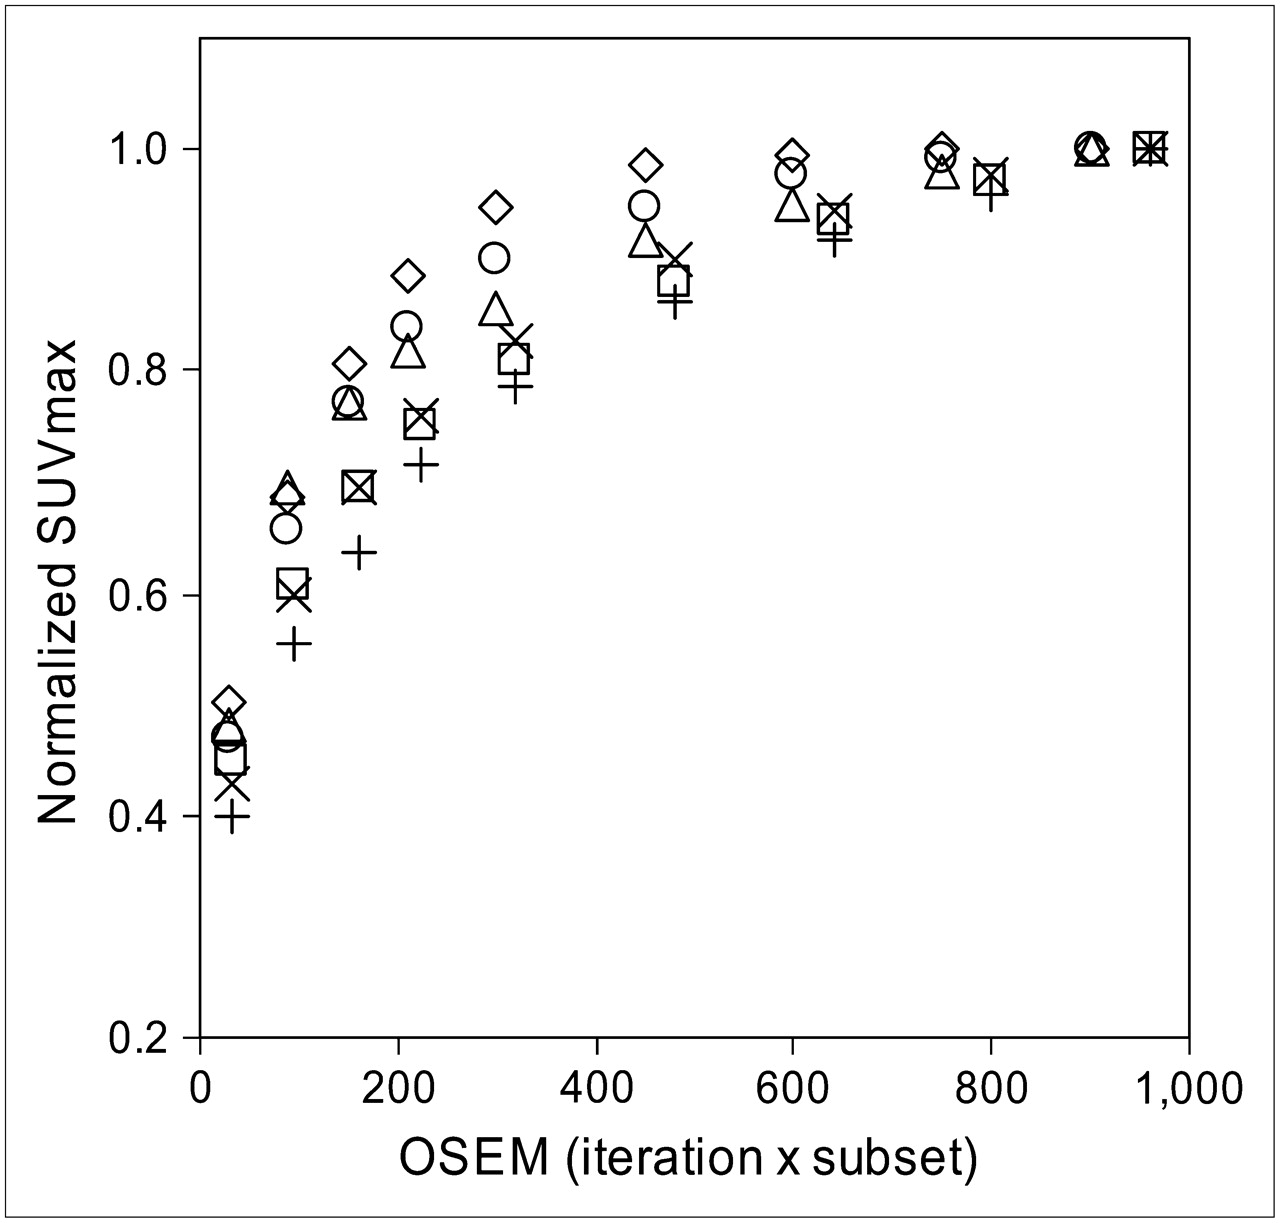
    Normalized SUVmax versus OSEM (iteration × subset) acquired with hot sphere–to–background ratio of 4:1, showing convergence of 2D and 3D acquisition modes. ⋄ = 2D 4 min; ○ = 2D 3 min; ▵ = 2D 2 min; □ = 3D 4 min; × = 3D 3 min; + = 3D 2 min.

  • FIGURE 3. 
    • Download figure
    • Open in new tab
    • Download powerpoint
    FIGURE 3. 

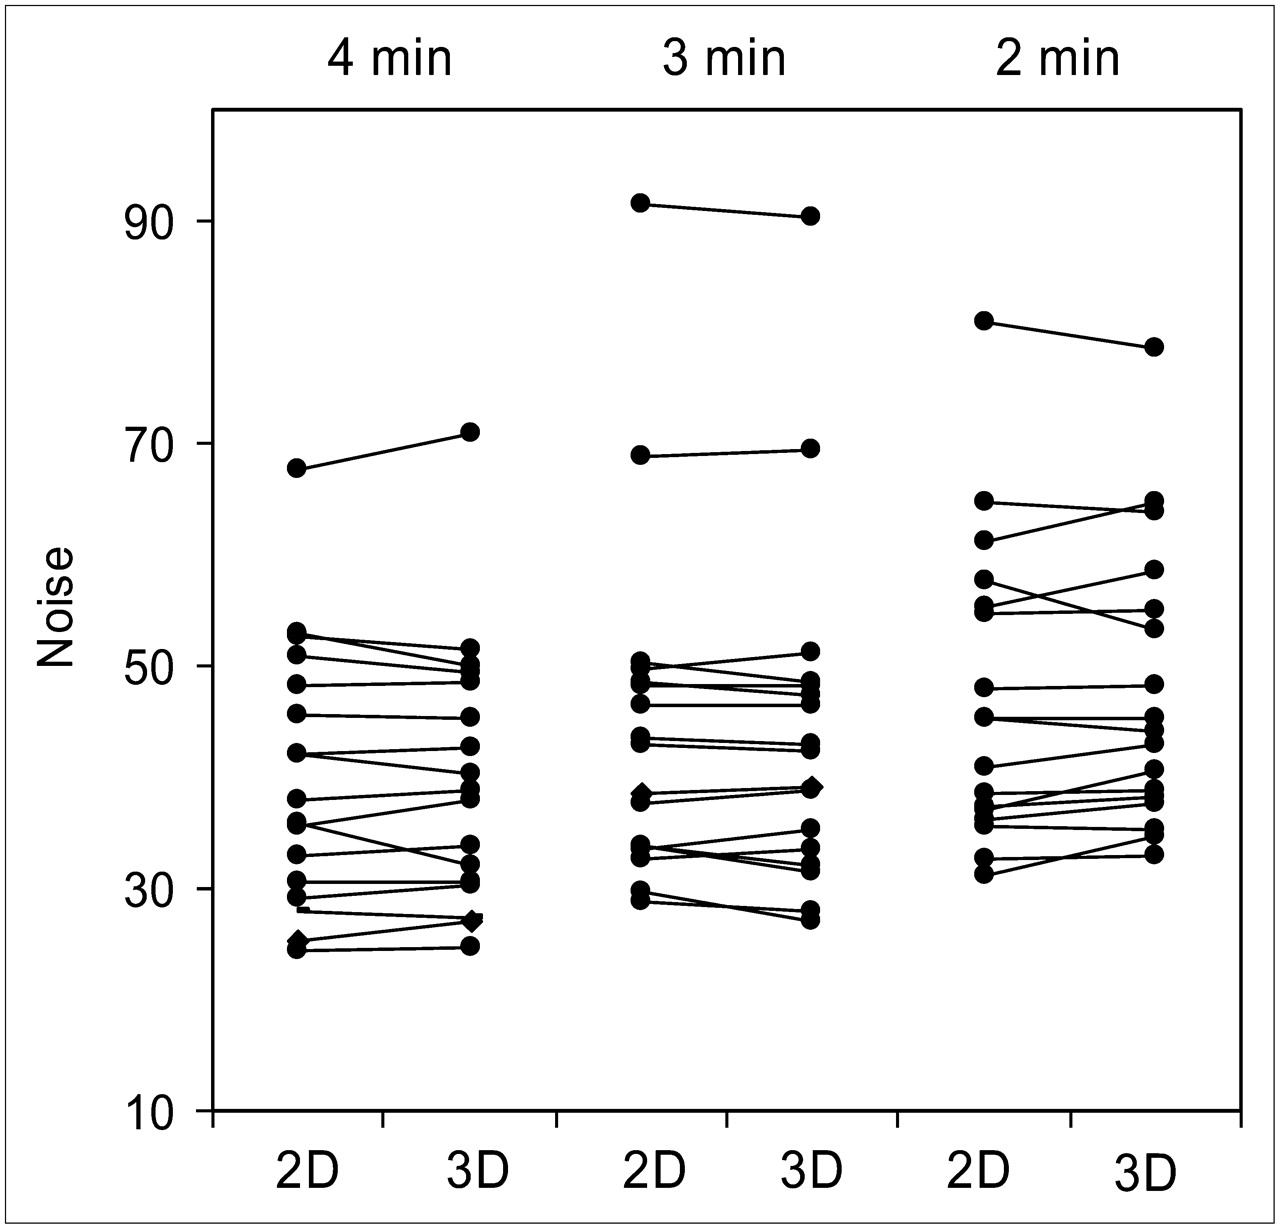
    Plot of noise matching in paired 2D and 3D acquisitions with different scan times. Difference in noise means between 4-min 2D acquisition and 4-min 3D acquisition was 0.02 and not significant (P = 0.97). This was the case for 3-min (P = 0.17) and, likewise, 2-min acquisitions (P = 0.25), showing close match in noise between paired scans.
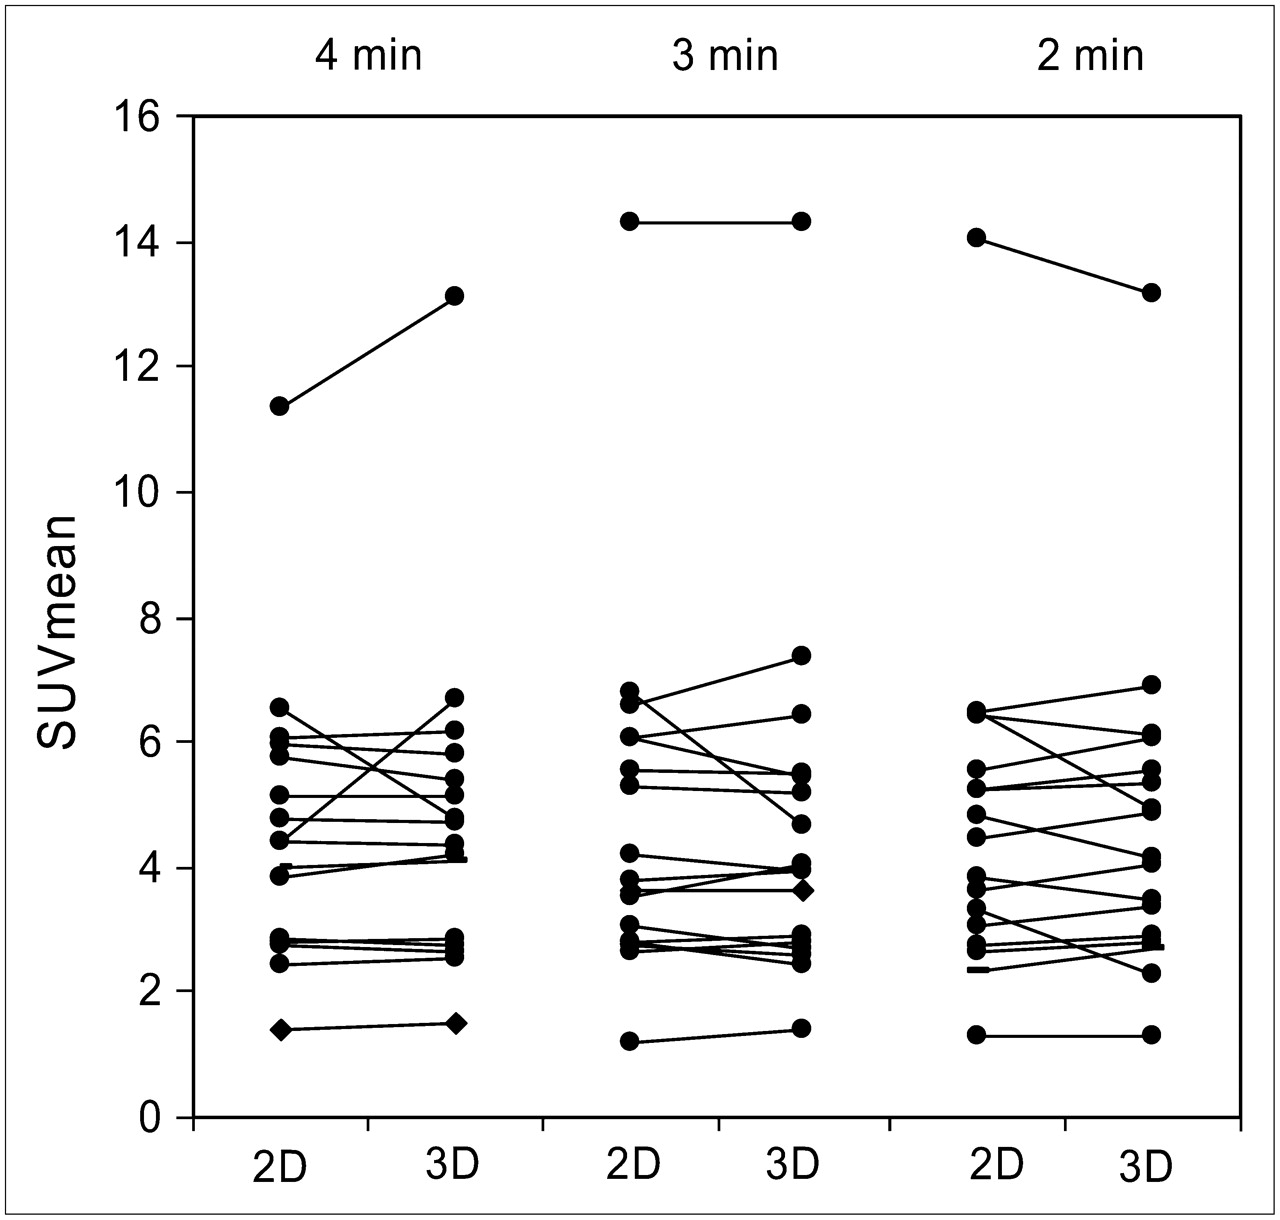
  • FIGURE 4. 
    • Download figure
    • Open in new tab
    • Download powerpoint
    FIGURE 4. 

    Plot of lesion SUVmean recorded for 2D and 3D acquisitions with different scan times. Difference in mean SUVmean between 4-min 2D acquisition and 4-min 3D acquisition was 0.14 and not significant (P = 0.54). This was the case for 3-min (P = 0.55) and, likewise, 2-min acquisitions (P = 0.45), showing no great superiority of either mode with any scan times.
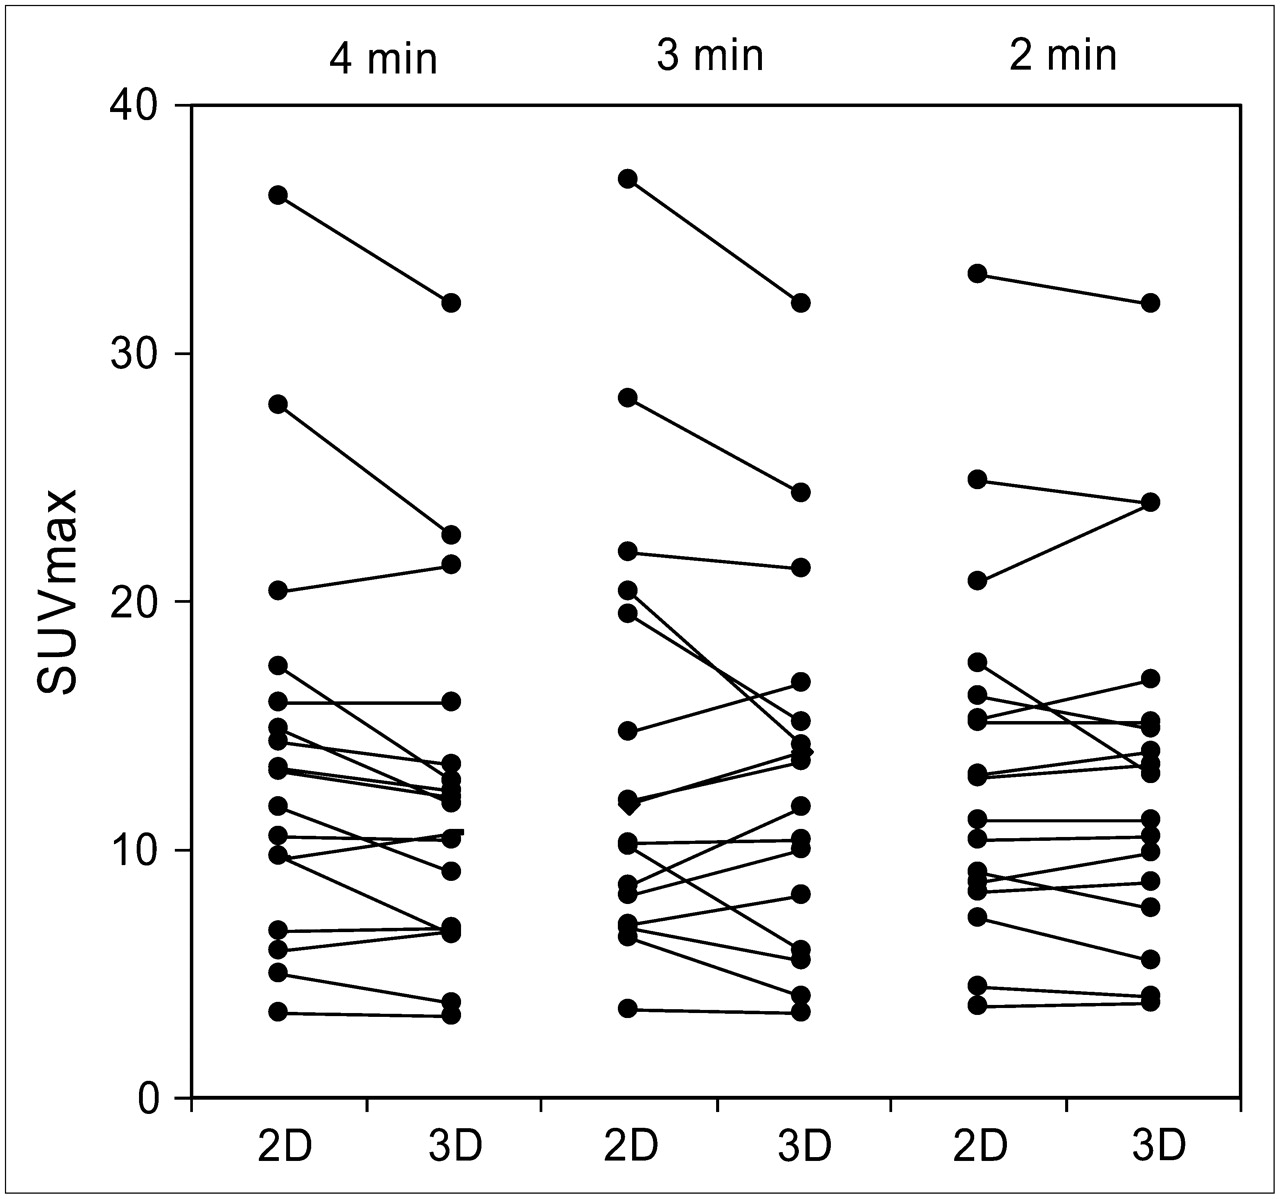
  • FIGURE 5. 
    • Download figure
    • Open in new tab
    • Download powerpoint
    FIGURE 5. 

    Plot of lesion SUVmax recorded for 2D and 3D acquisitions with different scan times. Difference in uptake means between 4-min 2D acquisition and 4-min 3D acquisition was 1.43 and significant (P = 0.01). However, nonsignificant results were obtained for 3-min (P = 0.17) and, likewise, 2-min acquisitions (P = 0.57).

  • FIGURE 6. 
    • Download figure
    • Open in new tab
    • Download powerpoint
    FIGURE 6. 

    Example of noise-matched images from patient. Images depicted are from 2D 4-min (A), 3D 4-min (B), 2D 3-min (C), 3D 3-min (D), 2D 2-min (E), and 3D 2-min (F) scans. Arrow indicates lesion, and ROIs were used to define lesion SUVmax or SUVmean (solid circle in E) and uniform background area (dotted circle in E) for semiquantitative analysis.

Tables

  • Figures
    • View popup
    TABLE 1

    Results of Matching Noise in Paired 2D and 3D Acquisitions

    Paired scanMean noise (%)SDDifferenceP
    4 min0.020.97
     2D38.419.65
     3D38.398.67
    3 min0.510.17
     3D39.818.18
     2D40.327.67
    2 min0.670.25
     2D44.6510.21
     3D45.329.33
    • No significant difference was seen in mean noise between 2D and 3D paired scans of 4, 3, and 2 min, showing that good noise-matched imaging was achieved.

    • View popup
    TABLE 2

    Results of Mean SUVmean in Paired 2D and 3D Acquisitions

    Paired scanMean SUVmeanSDDifferenceP
    4 min0.140.54
     2D4.552.28
     3D4.692.6
    3 min0.110.55
     3D4.662.93
     2D4.772.94
    2 min0.090.45
     2D4.792.84
     3D4.72.67
    • No significant difference was seen in mean SUVmean between 2D and 3D paired scans of 4, 3, and 2 min, suggesting no great superiority of either paired acquisition mode with scan duration.

    • View popup
    TABLE 3

    Results of Mean SUVmax in Paired 2D and 3D Acquisitions

    Paired scanMean SUVmaxSDDifferenceP
    4 min1.430.01
     2D13.898.35
     3D12.467.31
    3 min1.370.17
     3D13.107.49
     2D14.478.86
    2 min0.20.57
     2D13.647.5
     3D13.447.52
    • Significant difference was seen only in mean SUVmax for 2D and 3D paired scans of 4 min, suggesting some superiority for 2D scans.

    • View popup
    TABLE 4

    Observer Scores of Preference in Paired Scans with Statistical Significance

    Patient no.2D 2 min vs. 2D 4 min2D 2 min vs. 2D 3 min2D 3 min vs. 2D 4 min3D 2 min vs. 3D 4 min3D 2 min vs. 3D 3 min3D 3 min vs. 3D 4 min2D 2 min vs. 3D 2 min2D 3 min vs. 3D 3 min2D 4 min vs. 3D 4 min
    1−10−1+2+1+10+1+2
    2−10+1−10−1−1+2−1
    3000−10+10+2+1
    4+1+1−1+1+10+2+2+1
    5−100+2−10+1+2+2
    6−1−10+1−1−1+1+1+1
    7+2+10−2+1−1−1+2+1
    8+1−1−1−1−1+1+1+1+1
    9−2−100000+2+2
    10+2+2+1+2+1+1−2+1+2
    110+1−1−100+1+1+2
    120−2+100+1−1+1+1
    13+2+1+2+1+1+10+1+1
    14000000000
    Mean0.140.070.070.210.140.210.071.361.14
    SE0.350.290.250.350.210.210.290.170.23
    95% CI−0.60 to −0.89−0.55 to −0.69−0.46 to −0.60−0.54 to −0.97−0.30 to −0.59−0.25 to −0.68−0.55 to −0.690.99 to −1.720.64 to −1.64
    P0.340.40.390.280.250.170.40.00010.0001
    Scan choiceNonNonNonNonNonNonNon3D3D
    • Non = No significant preference between scans was observed.

    • Score of 0 suggested no preference; score of +1 implied second scan was superior, whereas −1 signified that first scan was superior. Similarly, score of ±2 indicated one scan, compared with other, was far superior.

    • View popup
    TABLE 5

    Spearman Correlation Coefficient of SUVmax

    P
    ScanAge at scan (y)Weight (kg)Height (m)BMI (kgm−2)Blood glucose (mmol−1)
    2D
     4 min0.820.970.180.120.45
     3 min0.660.730.280.060.43
     2 min0.570.930.430.300.53
    3D
     4 min0.650.750.450.150.47
     3 min0.690.830.500.260.43
     2 min0.670.670.590.170.33
    • No significant correlations were observed between any 2D or 3D acquisition modes and scan duration with age, weight, height, BMI, or blood glucose.

PreviousNext
Back to top

In this issue

Journal of Nuclear Medicine Technology: 37 (2)
Journal of Nuclear Medicine Technology
Vol. 37, Issue 2
June 2009
  • Table of Contents
  • About the Cover
  • Index by author
Print
Download PDF
Article Alerts
Sign In to Email Alerts with your Email Address
Email Article

Thank you for your interest in spreading the word on Journal of Nuclear Medicine Technology.

NOTE: We only request your email address so that the person you are recommending the page to knows that you wanted them to see it, and that it is not junk mail. We do not capture any email address.

Enter multiple addresses on separate lines or separate them with commas.
Scan-Time Reduction Using Noise-Matched Images in 2- and 3-Dimensional Bismuth Germanate PET/CT: Clinical Study in Head and Neck Cancer
(Your Name) has sent you a message from Journal of Nuclear Medicine Technology
(Your Name) thought you would like to see the Journal of Nuclear Medicine Technology web site.
Citation Tools
Scan-Time Reduction Using Noise-Matched Images in 2- and 3-Dimensional Bismuth Germanate PET/CT: Clinical Study in Head and Neck Cancer
Bal Sanghera, Gerry Lowe, David Wellstead, John Lowe, Jane Chambers, WaiLup Wong
Journal of Nuclear Medicine Technology Jun 2009, 37 (2) 74-82; DOI: 10.2967/jnmt.108.055855

Citation Manager Formats

  • BibTeX
  • Bookends
  • EasyBib
  • EndNote (tagged)
  • EndNote 8 (xml)
  • Medlars
  • Mendeley
  • Papers
  • RefWorks Tagged
  • Ref Manager
  • RIS
  • Zotero
Share
Scan-Time Reduction Using Noise-Matched Images in 2- and 3-Dimensional Bismuth Germanate PET/CT: Clinical Study in Head and Neck Cancer
Bal Sanghera, Gerry Lowe, David Wellstead, John Lowe, Jane Chambers, WaiLup Wong
Journal of Nuclear Medicine Technology Jun 2009, 37 (2) 74-82; DOI: 10.2967/jnmt.108.055855
Twitter logo Facebook logo LinkedIn logo Mendeley logo
  • Tweet Widget
  • Facebook Like
  • Google Plus One
Bookmark this article

Jump to section

  • Article
    • Abstract
    • MATERIALS AND METHODS
    • RESULTS
    • DISCUSSION
    • CONCLUSION
    • Acknowledgments
    • Footnotes
    • References
  • Figures & Data
  • Info & Metrics
  • PDF

Related Articles

  • No related articles found.
  • PubMed
  • Google Scholar

Cited By...

  • No citing articles found.
  • Google Scholar

More in this TOC Section

  • Normative Quantitative Values for Dacryoscintigraphy and the Effect of Lid Massage
  • PET/MRI Assessment of Acute Cardiac Inflammation 1 Month After Left-Sided Breast Cancer Radiation Therapy
  • α-Labeling of J591, an Antibody Targeting Prostate-Specific Membrane Antigen: The Technique and Considerations from the First Dedicated Production Lab at an Academic Institution in the United States
Show more Imaging

Similar Articles

SNMMI

© 2023 Journal of Nuclear Medicine Technology

Powered by HighWire