


Article Figures & Data
Figures
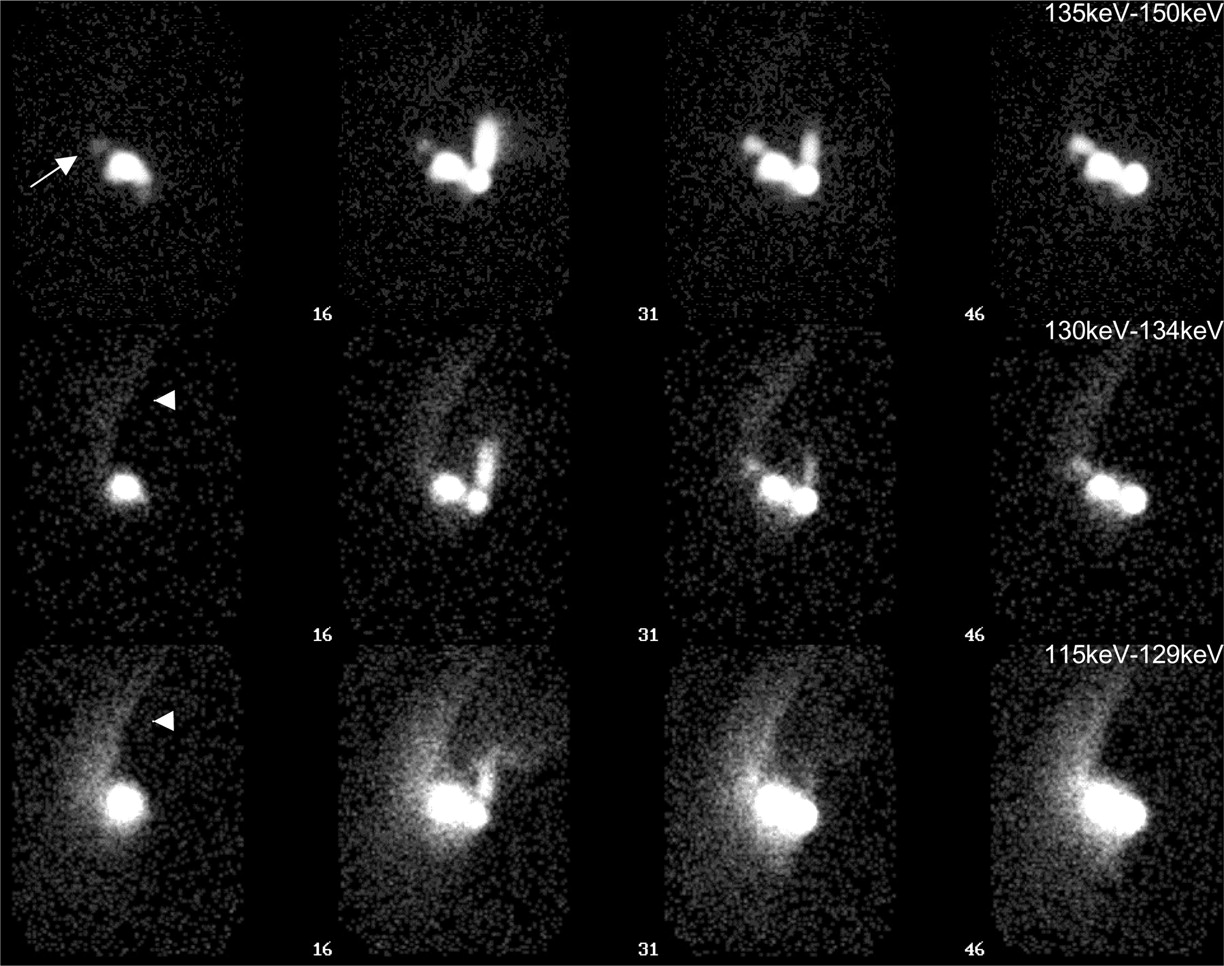
- FIGURE 1.
Sequence of 10-s frames compressed into 150-s frames at 3 different energy windows acquired simultaneously. Energy window in top row: 135−150 keV. Perilesional injection site and resultant faint sentinel node (arrow). Second through fourth frames (frames 16, 31, and 46) show activity in syringe being injected at areolar cutaneous junction and resultant enhancement of activity in sentinel node “LymphoBoost” (8); used for printing of images for the surgeon. Energy window in middle row: 130−134 keV. Scatter from arm (arrowhead) and nonvisualization of sentinel node before and even on or just after second injection. This energy range can contain little useful information and often has excessive scatter so an option exists not to use data in printing images for the surgeon. Energy window in bottom row: 115−129 keV. Nonvisualization of sentinel node on any frame. This energy range can be used for transmission scan with 57Co 122-keV sheet source or for internal body scatter outline (1,2,5). It can be printed separately or combined with first row but only if images in top row are also printed as separate images without transmission scan.
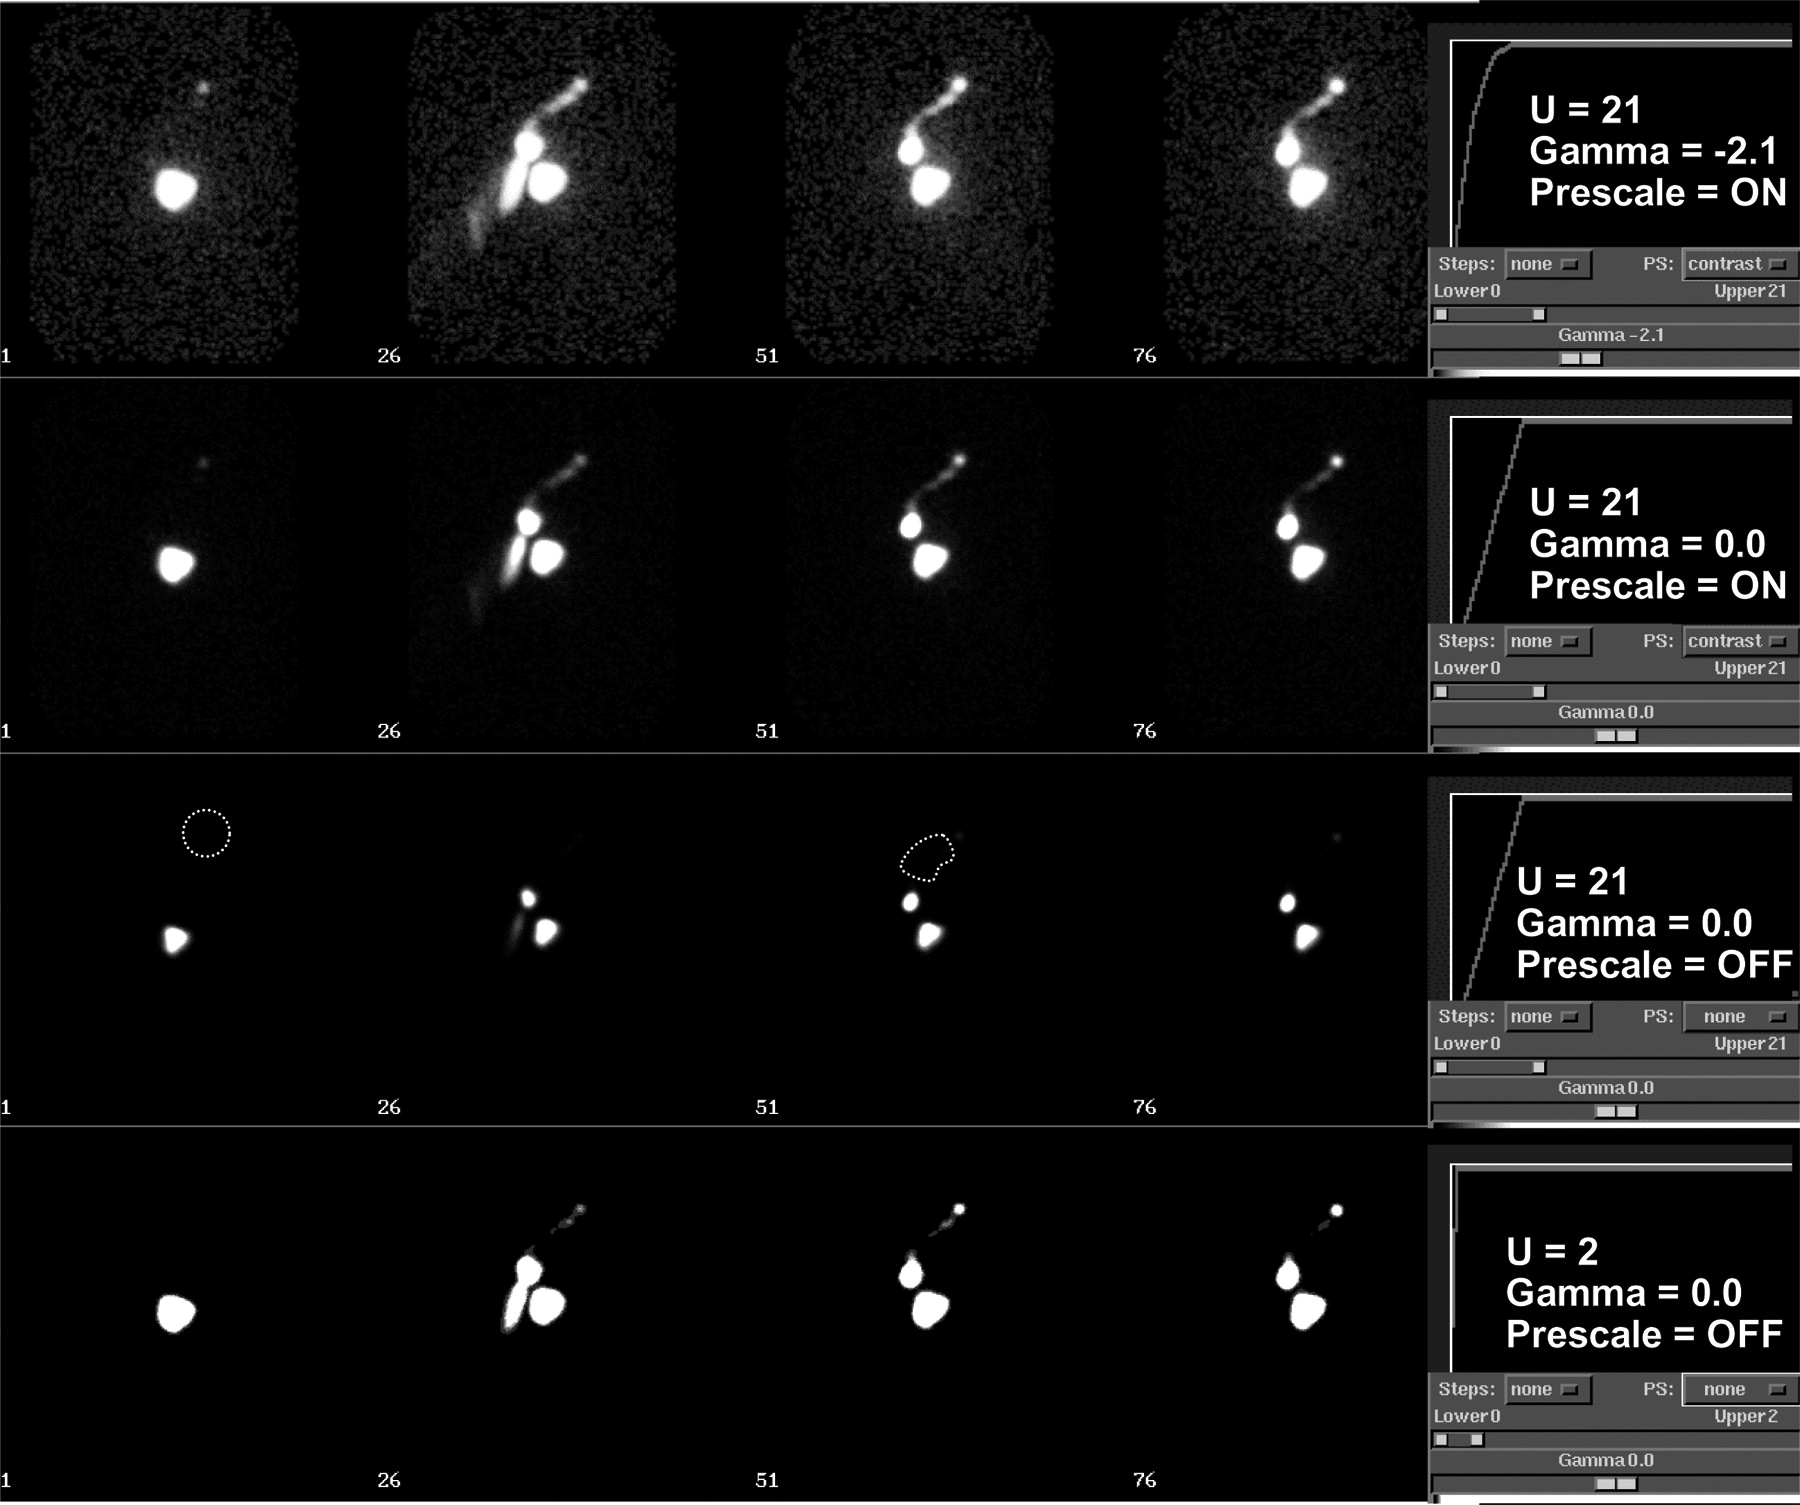
- FIGURE 2.
Each row of images is of same sequence of 10-s frames compressed into 250-s frames but with different display settings. (Top row) Perilesional injection site and resultant faint sentinel node (frame 1). Second through fourth frames (frames 26, 51, and 76) show activity in syringe being injected at areolar cutaneous junction and resultant lymphatic tract and sentinel node enhancement (1,5,8). Optimal settings of prescale data processing enabled a nonlinear γ-curve applied (plot), and upper threshold adjustment allows faint node to be easily seen in frame 1. “Trail” of syringe as it was brought over into field of view (subsequent frame) and lymphatic channel are noted. Second row shows nearly complete loss of the initially faint node and trail as prescaling is turned off. Third row shows switch from γ-response curve to linear response curve (plot), with complete loss of sentinel nodes and lymphatic tracts (dashed ROIs). Bottom row shows attempt to enhance image by adjusting upper threshold to 2, steps away from complete “white out,” suboptimal compared with top row.
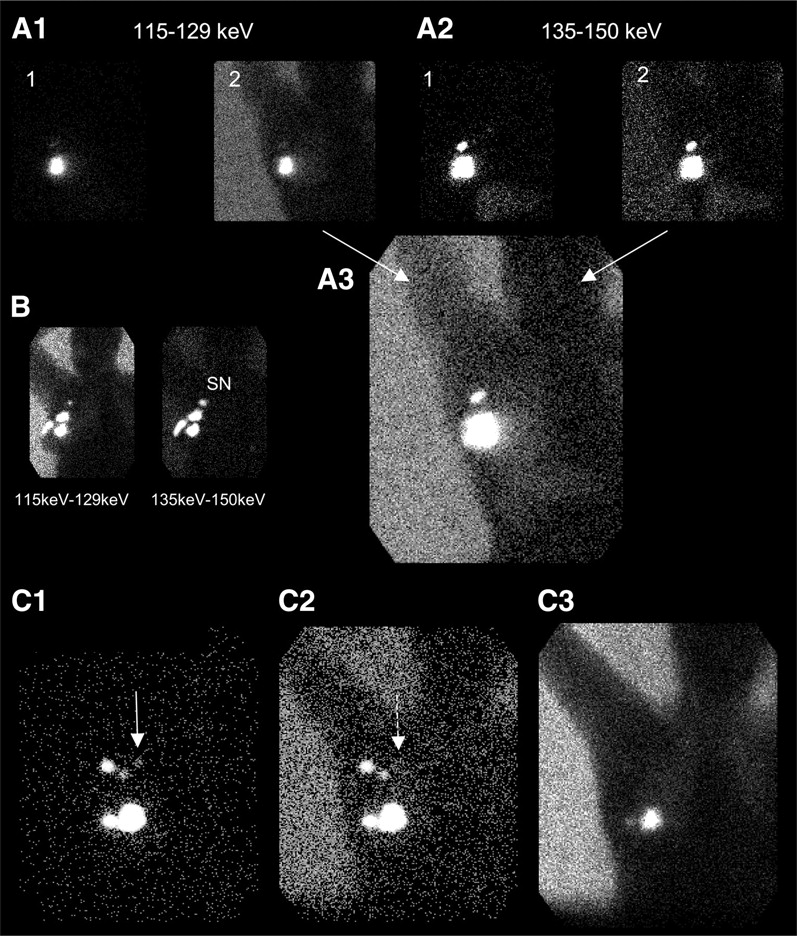
- FIGURE 3.
(A1) Pair of emission (frame 1) and transmission (frame 2) images at 57Co window. (A2) Pair of emission (frame 1) and transmission (frame 2) images at 99mTc upwardly offset window for sentinel node delineation. (A3) Combination image created by summing multiple-energy window transmission images from A1 and A2 to produce composite transmission−emission image. (B) Anterior chest at 115- to 129-keV and 135- to 150-keV windows. Counts are higher in 57Co window than in upwardly offset 99mTc window for optimal sentinel node delineation. (C1 and C2) Sequential emission and transmission images obtained at same 99mTc upwardly offset window for sentinel node delineation. (C3) Transmission image acquired simultaneously with C2 at 57Co window. Faint node (solid arrow in C1) is “lost” in transmission image (dashed arrow in C2), even at same optimized energy window for sentinel nodes, and illustrates importance of presenting emission-only images. Complete loss of all nodes in 57Co optimized transmission window is evident in C3.
- FIGURE 4.
Top 3 rows: Sequential anterior images of left chest at 3 energy settings acquired simultaneously. Shielding at 2 different orientations is shown in first 2 columns. (First column) Shielding covers true sentinel node secondary to too much overlap. (Second column) Shielding creates stray foci (bracket and asterisk) that can easily be mistaken to represent true sentinel nodes (arrows). Shielding mainly affects flux with little, if any, effect on scatter reduction. Beneficial effects of scatter reduction are optimal when appropriate energy settings are used (compare second and third rows, arrows pointing to sentinel nodes). Bottom row: Best delineation of nodes occurs with different angled views and standing positions, which shows 2 very closely approximated nodes depending on view.
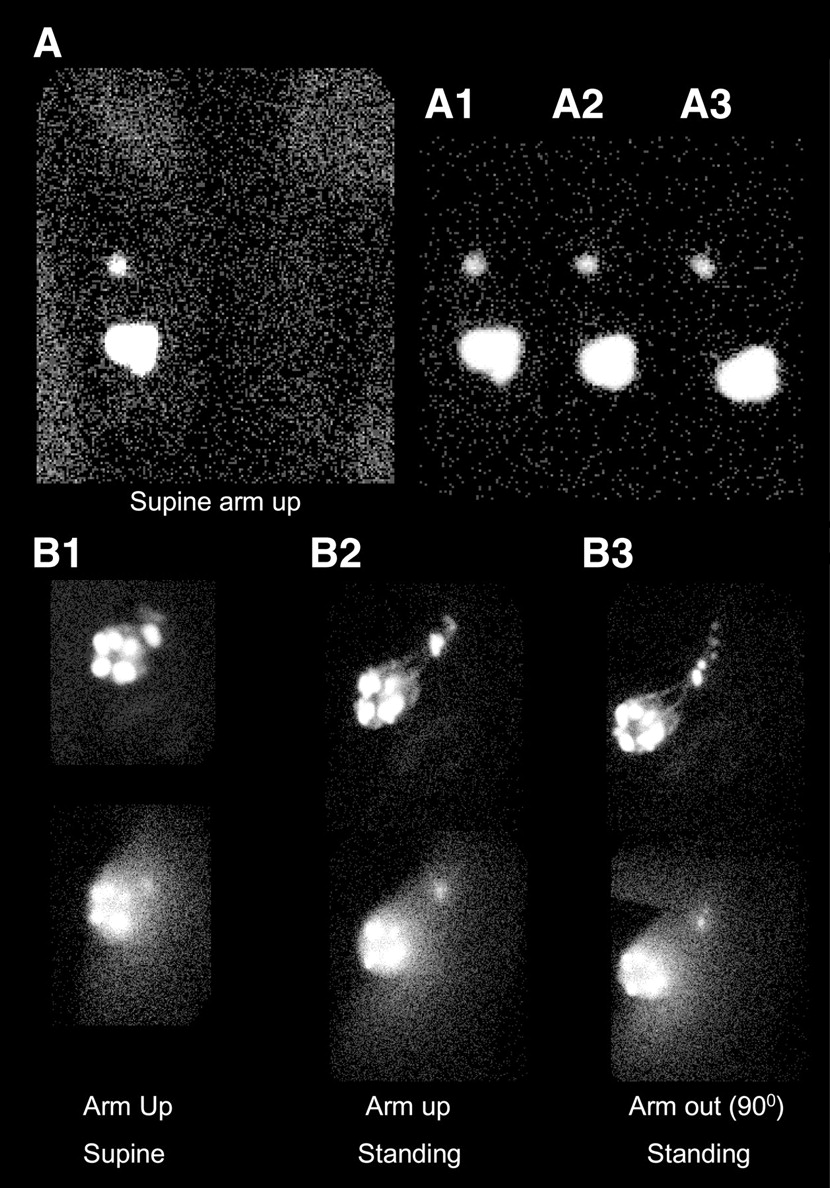
- FIGURE 5.
Anterior views of patient (A): A1 = Supine, arm up; A2 = Standing, arm up; A3 = Standing, arm out. Distance between injection sites and sentinel node increases and breast tissues shifts inferiorly, anteriorly, and medially as patient’s arm is lowered to surgical position and patient assumes standing position. (B1–B3) (Middle row) Lateral views of different patient with 2 lesions in left breast injected at 2 perilesional sites and 2 areolar sites, with activity initially draining through several channels eventually into one. Sentinel nodes and more distant echelon nodes of decreasing intensity are noted. In some supine patients, the raised arm position brings injection sites closer to the axilla and causes nodes to “bunch up,” with best separation and delineation often occurring with surgical position (arm 90° out) or with patient standing. (Bottom row) Corresponding body contour scatter images from internal body scatter.


Tables
Study no. TS windows PT windows TS/PT ratio outlining performance Lower Middle Upper Lower Middle Upper Lower Middle Upper Group 1 1 1,776 226 168 131 27 47 13.6 8.4 3.6 2 2,068 157 186 169 12 32 12.2 13.1 5.8 3 2,192 126 208 179 15 57 12.3 8.4 3.7 4 1,643 178 142 136 21 48 12.1 8.5 3.0 5 1,615 115 180 137 9 37 11.8 12.8 4.9 6 2,107 75 157 113 13 37 18.7 5.8 4.2 7 1,945 104 170 133 29 87 14.6 3.6 2.0 8 1,911 170 143 70 7 18 27.3 24.3 8.0 9 2,470 280 221 181 50 155 13.7 5.6 1.4 10 1,818 84 167 101 4 30 18 21 5.6 Average 1,955 151.5 174.2 135 18.7 54.8 15.4 11.1 4.2 ± SD 263.1 64.8 25.7 35.1 13.7 38.9 4.8 6.8 1.9 Group 2 1 652 25 53 130 17 104 5.0 1.5 0.5 2 650 37 59 67 7 16 9.7 5.3 3.7 3 696 26 52 108 12 56 6.4 2.2 0.9 4 674 46 56 92 16 47 7.3 2.9 1.2 5 612 69 70 53 10 22 11.6 6.9 3.2 6 589 25 58 55 7 22 10.7 3.6 2.6 7 636 46 52 69 7 23 9.2 6.6 2.3 8 693 29 54 167 24 50 4.2 1.2 1.1 9 661 57 51 136 38 102 4.9 1.5 0.5 10 601 31 55 35 6 22 17.7 5.2 2.5 Average 646.4 39.1 56 91.2 14.4 46.4 8.6 3.7 1.8 ± SD 37.0 15.1 5.6 42.9 10.1 33.0 4.0 2.2 1.1 Counts are for same-sized ROI (15 × 40 pixels) over patient (PT) and over nonattenuated area of transmission source (TS) for individual group 1 and group 2 studies (n = 10 each). Counts in lower, middle, and upper energy windows in ROI over patient and transmission source are listed for energy windows described in text (group 1: 115–129, 130–134, and 135–150 keV; group 2: 112–132, 130–134, and 135–150 keV). Outlining performance, defined as ratio of counts in ROI over transmission source relative to ROI over patient (TS/PT) for a particular energy window are noted. The higher the ratio the bigger the difference between patient and outlining source and the better the “contrast.” Average values of all patients for these indices in each group are presented.


