


Abstract
Objective:Nuclear medicine technologists rely on a single dosimeter to measure their work-related dose. Estimates of whole-body effective dose are based on the assumptions that the radiation is incident from the front and in a uniform beam. We sought to investigate these assumptions and also to quantify doses associated with different activities.
Methods:A single technologist wore 3 electronic dosimeters for 3 mo, at the front waist, the back waist, and the front collar. The technologist also recorded her activities throughout the day.
Results:We found that the assumption of an anterior beam held about two thirds of the time, breaking down only when the technologist was receiving lower doses. Overall, the average whole-body dose was estimated correctly by assuming an anterior beam. We also found that irradiation was uniform (i.e., waist and collar badges gave equivalent readings) except when the technologist was performing injections. Then, the collar readings were 1.7 times the waist readings. Finally, average doses were measured for different types of activities. Performing injections registered a dose rate of approximately 2 μSv/h. Doses received while scanning ranged from 0.2 to 2 μSv/h. The average dose for a scan depended not only on the administered activity and isotope but also on the amount of patient contact required. Even for high activities, such as patients who had already received therapy, the dose to the technologist was low for patients requiring little assistance.
Conclusion:The assumption of anterior irradiation correctly estimates whole-body effective dose. The assumption of a uniform beam is good except when injections are being performed, when the upper torso receives a much higher dose than the waist. Overall, doses to the technologist were found to be 5.4 μSv/d for scanning and 12 μSv/d for injections. These correspond to 1.4 mSv/y and 3.2 mSv/y, respectively, which are comparable to naturally occurring radiation levels and are much lower than regulatory limits. However, if the dose to a particular technologist needs to be minimized (e.g., for a pregnant worker), the most effective strategy is for the technologist to be assigned patients requiring little contact or assistance and, in particular, to avoid administering injections.
In nuclear medicine, estimates of the dose to staff are based on measurements from a single dosimeter, worn at the collar or waist (1–3). In calculating the whole-body dose from the dosimeter value, it is assumed that the radiation is incident on the wearer in a uniform beam from the front. These assumptions are obviously not completely accurate. However, it is unclear whether they result in important underestimation or overestimation of dose. In this study, we investigated the validity of these assumptions and also the typical doses associated with different scans.
To check the assumption of anterior irradiation, we compared doses measured at the front waist and back waist. Comparing doses measured at the waist and collar tested the uniformity of irradiation. Collating the dose measurements with a diary kept by the technologist identified the average dose for the different imaging procedures.
MATERIALS AND METHODS
We used credit card-sized electronic dosimeters (Dosicard; Eurisys Mesures, St-Quentin-en-Yvelines, France) that measure the deep dose equivalent, Hp(10), for x-rays and γ-rays. They have an energy response of ±15% from 60 to 1.25 MeV. For 3 mo, the same technologist wore 3 such dosimeters: 1 at the front waist, 1 at the front collar, and 1 at the back waist. For the first 2 mo, the technologist also kept a diary of her activities each day.
In our department, technologists are scheduled to perform injections for 1 wk at a time. When giving injections, the technologists generally will not be scanning patients. Thus, we were able to use the diary to divide the dose measurements into those days when the technologist was known to be administering radiopharmaceuticals and those when she was known to be in a scanning room. Furthermore, days in the scanning rooms were divided into specific scanning procedures.
The administered activity is clearly of importance in comparing the dose received for different kinds of scans. For diagnostic scans, the administered activity is always recorded. For 131I therapy, patients are released (and scanned) when the external dose rate at 1 m is 20 μSv/h (2 mrem/h). This is generally 2–3 d after administration, but the time in isolation varies depending on the administered activity and the disease state. A typical residual activity of 350 MBq (9.5 mCi) was calculated from the 131I-specific γ-constant for a dose rate of 20 μSv/h.
The dosimeters were programmed to record the dose every 30 min and every full day, from 7:30 am until 6:00 pm. Daily doses were recorded to the nearest microsievert and 30-min doses were recorded to the nearest hundredth of a microsievert. The dosimeters were also programmed to sound an alarm if the dose rate exceeded 10 μSv/h or if the cumulative daily dose exceeded 10 μSv. Unfortunately, only 2 fully programmable dosimeters were available for the first month of the trial. For this month, the back-waist dosimeter recorded daily doses but not 30-min doses.
To aid in the comparison of the front and back dose readings, we also estimated the attenuation of the technologist. Readings were taken in front of and behind the technologist using an analog survey meter (LB1200; EG&G Berthold, Bundoora, Australia). The source was a patient who had been injected with 99mTc, lying approximately 1 m away on the camera bed.
RESULTS
Direction of Irradiation
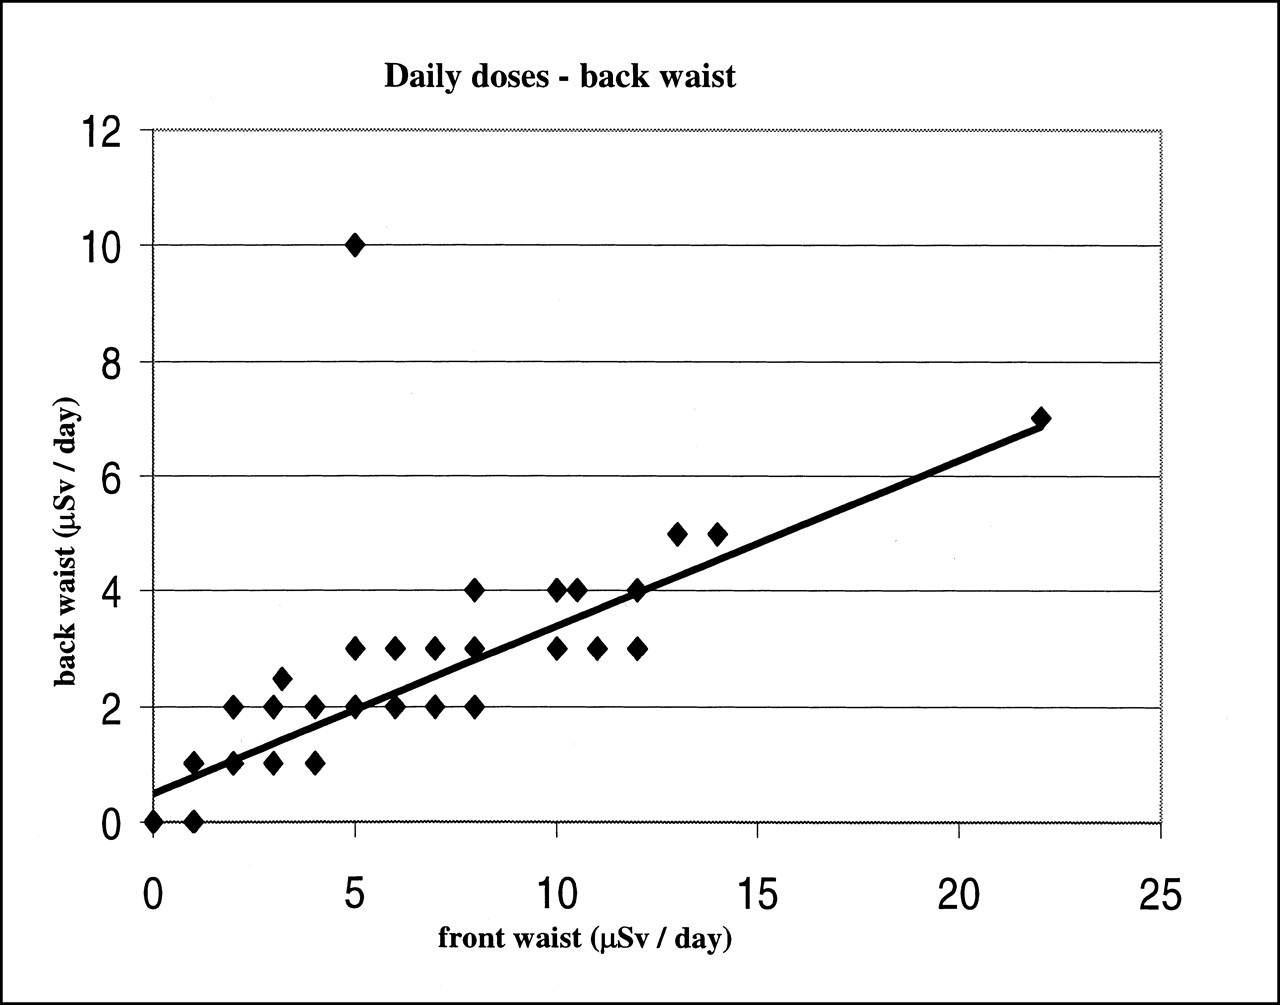
We plotted the back waist against the front waist for daily doses (Fig. 1). Excluding the 1 anomalous point, the slope was 0.29 and the correlation coefficient was 0.91. The slope agrees with our estimate of the technologist’s attenuation: We found that the dose reading at the back was 30% of the dose reading at the front. It is interesting to note that the intercept of Figure 1 was significantly greater than zero (mean ± SD, 0.49 ± 0.02).

Relationship between daily doses recorded at back waist and at front waist. Line of best fit excludes single anomalous point. Correlation coefficient = 0.91. Line of best fit: back = 0.29 × front + 0.49.
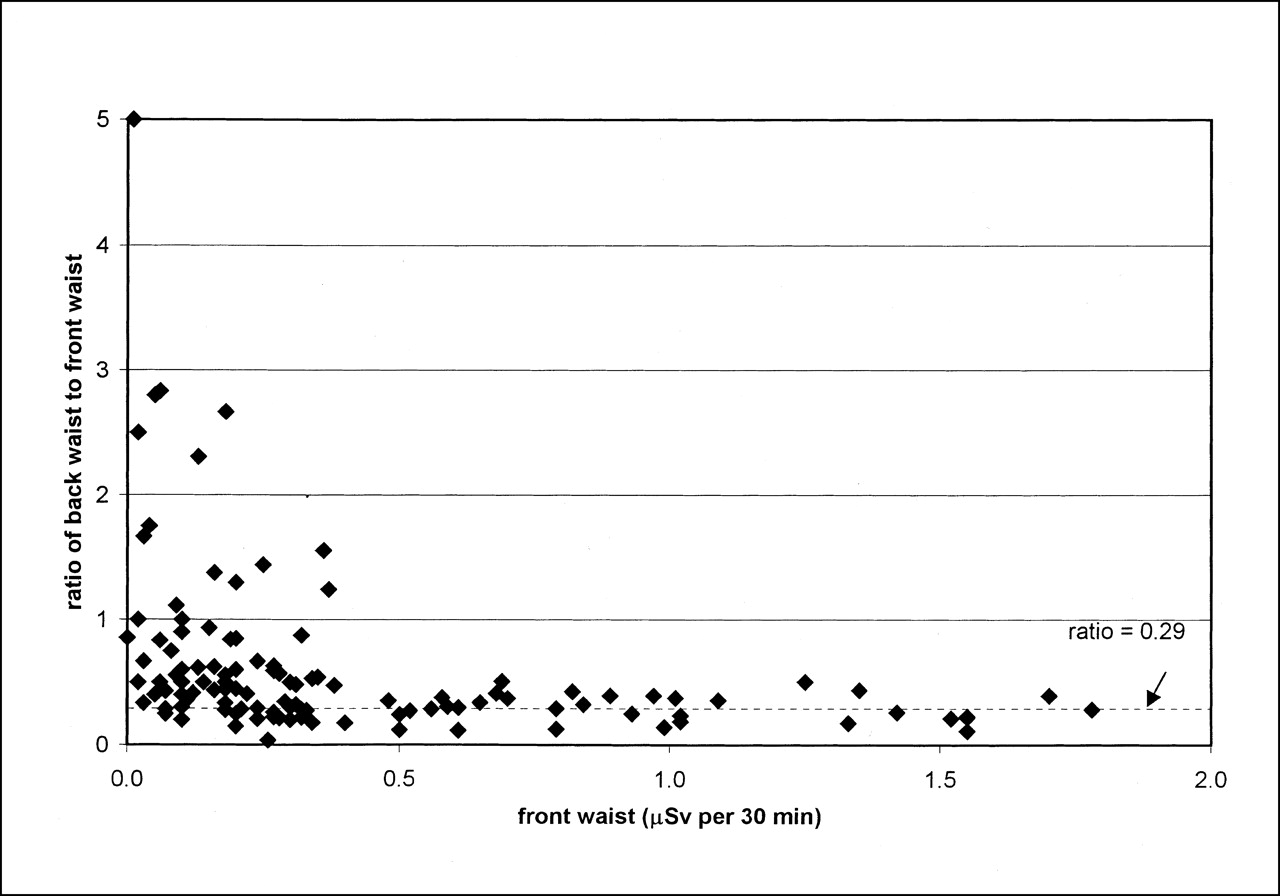
We also looked at the ratio of back-waist to front-waist doses over 30-min intervals for those times when the technologist was known to be scanning a patient (Fig. 2). Figure 2 clearly consists of 2 regions with a cutoff at a front-waist dose of approximately 0.4 μSv. For higher front doses, the average ratio of back to front is 0.29 ± 0.11 (mean ± SD), which corresponds to the slope of Figure 1. However, for lower front-waist doses, the back-to-front ratio is generally higher and has a much greater spread (mean ± SD, 0.75 ± 0.77). Of the 119 intervals, 38 have ratio values higher than 0.51 (which is average plus 2 SDs, for high front-waist dose intervals). All of the intervals with high ratios correspond to low front-waist dose values.

Ratio of back-waist dose to front-waist dose for 30-min intervals plotted against front-waist dose. Technologist was known to be scanning patients during these intervals. Dashed line indicates slope of graph for back-waist daily dose vs. front-waist daily dose (shown in Fig. 1).
Uniformity of Beam
Figure 3 shows the relationship of collar doses to front-waist doses for daily measurements. The line of identity is also indicated in this graph. Note that the measurements cluster more closely about the line of identity for the lower values up to a front-waist dose of approximately 10 μSv. For the higher waist values, the collar measurement is well above the waist measurement.

Relationship between daily doses recorded at collar and at waist. Line of identity is shown. Correlation coefficient = 0.90.
Figure 4 shows the same data as in Figure 3 but with days spent injecting marked separately from days spent in scanning rooms. Obviously, injection duty results in significantly higher doses to the technologist. In addition, the ratio of collar to waist is higher when giving injections (mean ± SD, 1.7 ± 0.3) compared with that when performing scanning (mean ± SD, 1.1 ± 0.3).
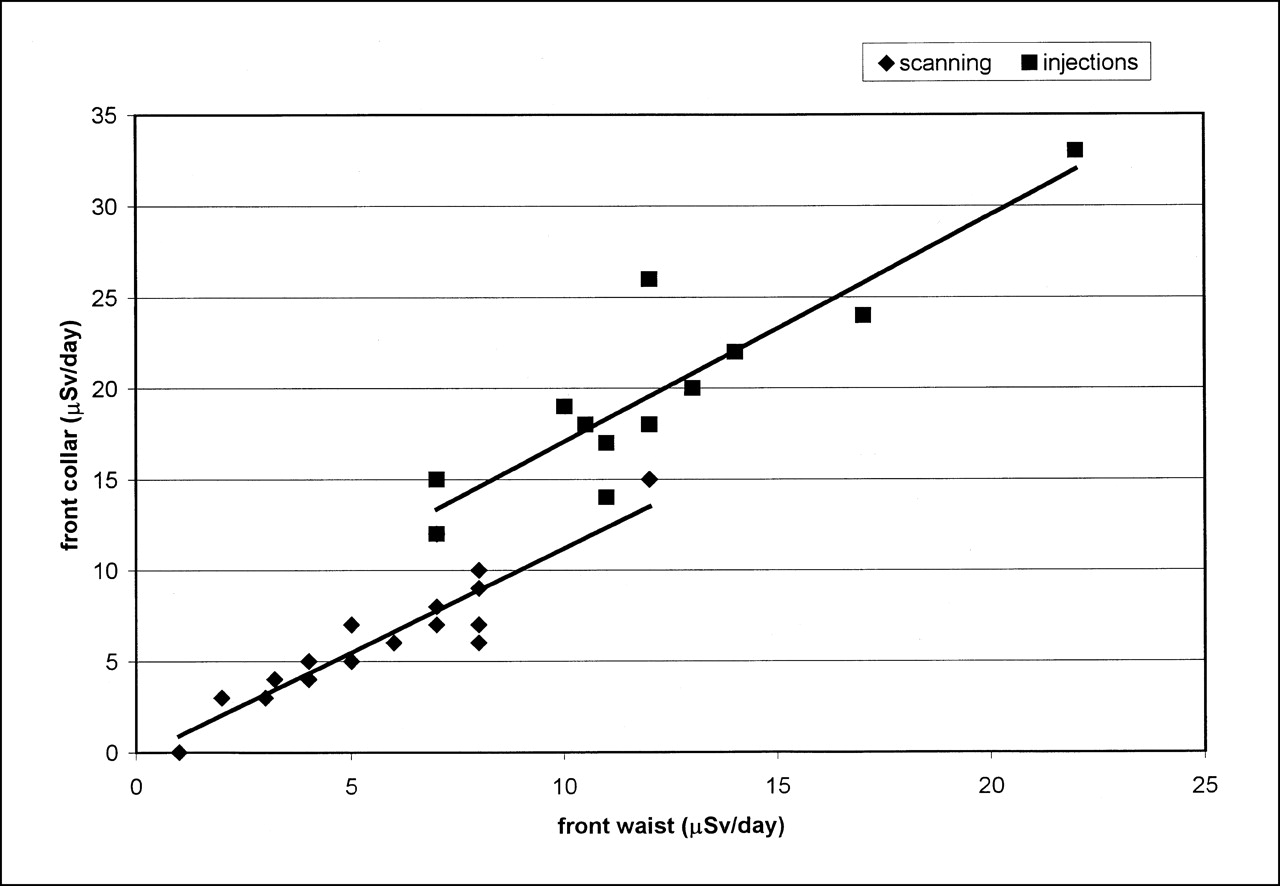
Relationship between daily doses recorded at collar and at waist: plotted separately for days spent in scanning rooms and days spent performing injections. Ratio of collar to waist is 1.1 ± 0.3 (mean ± SD) for scanning days and 1.7 ± 0.3 (mean ± SD) for injection days.
Typical Doses
Table 1 shows the front-waist doses from 30-min intervals in which the technologist was known to be performing certain scanning procedures. The dose from each interval has been doubled to provide values in microsieverts per hour. Typical administered activities for these scans are also given in Table 1. The scans have been arranged in order of decreasing average dose rate, from nearly 2 to 0.2 μSv/h. The highest individual dose reading in a 30-min interval was 5.94 μSv, or nearly 12 μSv/h, which was recorded while performing brain SPECT on a difficult patient who had to be held to remain still during scanning.
Typical Administered Activities for Different Types of Scans
The gated heart-pool scan (GHPS) doses were significantly higher than all others (P < 0.05) except for methoxyisobutylisonitrile (MIBI) stress and rest cardiac scans. MIBI stress scans had significantly higher doses than all except rest MIBI scans, scans after 131I therapy, and white blood cell scans (P < 0.05). Conversely, doses from 201Tl rest cardiac scans were significantly lower (P < 0.05) than most of the others (except for 201Tl stress scans, renal scans, and scans after 131I therapy). The scans after therapy had an average dose that was similar to many others (e.g., rest MIBI, ventilation/perfusion lung, bone, white blood cell, and 67Ga tumor scans). However, the scan after therapy evinced a particularly large spread of doses: 7 of the 10 values had an average of 0.05 μSv/h and the other 3 values had an average of 2.7 μSv/h.
Daily dose values gave an average dose rate for all activities, including processing and breaks. For scanning days, the average was 5.4 μSv/d, or 0.7 μSv/h. For injection days, the average was 12.2 μSv/d, or 1.6 μSv/h.
DISCUSSION
Direction of Irradiation
For daily doses, the slope of the graph of front waist versus back waist in Figure 1 corresponded to the attenuation through the technologist. This finding supports the assumption that radiation is generally incident from the front. However, Figure 2 shows that this assumption does break down for approximately one third of the time spent scanning a patient (38/119 thirty-minute intervals). The times when the back-to-front ratios were high corresponded to low front dose values. This finding is reasonable because irradiation from behind, by patients or other sources, will occur when these are not the technologist’s immediate concern. Conversely, the technologist would be working with, and therefore facing, any source that was close enough to impart a higher dose.
These results suggest that the assumption of front irradiation is often broken, but only when the resulting dose is low. We can calculate a closer estimate of the true incident dose by always using the higher dose, from either the front or the back. Using this formula, the average true dose across all intervals was 0.85 μSv/h, whereas the average front-waist dose was 0.82 μSv/h. These numbers are not significantly different from each other.
Uniformity of Beam
Figure 4 shows that doses measured at the waist and collar are generally equivalent when the technologist is scanning patients. The ratio of collar to waist for days spent in a scanning room was 1.1 ± 0.3 (mean ± SD), which is not significantly different from 1 (P = 0.06). However, when the technologist is performing injections, the collar reading is markedly higher: ratio of 1.7 ± 0.3 (>1; mean ± SD; P < 0.001).
These results are not unexpected. A patient presents a diffuse source that will give a fairly even dose at the collar and waist levels. However, when performing injections, the technologist would be exposed to a high point source of radioactivity, and this source would be closer to the collar than to the waist. It could be argued that the waist reading is more indicative of the dose to the whole body. However, the collar reading will provide a more conservative estimate of dose.
Typical Doses
These results cannot be regarded as definitive because they are based on a single technologist over a 2-mo period. However, they suggest that the dose received from scanning a patient can range from 0.02 to nearly 2 μSv/h.
GHPS and MIBI stress scans had the highest average dose rates. This was expected because these scans require injection of high activities. We would also expect lower doses from the 201Tl scans because of the poorer penetration of low-energy photons as well as the relatively low administered activity. However, a bone scan has the same isotope and administered activity as a GHPS but was associated with significantly lower doses. Similarly, it is usually assumed that a scan after 131I therapy will result in a high dose to the technologist; however, we found an average dose of only 0.8 μSv/h, on par with a bone scan and significantly less than a GHPS. Because the 131I-specific γ-constant is approximately 3 times that for 99mTc, a residual activity of approximately 350 MBq 131I would correspond roughly to 900 MBq 99mTc, as used for a GHPS and a bone scan.
Administered activity is apparently not the only important factor in determining the dose to the technologist. GHPS and stress cardiac scans normally require significant patient contact during setup, whereas a bone scan can often involve minimal contact. The results for the scans after 131I therapy also support this conclusion. As noted, the scans after therapy separated into 2 levels of dose rates: one at 0.05 μSv/h and the other at 2.7 μSv/h. This suggests that even a high-activity scan can give a low dose if the technologist does not spend much time setting up the patient and remembers to keep some distance whenever possible. Conversely, patients who require close contact result in a higher dose, as can be seen from the reading of 12 μSv/h while performing brain SPECT on a difficult patient.
These results can be compared with published dose estimates. Clarke et al. (1) reported doses for individual scans, including 3.5 μSv for a GHPS, 1.0 μSv for a bone scan, and 0.8 μSv for a renal scan. Assuming 40 min for a GHPS, 50 min for a bone scan, and 1 h for a renal scan, our doses for these studies would be 1.3, 0.6, and 0.4 μSv, respectively. The doses we found are thus lower, but this is probably because of the space shortage mentioned by Clarke et al., which required 2 γ-cameras to be positioned in the same room. The 2 reports agree roughly on the relative dose from the different types of scans.
Our daily readings give an average dose rate of 0.7 μSv/h for scanning days and 1.6 μSv/h for days giving injections. This represents more than a doubling of average dose rate for injections. Even so, doses recorded on injection days were probably lower than they would have been had the technologist not been wearing the dosimeter because alarms from the collar dosimeter during injections prompted the technologist to be more cautious in her work practices.
The average for scanning days (5.4 μSv/d) corresponds to approximately 1.4 mSv/y, and the average for injection days (12 μSv/d) corresponds to approximately 3.2 mSv/y. These values are broadly comparable with other reports. Pratt and Sweeney (3) reported an average annual dose of 1.3 mSv and also mention 2 technologists who dispensed radiopharmaceuticals and received >5 mSv/y. Harbottle et al. (2) reported monthly doses of 200–400 μSv, or 4 mSv/y. These doses can be compared with the allowable average annual dose for radiation workers in Australia (20 mSv/y) and with the natural background activity (approximately 2–3 mSv/y). Clearly, the doses are very low overall.
CONCLUSION
This survey suggests that the assumption of anterior irradiation is good, giving a reasonable overall measurement of incident dose. Irradiation is also reasonably uniform while the technologist is scanning patients. However, the position of the dosimeter at the collar or the waist becomes important when the technologist is administering injections, at which time the collar reading will be 70% higher than that at the waist. Doses to technologists were highest for injections, GHPS, and MIBI stress scans (1.5–2 μSv/h). The doses were lowest for 201Tl cardiac scans and thyroid scans (0.2–0.4 μSv/h). This is as expected from considerations of administered activity and isotope emissions. However, the very high dose from scanning the brain of a difficult patient and the relatively low dose from scanning after therapy suggest that the patient’s vicinity is also very important. Thus, high-activity scans are not necessarily associated with a high dose if the technologist can maintain some distance from the patient.
Footnotes
For correspondence contact: Marissa Bartlett, PhD, Department of Nuclear Medicine, 7D, Royal Brisbane Hospital, Herston, Q4029, Australia.
E-mail: marissa_bartlett{at}health.qld.gov.au


Jump to section
Related Articles
Cited By...
- Delivery Methods of Radiopharmaceuticals: Exploring Global Strategies to Minimize Occupational Radiation Exposure
- Cancer and circulatory disease risks in US radiologic technologists associated with performing procedures involving radionuclides
- Radiation Dose in Close Proximity to Patients After Myocardial Perfusion Imaging: Potential Implications for Hospital Personnel and the Public
- Occupational Radiation Dosimetry Assessment Using an Automated Infusion Device for Positron-Emitting Radiotracers
- Radiation Dose to Technologists per Nuclear Medicine Examination and Estimation of Annual Dose
- Assessment of Patient Exposure to X-Radiation from SPECT/CT Scanners
- Radiation dose measurements for personnel performing 90Y-ibritumomab tiuxetan administration: a comparison between two injection methods for dose reduction
- Review of Common Occupational Hazards and Safety Concerns for Nuclear Medicine Technologists