


Abstract
SPECT of cardiac perfusion and blood pools provides ungated 3-dimensional and gated 4-dimensional (4D) datasets of the ventricular myocardium. Modern reconstruction and review software is used to reorient the transverse thoracic slices into cardiac short-axis slices. Several validated algorithms are used to analyze these data. These programs segment out the left ventricle, determine the apical and basal limits, and then contour the endo- and epicardial surfaces. From these, 4D images of cardiac function that enable a dynamic review of wall motion are obtained. Global function in gated studies can be quantified by automatic computation of stroke volume and ejection fraction. Remapping of myocardial perfusion and wall motion into polar maps enables standardized quantification of the extent and severity of heart disease after comparison with databases of healthy hearts (normal databases). Several validated software packages make processing of these SPECT datasets comparatively easy and operator independent. The objectives of this review article are to describe the steps in the processing of a cardiac SPECT dataset for viewing and quantification, to explain the underlying algorithms used for automated processing, to compare the features of various software packages, to demonstrate how to read polar maps, and to identify and correct artifacts resulting from errors in automated processing.
Although most cardiac imaging modalities display cardiac anatomy, radionuclide imaging of the heart acquires information about myocardial perfusion and ventricular blood-pool dynamics for the evaluation of coronary artery disease and myocardial function. SPECT has made it possible to view ventricular perfusion in any plane, to map the function of the entire left ventricular myocardium into single images, to render ungated 3-dimensional (3D) and gated 4-dimensional (4D) myocardial surfaces, and to estimate chamber volumes. In recent years, several authors have published algorithms and validation studies for semiautomated and automated chamber segmentation, regional mapping, and quantification of global myocardial function from SPECT datasets.
The important features of 4 clinically validated software packages are reviewed in this article: AutoQUANT plus Cedars blood-pool gated SPECT (BPGS) (Cedars BPGS) (Cedars-Sinai Medical Center), 4D-MSPECT (University of Michigan), Emory Cardiac Toolbox (Emory University), and Baylor polar map package (Baylor College of Medicine). The first 3 are commercially available. The fourth was incorporated into an expanded prototype of 4D-MSPECT. Although the Baylor polar map package is at present not commercially available, it is discussed briefly because its unique features may be instructive. Because it has been incorporated into 4D-MSPECT, the Baylor software as evaluated is not a complete package in itself; it offers only additional polar map functionality. Although the software packages are available on most nuclear medicine systems, they were implemented and reviewed on a Pegasys Ultra nuclear medicine workstation (Philips Nuclear Medicine).
A comparative overview of the major features of the 4 software packages is outlined in Table 1. It is based on the software versions reviewed by the authors at the time of this writing. It should be kept in mind that because the developers and commercial vendors of the software packages are continually updating their products, the supported features are subject to change. For that reason, readers may find feature sets on software that they are using to be slightly different from the feature sets identified in Table 1.
Comparative Features of 3 Automated Cardiac SPECT Quantification Packages
MYOCARDIAL PERFUSION IMAGING
Automated Reorientation of Perfusion SPECT Data
Tomographic image reconstruction in a SPECT camera produces a series of parallel transverse images, or transaxial images, perpendicular to the long axis of the patient. However, the angular orientation of the left ventricle (LV) in the thorax varies among patients. Before the SPECT data can be quantified, the cardiac views across patients must be standardized by reorienting the transverse images to cardiac short-axis slices that are perpendicular to the long axis of the LV.
On the basis of feature extraction techniques operating on the contour of the approximately conical LV myocardium, most nuclear cardiology software programs automatically detect the orientation of the LV myocardium and place the LV central long axis and the apex in default positions (1–3). The LV central long-axis vector determines the orientation of perpendicular short-axis slices needed for conventional cardiac imaging.
The algorithm for default reorientation of the long-axis vector is remarkably robust, even in the presence of large myocardial perfusion defects. However, because perfusion blackouts at the basal margin or apex may confound the algorithm, the operator can manually adjust the long-axis vector as seen in transverse, sagittal, and coronal views before reorientation is performed. Previews of short-axis, vertical long-axis, and horizontal long-axis slices are provided to help the user in validating the reorientation.
Automated Detection of Myocardial Perfusion Boundaries
By use of the 3 slice orientations of the LV, the LV myocardial emission activity is segmented from any other adjacent emission activity. Next, the basal and apical limits are detected, and the endocardial and epicardial surfaces are automatically contoured. The algorithms used to accomplish these processes usually involve multiple steps and detection criteria. AutoQUANT and Emory Cardiac Toolbox use an iterative approach to feature extraction, threshold determination, clustering, and edge refinement. After each iteration, the resulting volume is automatically compared with the expected shape of the LV myocardium (4). The operator is provided with opportunities for manual intervention should the result of automatic segmentation be less than satisfactory. In 4D-MSPECT, the segmentation procedure involves location of the center of the LV and axial limits (apical and basal) and then feature extraction.
Once the LV has been segmented successfully, the software packages obtain the final epicardial and endocardial surfaces by variations of the same basic method. All programs sample along rays normal to the myocardium, along which gaussian maxima are used to estimate midmyocardial points. Next, the epicardial and endocardial surfaces are located at fixed SDs below the midmyocardial maxima. AutoQUANT and Emory Cardiac Toolbox perform this boundary detection on short-axis slices with median filtering to remove noise (4–7). 4D-MSPECT uses 36 long-axis slices at 5° angular intervals, and initial estimates of epicardial and endocardial radii around the central long axis are iteratively refined by threshold determination and neighborhood smoothing criteria (8) (Edward P. Ficaro, personal communication, 1999).
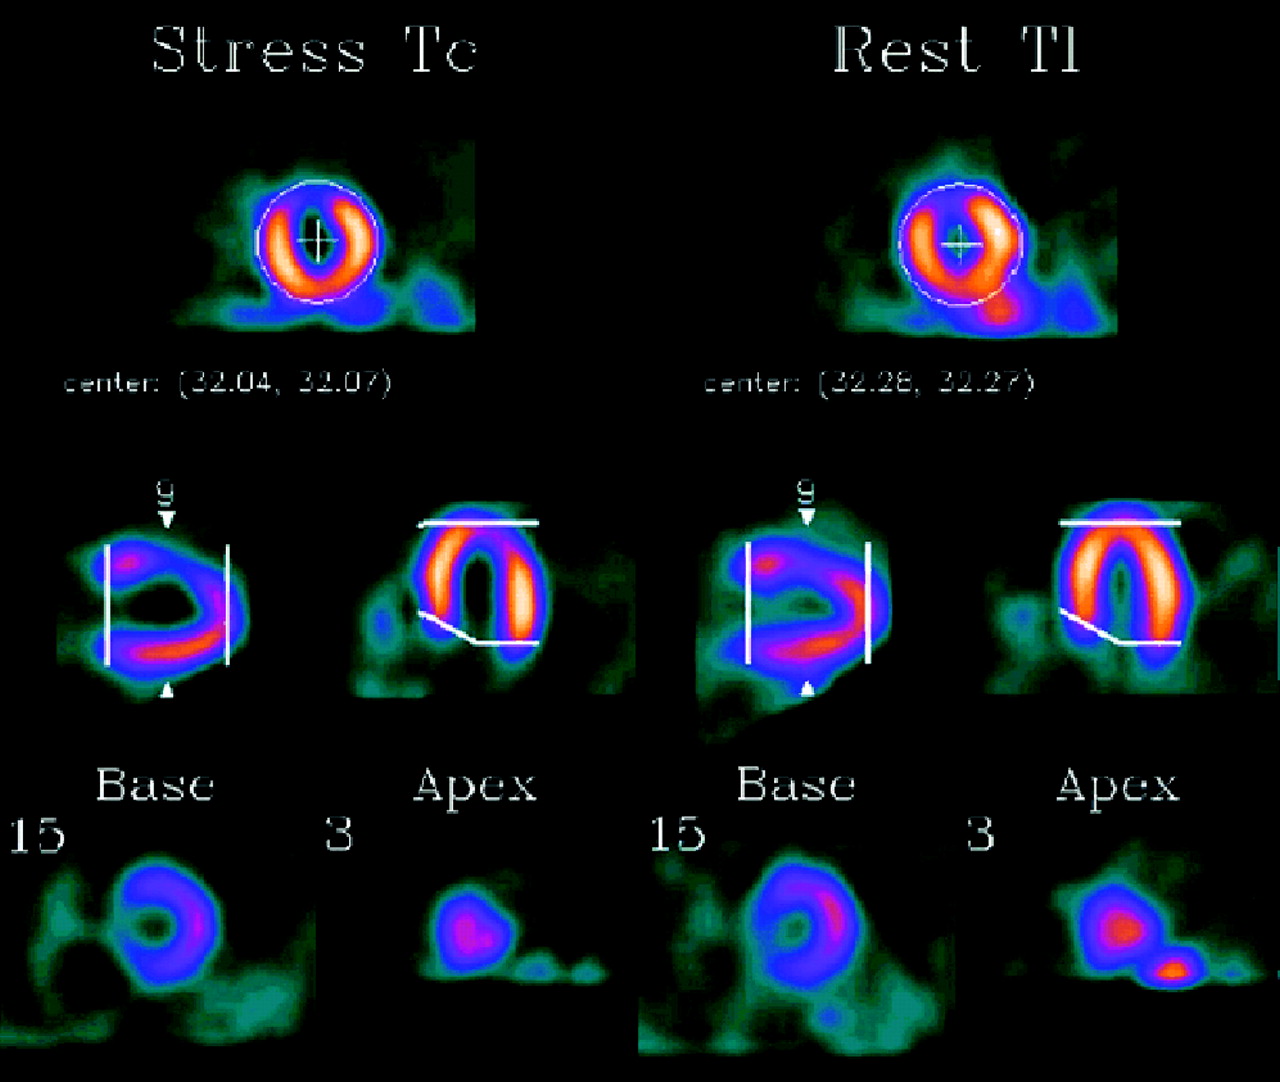
The valve plane is estimated on the basis of different models. For example, the Emory University and Cedars-Sinai Medical Center valve-plane models assume that the septal wall is shorter than the lateral wall; therefore, the basal limits are independently estimated on each side of the LV (Figs. 1 and 2). The valve-plane models share a common ancestor in the Cedars–Emory quantitative analysis (CEqual) program. On the other hand, the University of Michigan and original Baylor College of Medicine methods assume that the basal limits are the same in the septal and lateral walls but allow the user to override automated defaults by adjusting precisely where the upper basal limit should be located—at the highest complete short-axis myocardial ring or including incomplete short-axis rings above the septal wall (Fig. 3). The apical limit typically is located at the lowest short-axis plane showing a distinct myocardial cross section. If the study is gated, then each of the software packages determines these surfaces and limits for each gating interval in the cardiac cycle.
Automatic detection of LV valve plane in 2 segments of septal and lateral walls in perfusion SPECT. Emory Cardiac Toolbox.
Multiplanar automatic contouring of LV myocardium in gated perfusion SPECT. Cine-loop display would show dynamic wall motion through complete cardiac cycle. AutoQUANT.

Automatic detection of basal and apical limits and default placement of central long axis of LV in perfusion SPECT. All cursors can be manually adjusted by user. 4D-MSPECT.
4D Epicardial and Endocardial Surface Renderings from Perfusion Data
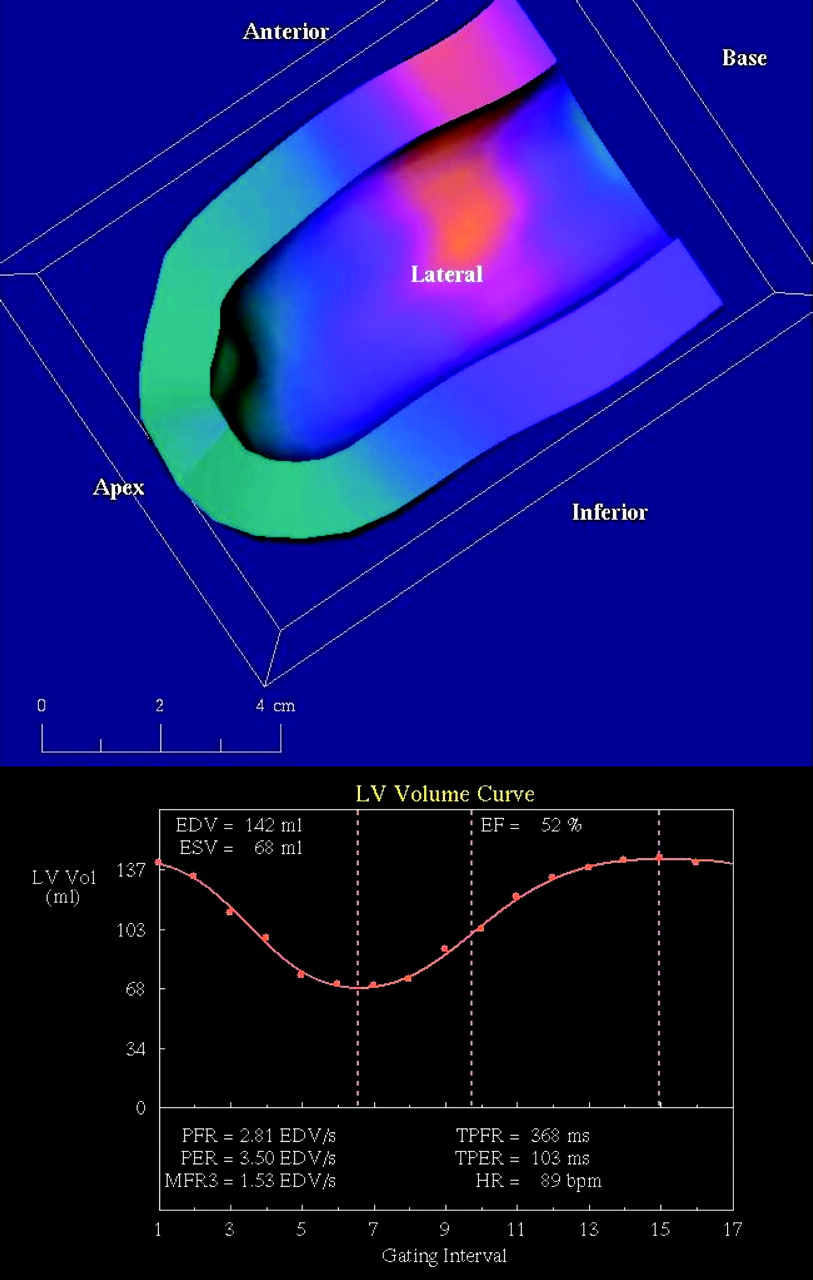
The automatically contoured epicardial and endocardial surfaces can be displayed as 3D surface renderings (Figs. 4–7⇓⇓⇓), which are sufficient for displaying myocardial perfusion. However, for the heart, additional significant diagnostic information is related to its function: ventricular wall motion and actual ability to pump blood. Gated SPECT studies enable the display of epicardial and endocardial surfaces at preset intervals (usually 8 or 16) across the complete cardiac cycle. Endocardial end-diastolic volume (EDV) and end-systolic volume (ESV) are used to calculate stroke volume (SV) and ejection fraction (EF). The entire sequence of 3D images can be displayed dynamically by cine-loop playback through a complete cardiac cycle as a 4D surface rendering of ventricular wall motion or wall thickening. The surface renderings can be rotated for viewing from any arbitrary angle, and each surface typically can be viewed as an opaque color mapping of perfusion or as a transparent wire-mesh frame. A dual-study display enables comparative review of stress and rest studies or, for that matter, any 2 studies of the same general nature. Clinical validation studies have shown that these surface renderings are intrinsically reproducible and accurate in their predictive value for global myocardial function (9–15).

Gated stress 3D surface rendering of perfusion SPECT displayed as 4D cross section of epicardial and endocardial wall motion viewed from any arbitrary perspective. Blue apical region demonstrates large perfusion defect that extends up inferior wall. EF is automatically calculated from maximum and minimum points on LV volume curve. 4D-MSPECT.

Gated 3D surface rendering of perfusion SPECT results in 4D display of epicardial and endocardial wall motion. (Left) End diastole. (Right) End systole. EF is automatically calculated. ANT = anterior; INF = inferior; SEPT = septal. AutoQUANT.

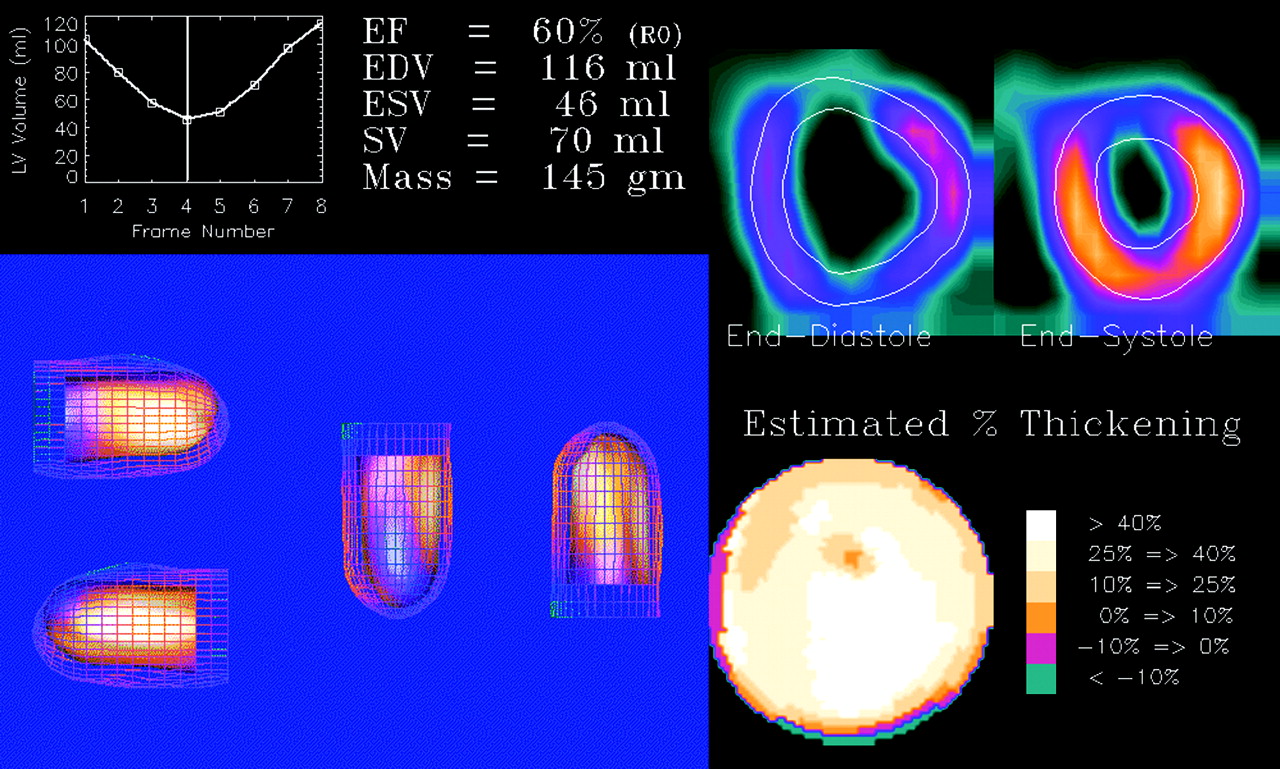
4D display of gated perfusion SPECT shows epicardial and endocardial wall motion with color mapping of anterior wall myocardial perfusion defect. This defect can be seen in center image in lower left panel, where anterior wall is facing reader. LV EF and myocardial mass are automatically calculated from endocardial and epicardial volume data. Additional reference displays are sample short-axis slices and wall thickening polar map. Emory Cardiac Toolbox.

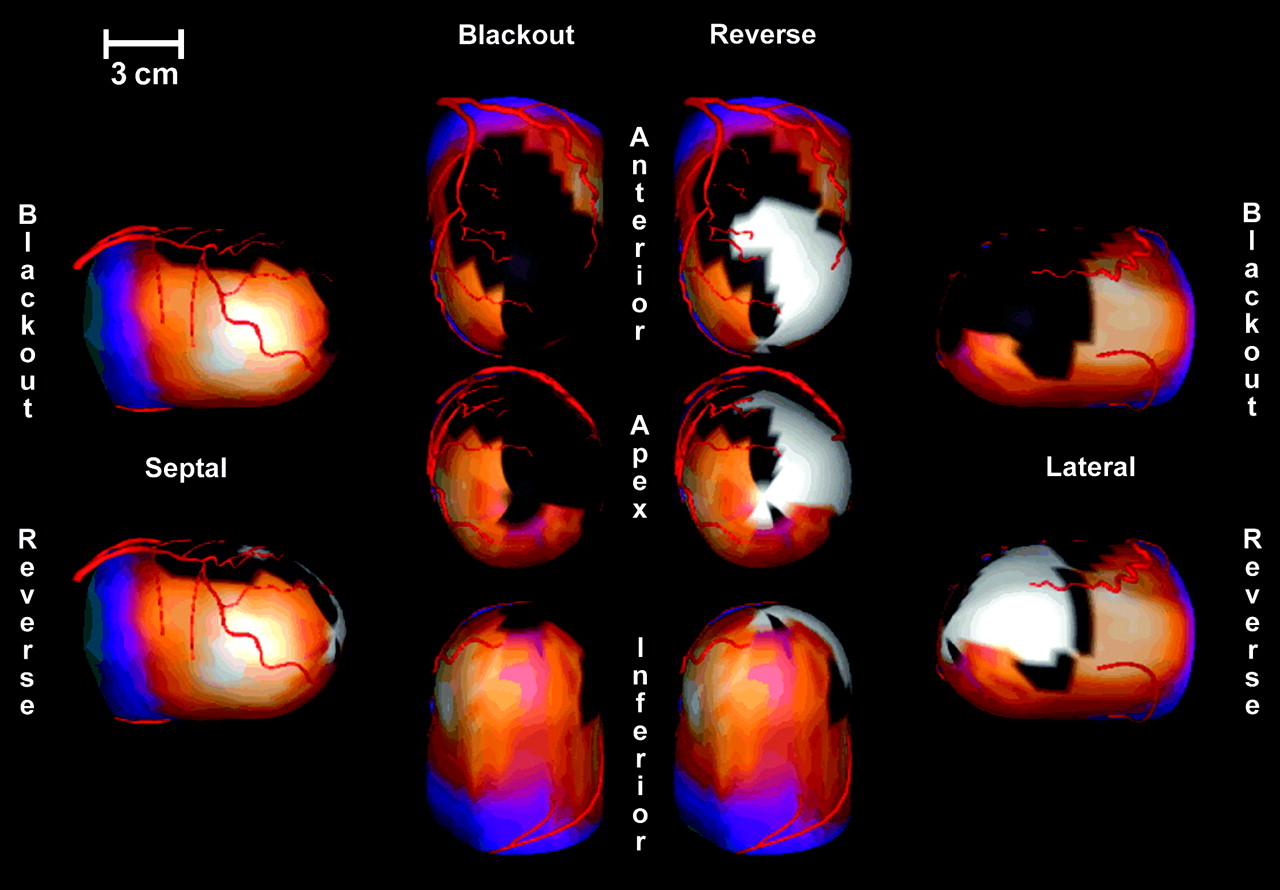
Generic coronary artery trees overlaid on 3D surface renderings of myocardial perfusion SPECT suggest correlation between regions of perfusion defect (blackout areas) and coronary arteries or branches (in this case, LAD) that may be severely stenotic or occluded. Emory Cardiac Toolbox.
Figure 4 is a gated stress study showing a large region of perfusion defect in the apical half of the LV myocardium, as indicated by the color mapping. Although the EF is calculated to be marginally within normal limits, the 4D cine loop of the myocardium shows qualitatively how the basal half of the myocardium undergoes sufficient systolic contraction to reduce overall endocardial volume by half, despite reduced wall motion in the apical half of the myocardium.
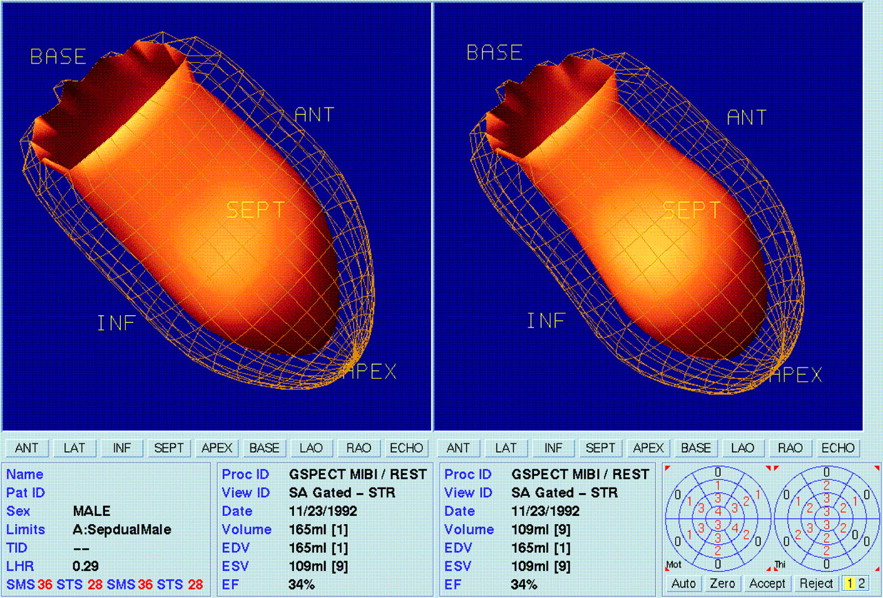
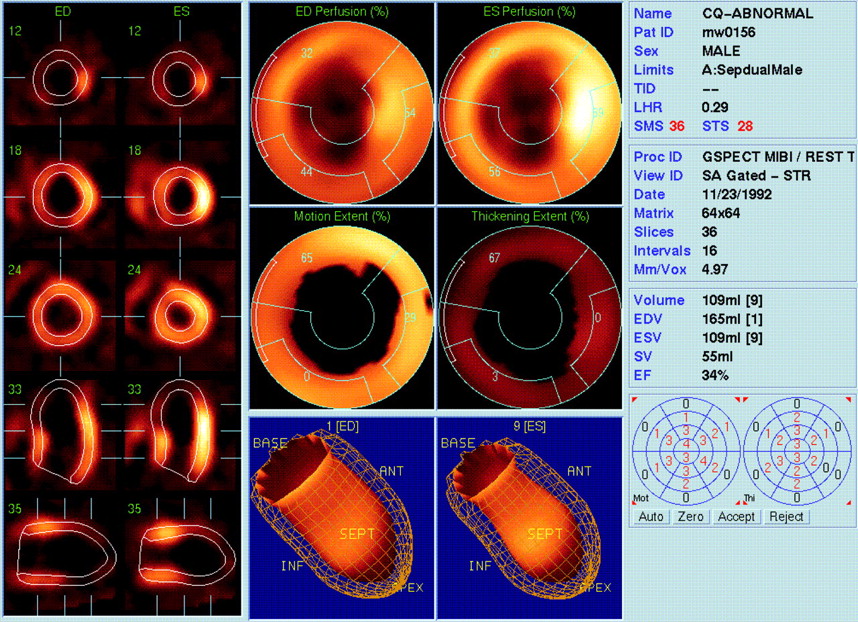
Figure 5 is a gated stress study in a 50-y-old man. The two 3D surface renderings at end diastole and end systole graphically demonstrate a marked defect in systolic contraction in the apical half of the LV myocardium. An abnormal EF of 34% was calculated. This same study was viewed with both AutoQUANT and 4D-MSPECT, which resulted in identical EFs. Perfusion maps from both software packages confirmed a large apical region of severe ischemia. Gated perfusion studies provide an opportunity to correlate perfusion defects, regional wall motion abnormalities, and global function defects.
A functional analysis window displays a different set of 4D surface renderings of epicardial and endocardial wall motion with color mapping of perfusion (Fig. 6). This compact display also shows computation of EF from an LV endocardial volume plot, LV SV, estimation of LV mass from myocardial volume, sample short-axis slices, and a polar map of wall thickening. Although EF and wall thickening appear normal, both 2-dimensional (2D) slices and 3D renderings show a distinct anterior wall myocardial perfusion defect.
Figure 7 shows a large anterior wall perfusion blackout defect comprising both viable ischemic tissue and nonsalvageable scar tissue, as indicated in the reversibility surface renderings. A blackout pixel is defined as having a count intensity less than a user-specified percentage of, or number of SDs below, the mean for that pixel in a standardized healthy population; blackout pixels are used as visual indications of perfusion defect size. The generic coronary artery overlays (obtained elsewhere from a standardized myocardium) suggest that much of the perfusion defect may be attributable to occlusion of the left anterior descending (LAD) coronary artery and that viable tissue may be receiving collateral flow from the left circumflex (LCX) coronary artery. Because of patient-to-patient variability in coronary artery trees, a final determination of where the occlusions are located can be confirmed only by other methods, such as coronary angiography.
Polar Maps of Ventricular Perfusion
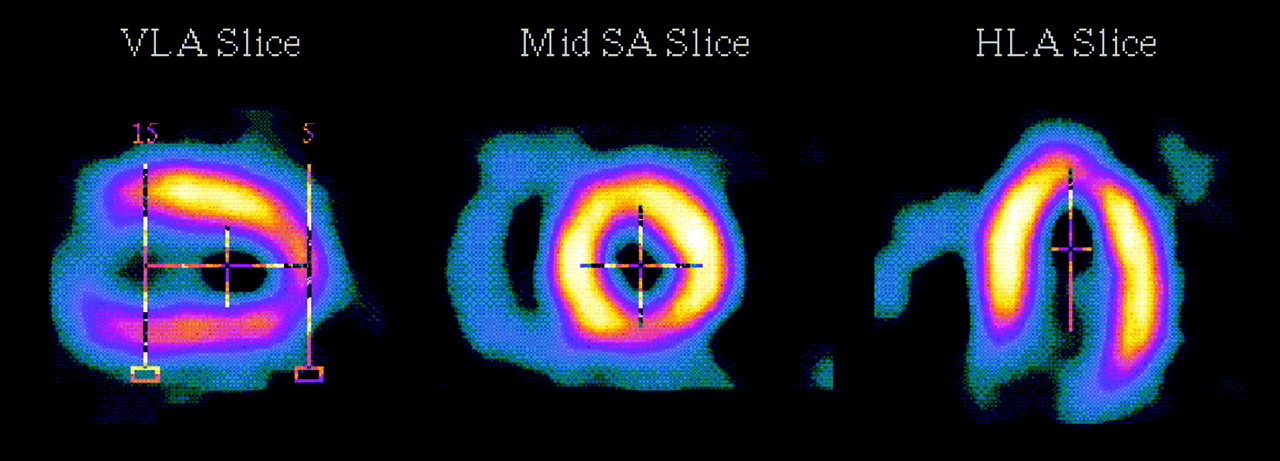
Polar maps provide a standardized 2D representation of the 3D myocardium for reproducible pixel-by-pixel comparisons of rest and stress studies, follow-up of a patient over time, or comparison between patients. Several different polar map generation algorithms are in widespread use. Although all methods use cylindrical sampling around the basal and midventricular walls, the methods differ in their samplings of the apical region (Fig. 8A). The Cedars-Sinai Medical Center and Emory University methods map spherical sampling coordinates (ϕ,θ) in the apical region into polar coordinates (r,θ) in the polar map (15). The University of Michigan method maps the entire LV myocardium by cylindrical sampling (16), whereas the Baylor College of Medicine method maps the apical region by radial sampling (17). Because of these differences, polar maps generated by one method are not directly comparable to polar maps generated by another method. It is important to choose nuclear cardiology software developed at one institution and keep it for comparability with historical patient archives and patient follow-up. All methods have been clinically validated for regional perfusion, wall motion, and wall thickening (16–23).
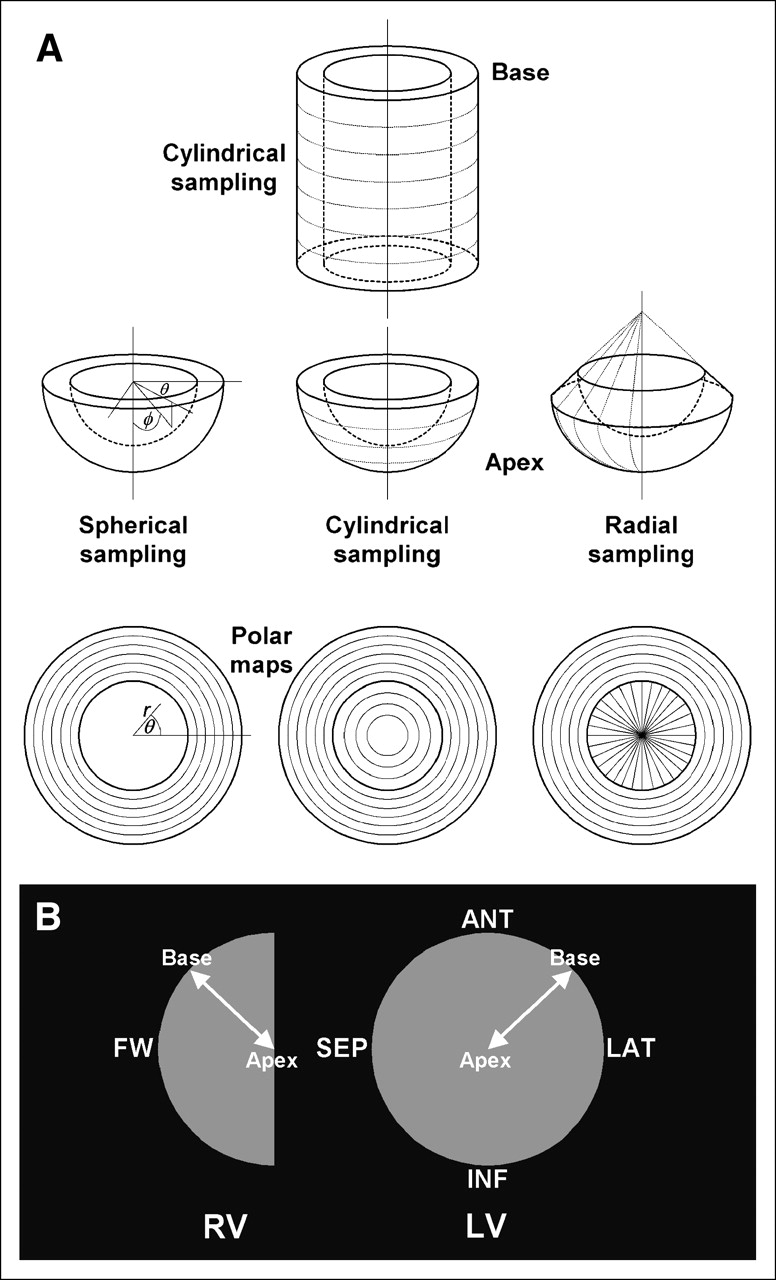
Polar mapping conventions. (A) Three methods for mapping 3D myocardium in 2D polar maps: Cedars-Sinai Medical Center–Emory University, University of Michigan, and Baylor College of Medicine. Basal and midventricular walls are mapped by cylindric sampling in all methods. Apex is mapped by spheric, cylindric, and radial sampling, respectively. (B) Orientations of polar maps for RV and LV. In LV polar map, anterior (ANT) wall is at top, septal (SEP) wall is at left, inferior (INF) wall is at bottom, lateral (LAT) wall is at right, apex is at center, and base is at circumference. In blood-pool SPECT, RV also is mapped to hemipolar map for RV free wall (FW).
Fortunately, the polar map orientation convention used by all methods is the same. Polar maps are viewed as if looking at the myocardium from the apex with the anterior LV wall at the top and the septal wall to the left (Fig. 8B). In blood-pool SPECT, the right ventricle (RV) also can be viewed with endocardial wall motion mapped to a hemipolar map representing the RV free wall. The apex is always at the center of each polar map, and the base is always mapped to the peripheral circumference.
Figure 9 shows stress and rest studies for the same patient as in Figure 5. In comparison with the respective databases of healthy hearts (normal databases) for poststress technetium (99mTc) and rest thallium (201Tl) studies, there is a large perfusion defect in the apex and lower anterior, septal, and inferior walls. The defect is partially reversible, that is, a stress defect that significantly improves (reverses) in the rest study. The reversibility polar map is calculated as normalized rest values minus normalized stress values, in which positive pixel values provide an indication of myocardial viability (Fig. 9, left column of polar maps). The University of Michigan perfusion blackout defect polar maps display all perfusion values below 50% as blackout pixels (Fig. 9, center column). In the polar map at the bottom of the center column of Figure 9, blackout pixels are shown as either reversible (cross-hatched areas, with a reversibility of ≥10 percent) or fixed (black areas, with a reversibility of <10%), indicative of potentially nonviable scar tissue. Reversibility polar mapping has been demonstrated to be of prognostic value in assessing regional myocardial viability and in differentiating ischemia from scar tissue (24,25). The graphic overlays indicate the approximate vascular beds fed by the LAD coronary artery, the LCX coronary artery, and the right coronary artery; the regional perfusion defect extent (defect size as a percentage of the total area of a myocardial region) and the regional extent of ischemic reversibility versus scar tissue are quantified in the right column of Figure 9.
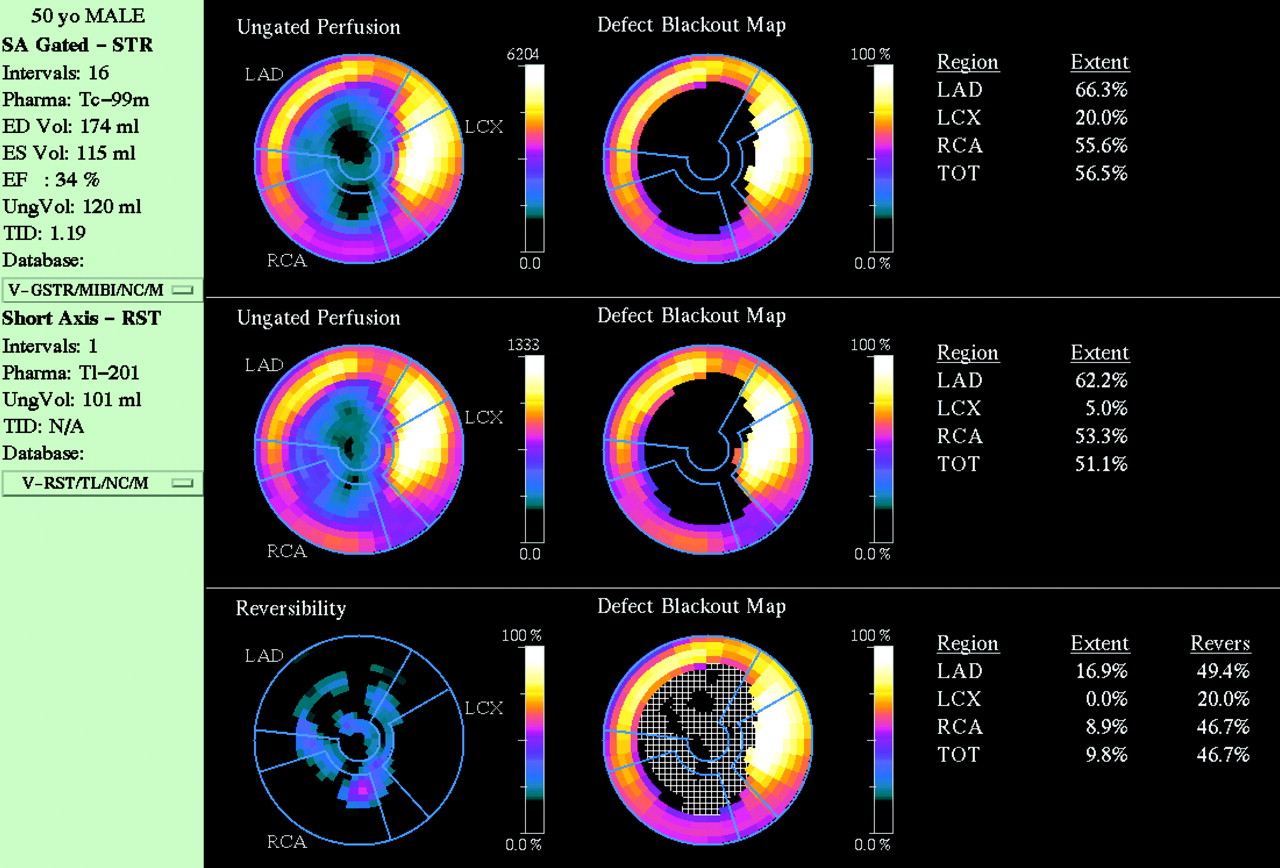
Polar maps of gated dual-isotope perfusion studies from Figures 5 and 6 show stress, rest, and reversibility (second column from left). Same data were compared with respective normal databases to display blackout defect polar maps (center column). Defect extents and reversibility are automatically calculated for each vascular region of myocardium indicated by graphic overlays (blue lines). LAD = left anterior descending coronary artery; LCX = left circumflex artery; RCA = right coronary artery; TOT = total. 4D-MSPECT.
The left column of Figure 9 displays several global quantifiers of LV myocardial function, including gated and ungated endocardial volumes, EF, and transient ischemic dilatation (TID). TID is another prognostic indicator of severe coronary artery disease and is calculated as the ratio of ungated stress LV endocardial volume to ungated rest LV endocardial volume (26,27). On the basis of clinical studies, a normal TID is ≤1.22 (26). TID is automatically computed for dual-isotope stress-rest studies in all 4 perfusion quantification software packages.
The software packages AutoQUANT (Fig. 5) and 4D-MSPECT (Fig. 9) estimate EDV and ESV in slightly different ways (as discussed in “Automated Detection of Myocardial Perfusion Boundaries”), but because the methods are self-consistent in the way they estimate EDV and ESV, they both calculate the same EF of 34%, which is the most important prognostic parameter.
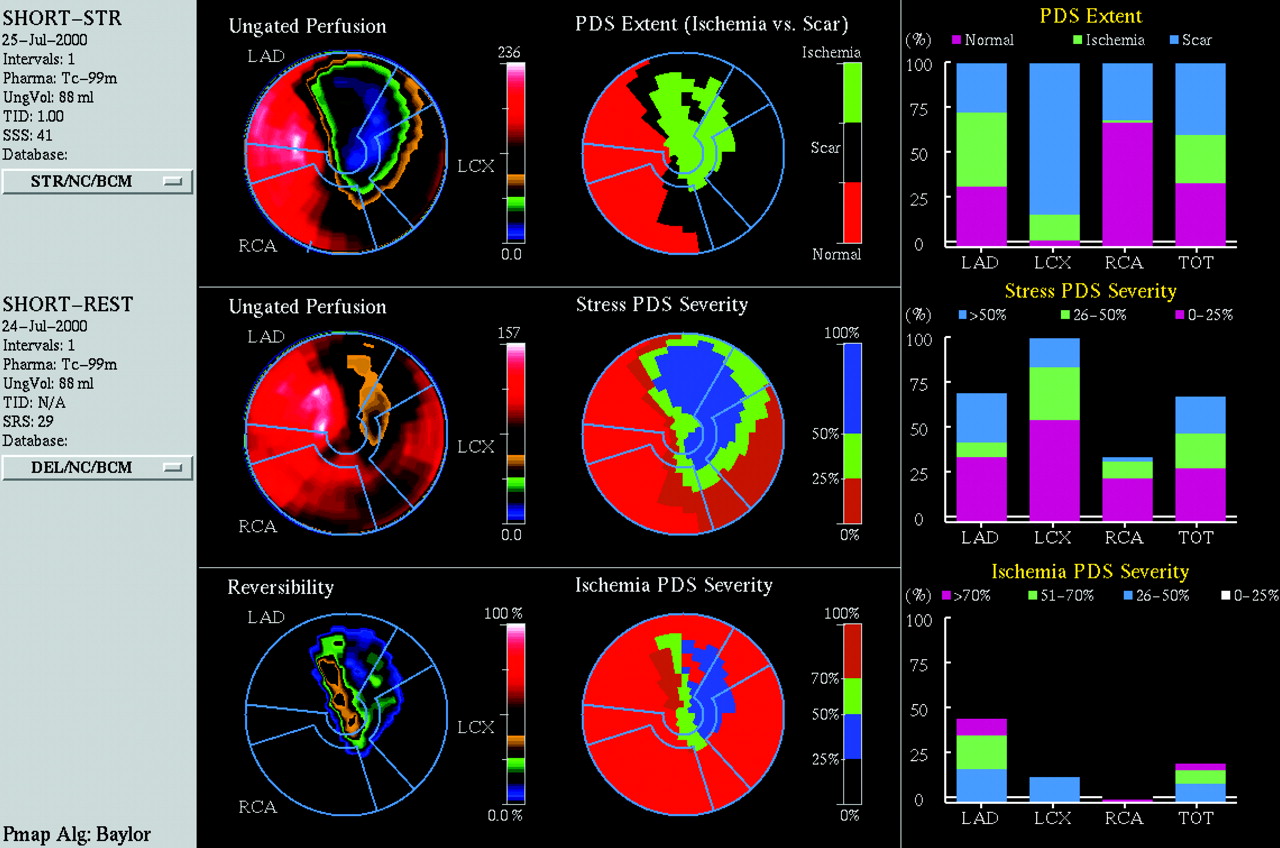
Figure 10 shows Baylor polar maps of stress and rest studies for a patient with myocardial infarction affecting all regions except the septal wall. It shows a large island of reversible ischemia in a widespread field of nonreversible scar tissue. Even though the perfusion defect severity is greatest in the field with reversible ischemia, this region of myocardium recovers during rest and, thus, is viable and may be a candidate for coronary revascularization. The stress perfusion defect size severity polar map (Fig. 10, middle of center column) shows perfusion defect severity classifications in the perfusion defect area alone. The graphs show the percentages of vascular regions falling into categories of ischemia and scar, the severity of perfusion defects during stress, and ischemic perfusion defect size severity.

Polar maps of ungated perfusion studies show stress, rest, and reversibility (second column from left). Same data were compared with respective normal databases to display perfusion defect sizes (PDS): mapping of ischemia versus scar tissue, stress severity, and ischemia severity (center column). Areas of myocardium falling into each classification are automatically graphed for each vascular region of myocardium indicated by graphic overlays (blue lines). 4D-MSPECT with Baylor polar map package.
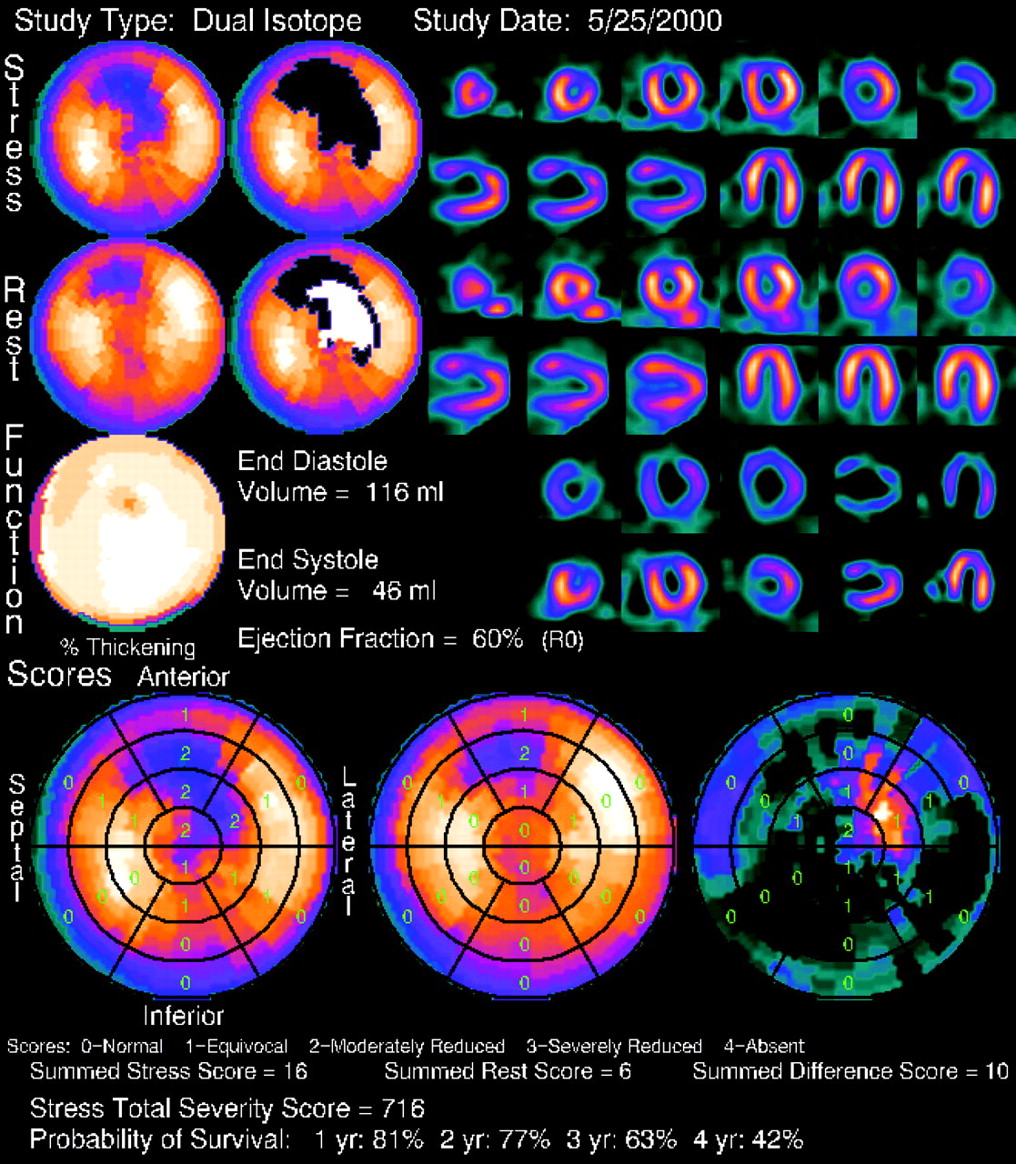
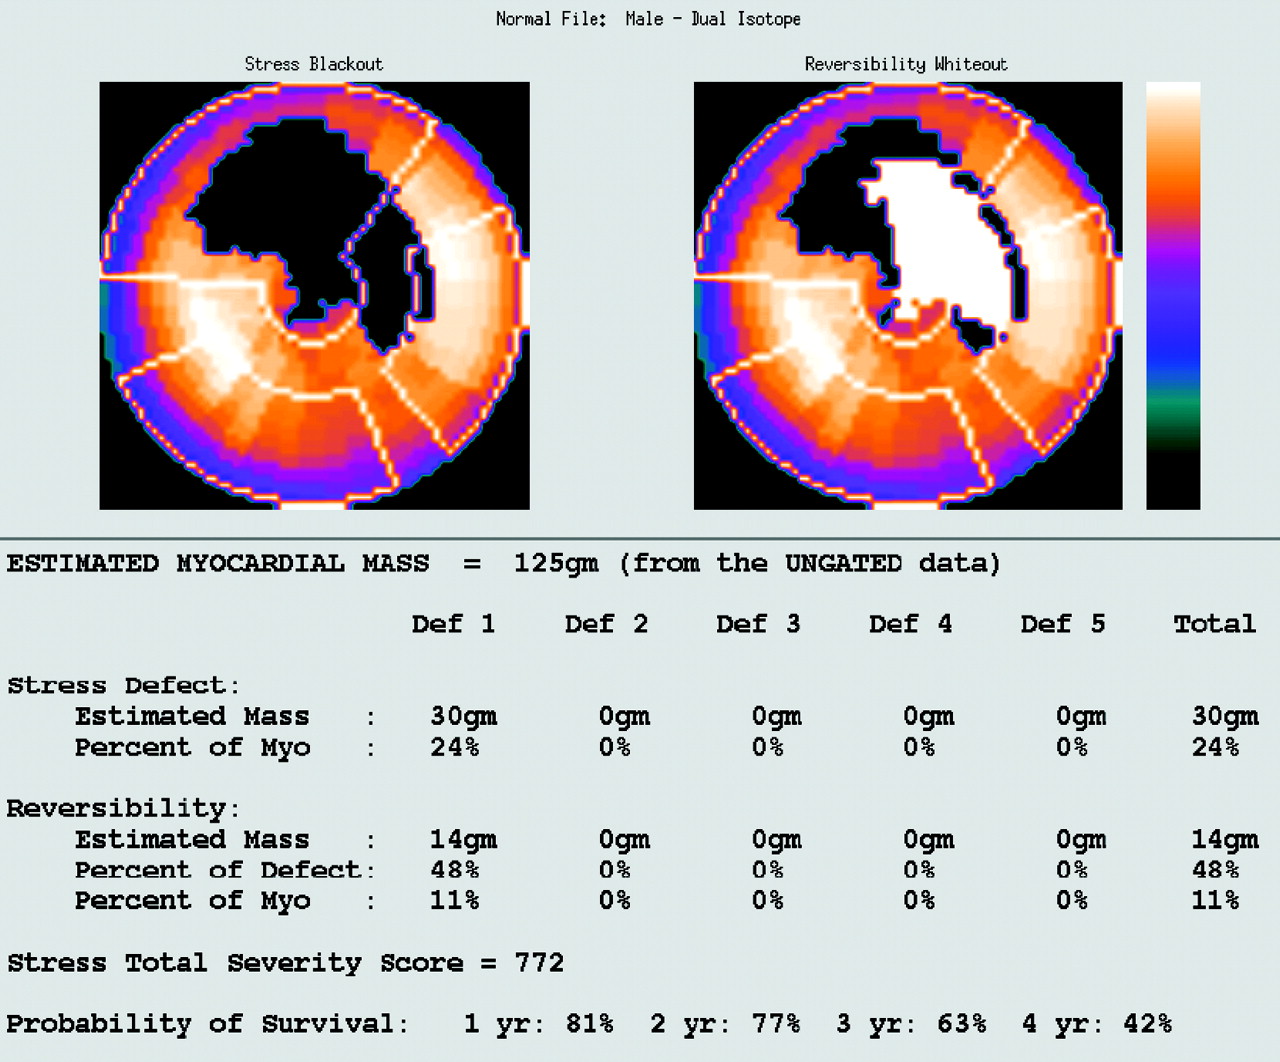
Myocardial perfusion polar maps derived from poststress 99mTc and rest 201Tl studies are shown in Figure 11 after comparison with a normal database. These Emory Cardiac Toolbox blackout polar maps indicate a large stress perfusion defect in the anterior and lateral walls; approximately half of this defect is shown to be reversible (Fig. 11, white area) on the reversibility map. The masses of the stress perfusion defect and its reversible portion are estimated on the basis of their percentages of the total estimated myocardial mass. The stress total severity score is the sum of the blackout pixels in the stress blackout polar map, each weighted by the number of SDs below the mean. The probability of survival at up to a 4-y follow-up is derived from the patient's stress total severity score according to clinical study data (28).

Myocardial perfusion stress polar maps show large perfusion defect in anterior and lateral walls, half of which significantly improves (reverses) in rest study. Masses of one or more stress defects (Def) and reversible portions of defects are automatically tabulated, along with stress total severity score and probability of survival. Emory Cardiac Toolbox.
Figure 12 shows a summary of the same studies as in Figure 11 referenced to a different normal database. Emory Cardiac Toolbox polar maps indicate the same large myocardial perfusion defect in the anterior and lateral walls, with partial reversibility. The 20-sector overlay permits the user to qualitatively assign a perfusion score to each segment for stress and rest. Difference scores for reversibility and summed scores for each polar map are automatically calculated. Rounding errors account for the apparent discrepancies between the reversibility polar map and the difference scores. The sum of the difference scores is a global indicator of reversibility. Two-dimensional short-axis, vertical long-axis, and horizontal long-axis slice sequences provide additional views of the perfusion defect seen at both stress and rest. The reversible apical perfusion defect seen on horizontal long-axis slices only after stress and the fixed anterior perfusion defect (scar) visible on short-axis and vertical long-axis slices correlate with the polar map data.
Summary of same dual-isotope perfusion SPECT study as in Figure 11 viewed in slices and polar maps under stress and rest. Polar maps show perfusion, defect extent, wall thickening, and segmental scoring of perfusion defect severity. EDV, ESV, EF, summed stress scores, and probability of survival are automatically calculated. Emory Cardiac Toolbox.
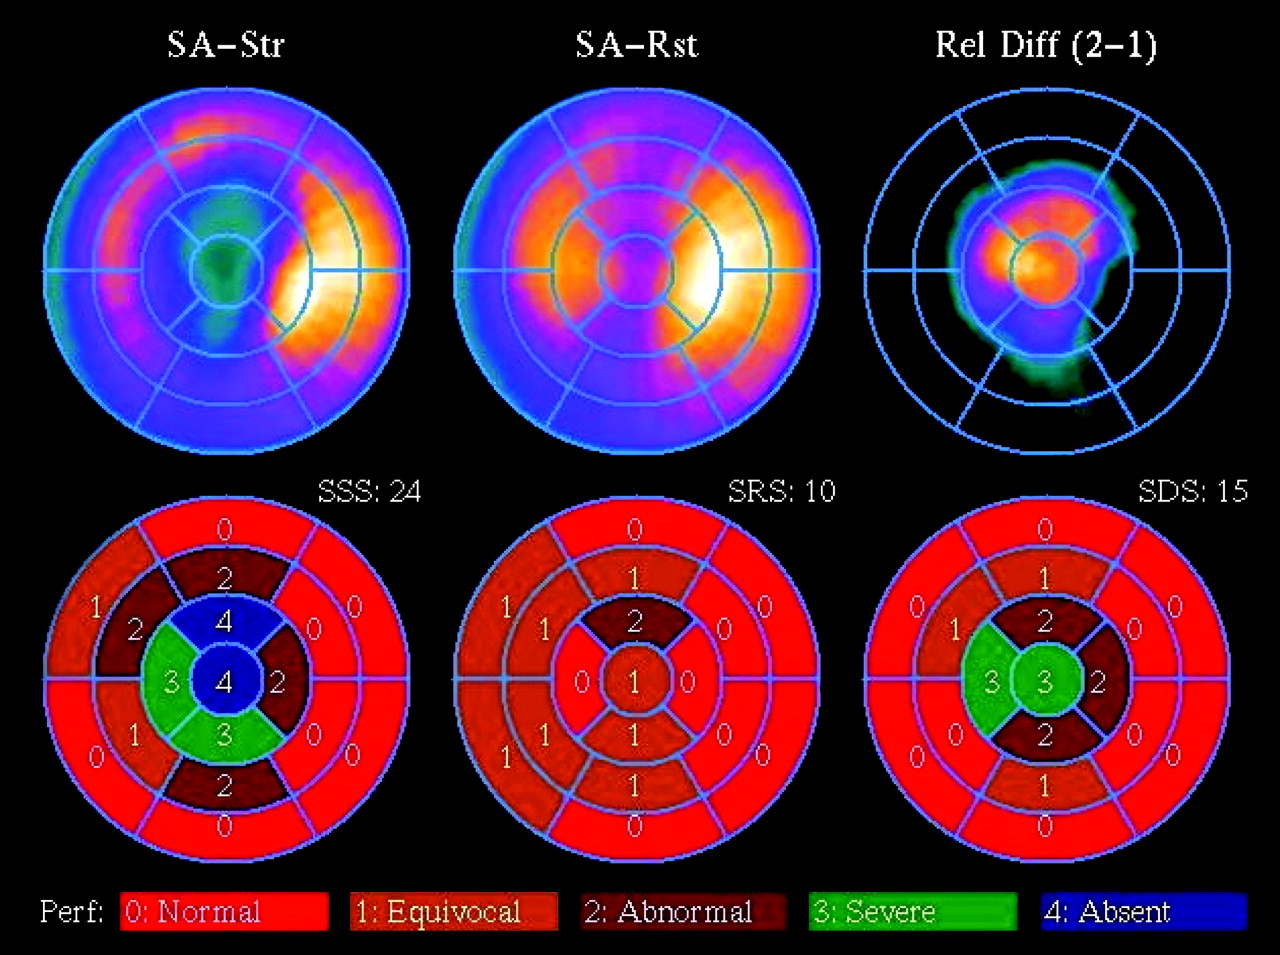
Fully automated perfusion scoring on 17-sector overlays is shown in Figure 13. The significant short-axis difference scores (SDS) in the reversibility polar maps (Fig. 13, right column) indicate that the apical perfusion defect consists of viable tissue. These polar maps were generated by comparison with a normal database.

Fully automated perfusion (Perf) scoring on stress, rest, and reversibility polar maps indicates completely reversible apical perfusion defect. SA-Str = short-axis stress; SA-Rst = short-axis rest; Rel Diff = relative difference; SSS = short-axis stress scores; SRS = short-axis rest scores; SDS = short-axis difference scores. 4D-MSPECT.
Polar Maps of Ventricular Wall Motion
Gated perfusion SPECT records myocardial wall motion, which not only can be played back dynamically as slices or 4D epicardial and endocardial surfaces but also can be displayed as static color-coded wall motion and wall thickening polar maps. A representative example is shown in Figure 14 from the Quantitative Gated SPECT (QGS) module of AutoQUANT, in which Cedars-Sinai Medical Center polar maps show wall motion defect extent, wall thickening defect extent, segmental wall motion scoring, and segmental wall thickening scoring. The large periapical wall motion defect correlates well with the hypoperfused area seen in the perfusion polar maps. Segmental wall motion scoring and calculation of SV and EF are performed automatically.

Dual-isotope gated perfusion SPECT shows large periapical perfusion defect viewed as slices; perfusion, wall motion, wall thickening, and segmental scoring polar maps; and 4D surface renderings with automatic calculation of SV and EF. ED = end diastole; ES = end systole; ANT = anterior; INF = inferior; SEPT = septal. AutoQUANT QGS.
Normal Databases
Normal databases contain a statistically significant number of polar maps of healthy hearts. A different database is set up for each sex, acquisition protocol (e.g., 99mTc-sestamibi, 201Tl, dual-isotope), stress versus rest, and type of data (i.e., perfusion, wall motion, or wall thickening). In addition, 4D-MSPECT and the Baylor polar map package make it possible to create normal databases differentiated with regard to the type of stress (e.g., exercise stress, dobutamine pharmacologic stress). In the prototype 4D-MSPECT with the Baylor polar map package, in which 2 different polar map generation algorithms are supported concurrently, separate normal databases can be set up for each polar map algorithm. Assuming that basal and apical limits are set with the same criteria and that the angular rotation of the heart is aligned by matching RV junctions in the left myocardium, a patient polar map can be compared with an applicable normal database by matching polar map values pixel by pixel to the means and SDs in the normal database.
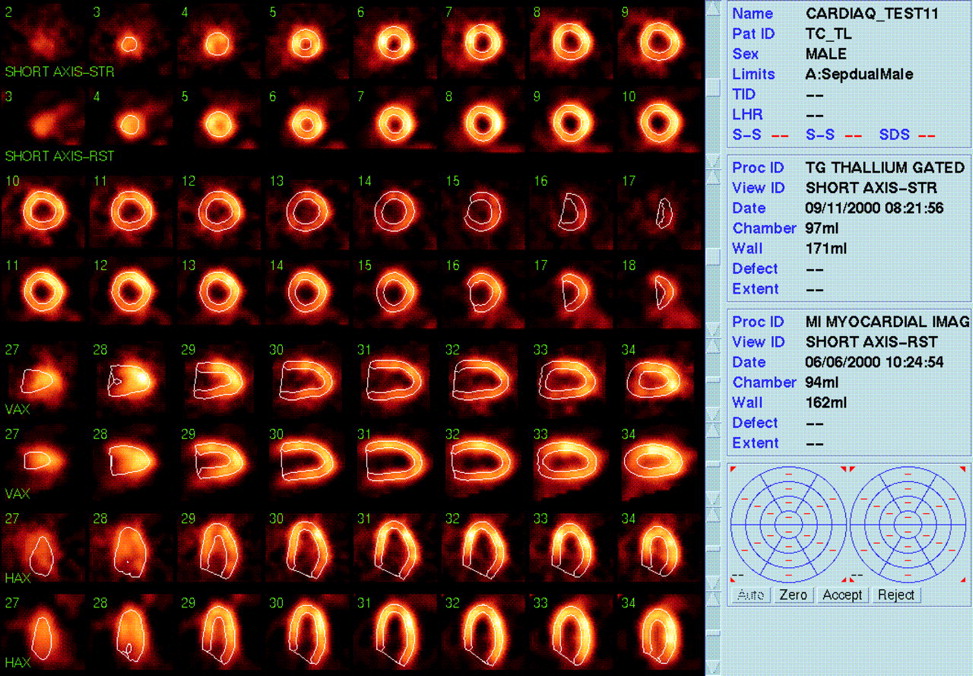
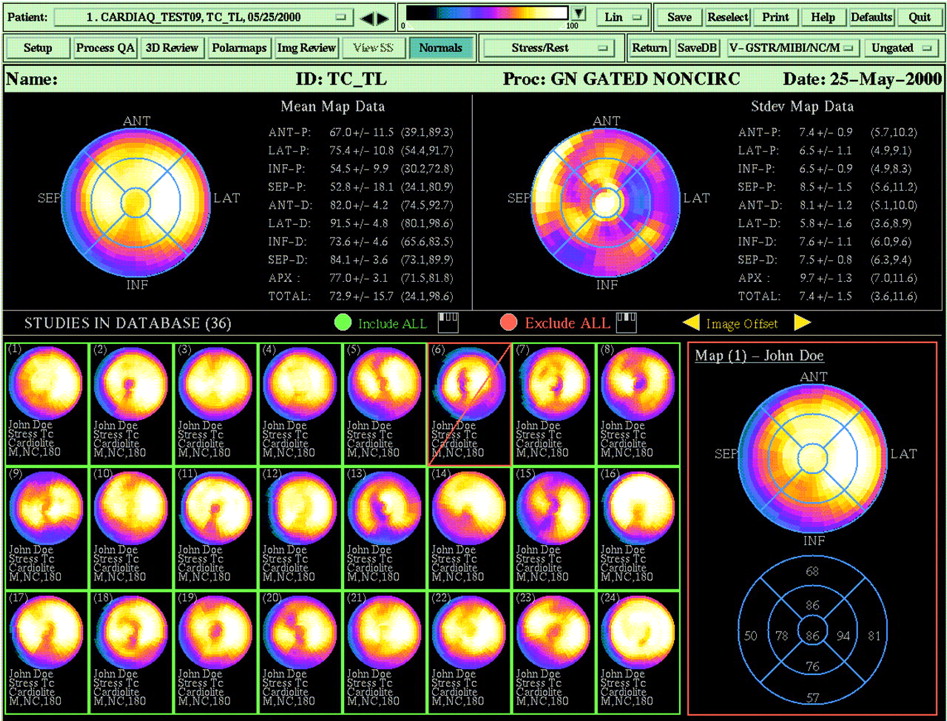
4D-MSPECT and AutoQUANT each provide a normal database editor by which users can create and modify their own databases and select various cases for inclusion in or exclusion from the databases. Figure 15 shows an example for 4D-MSPECT (29). The population characteristics of a database can be examined further by looking at the segmental mean and SD data and adjusting the population so that segmental values vary over acceptable normal ranges. In practice, databases comprising 100 or more healthy hearts typically are needed for clinically useful statistical comparisons.

Normal database editor displays thumbnail images of entries in database. Mean and SD map data are shown for selected patient study and can be included or excluded from active database. 4D-MSPECT.
GATED BLOOD-POOL IMAGING
Automated Segmentation of Ventricular Blood Pools
In gated blood-pool SPECT, the first and most challenging task that the software must solve is biventricular segmentation of reoriented datasets. The Cedars BPGS software makes a preliminary determination of which major chamber blood pool is in the LV and draws a default ellipse around it (Fig. 16A). The operator can adjust this ellipse, if necessary, to ensure that it encloses the entire LV chamber while excluding all of the RV chamber. The software segments the 2 ventricles from the atria on the basis of phase differences and then automatically contours both ventricular chambers by use of conventional edge detection criteria (Fig. 16B). This procedure is done for each gating interval. Reproducible chamber segmentation is achieved for consistent 3D surface rendering, polar mapping, and volume measurements (30,31).

Biventricular segmentation in gated blood-pool SPECT. (A) Program begins by drawing ellipsoid region of interest to encompass LV blood pool in 3 short-axis planes, 1 horizontal long-axis plane, and 2 vertical long-axis planes. If necessary, user may manually adjust any ellipse. (B) Automatic segmentation algorithm finishes task by automatically contouring RV and LV endocardia. Cedars BPGS.
4D-MSPECT also relies on operator intervention to ensure that the designated region encompasses the entirety of the LV chamber, after which edge detection automatic contouring is applied to the LV chamber blood pool. However, 4D-MSPECT does not do this for the RV chamber.
4D Endocardial Surface Rendering and Quantification
In blood-pool SPECT, the endocardial surfaces of both the LV and the RV are surface rendered as shown in Figure 17. The Cedars BPGS software automatically provides 4D cine-loop visualization of biventricular wall motion for gated blood-pool datasets. The wire-mesh diastolic surface provides a graphical reference for the visualization of systolic contraction and, thus, of myocardial wall excursion.
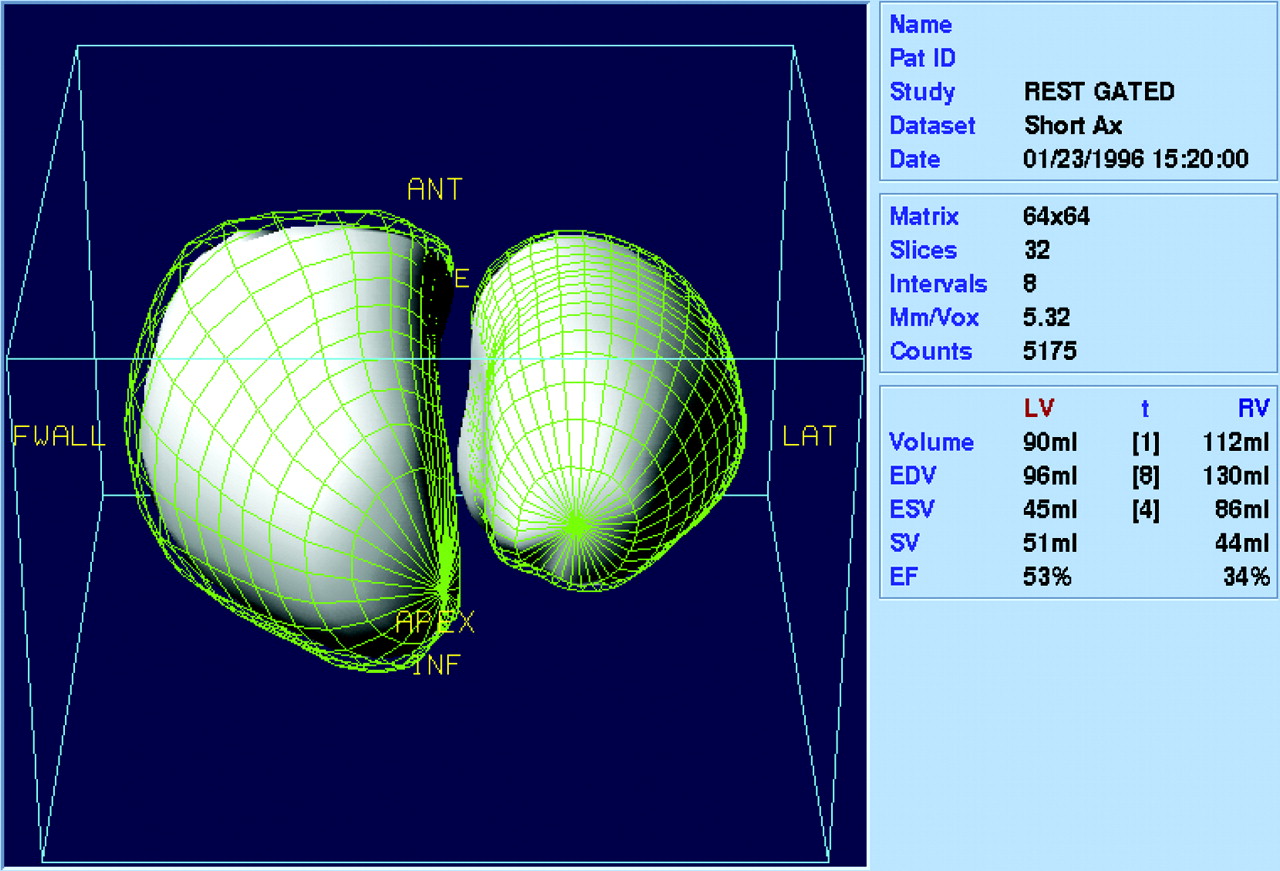
Gated 3D surface rendering of blood-pool SPECT results in 4D display of endocardial wall motion in both ventricles. SV and EF are automatically calculated for LV and RV in this healthy heart. ANT = anterior; INF= interior; LAT = lateral; FWALL = free wall. Cedars BPGS.
Recording of LV and RV chamber volumes at multiple intervals throughout the cardiac cycle permits the maximum EDV and the minimum ESV to be determined; from these, the SVs and EFs are automatically calculated. This information is of particular importance in assessing a patient for congestive heart failure. If the LV SV and the RV SV are substantially unequal, then blood is backing up in either the peripheral or the pulmonary circulation.
Although quantitative validation studies have been performed for all software, it is important to keep in mind that different methods and boundary detection algorithms often will result in some slight variability in quantitative results. Recent studies were done to cross-validate various gated blood-pool SPECT software packages. Included among these were Cedars BPGS and 4D-MSPECT, between which good agreement was reported for LV volumes and LV EF (32).
4D Blood-Pool Isointensity Surface (Isosurface) Display
With Cedars BPGS, when a count intensity level is chosen at a specified percentage of the peak intensity in a given blood pool, an isointensity surface is defined on the basis of the counts per voxel, which are related to the concentration of radiolabeled red blood cells. In Figure 18, a gated blood-pool isosurface level of 69% was chosen because it provided the best depiction of fluid pumping over a wide range of patients. In cine-loop playback, in addition to blood-pool tracking of endocardial wall motion, the isosurface demonstrated the expulsion of blood from both ventricles (isosurface pumping sign) as well as the diastolic uptake through the vena cava and the end-systolic pulse out through the pulmonary artery. The presence of a strong isosurface pumping sign with apical blood-pool exclusion at end systole appears to correlate with normal myocardial function (33).
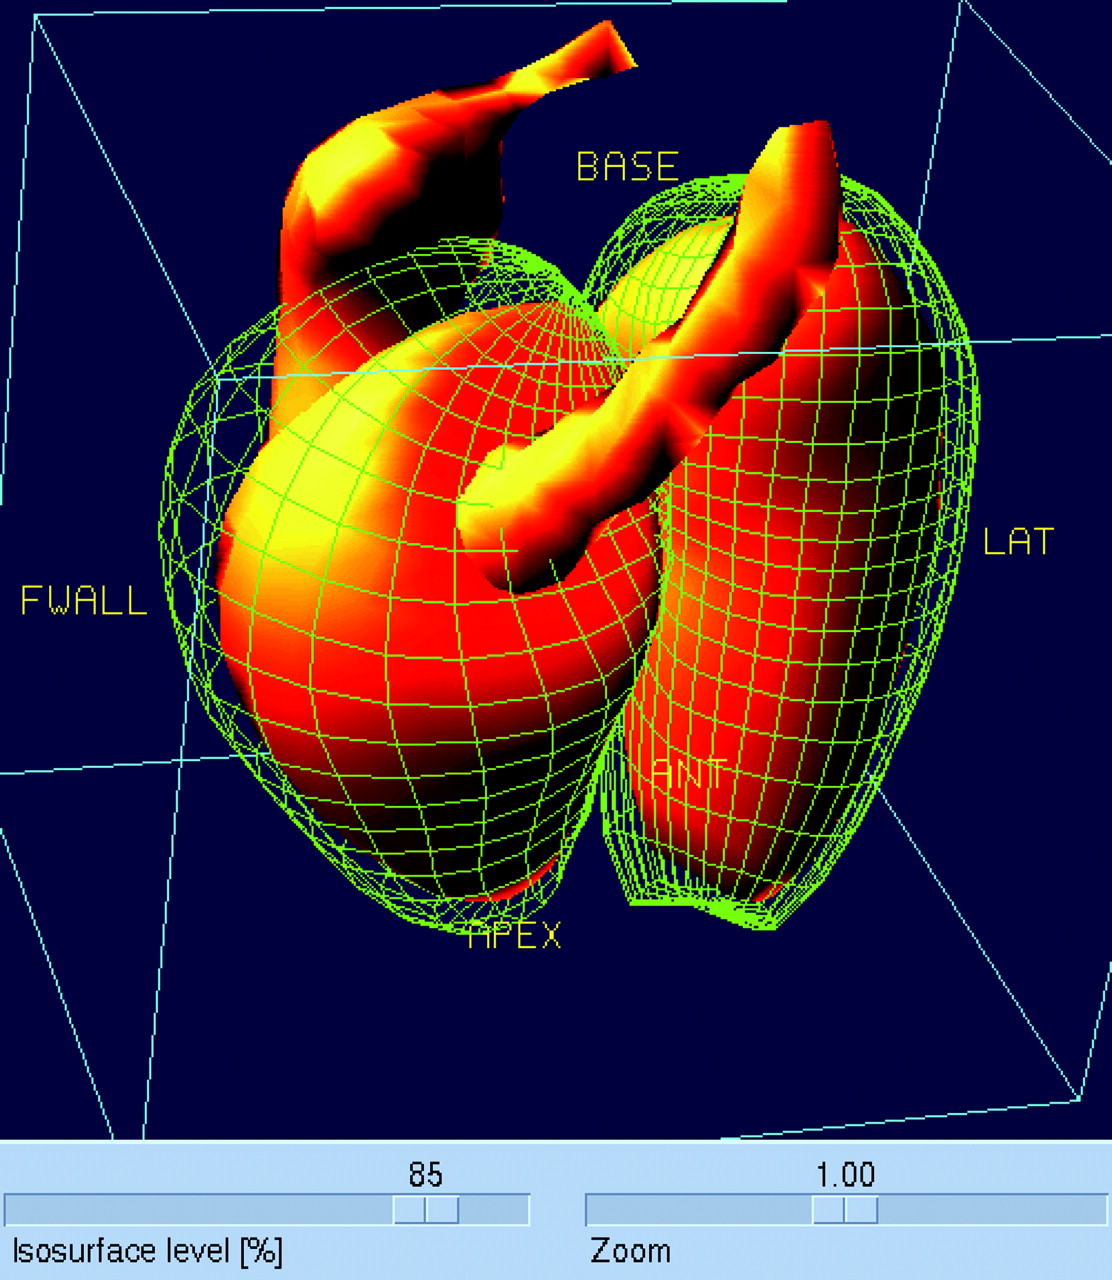
Gated 3D display of 69% isosurface in blood-pool SPECT results in 4D rendering of blood being pumped through both ventricles, right atrium, and pulmonary artery. LAT = lateral; FWALL = free wall. Cedars BPGS.
Wall Motion Polar Maps from Gated Blood-Pool Data
Gated blood-pool SPECT tracks endocardial wall motion. In Figure 19, Cedars-Sinai Medical Center polar maps indicate the spatial distribution of endocardial wall motion in the LV and in the RV free wall. The same color mapping of endocardial wall motion is applied to the 3D LV and RV surfaces (Fig. 19, center columns, middle row). In this healthy heart, the slightly reduced septal wall motion is likely attributable to the contracting LV and RV simultaneously pushing against the interventricular septum from opposite sides.
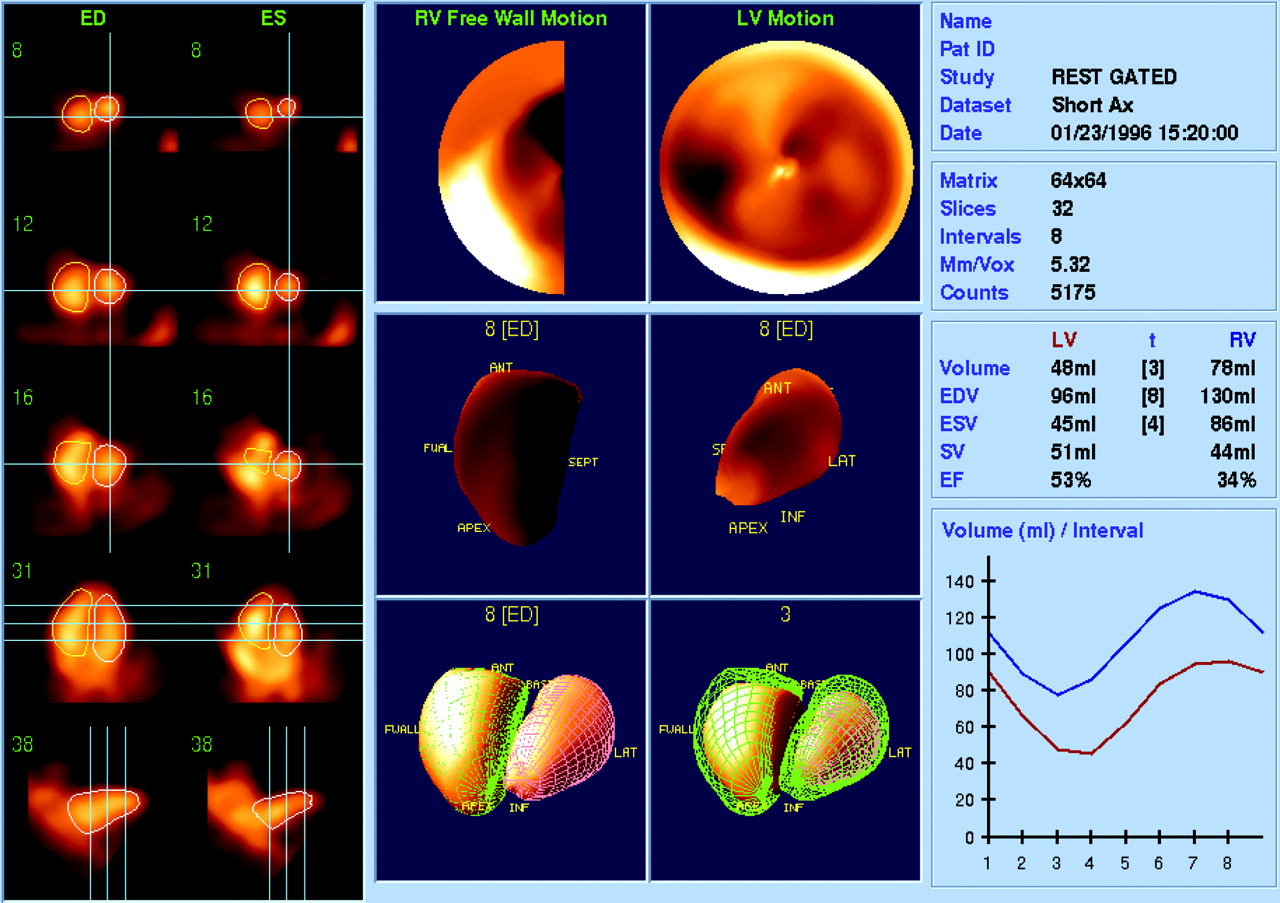
Gated blood-pool SPECT of healthy heart viewed as slices, wall motion polar maps, color-coded wall motion 3D surface renderings, and 4D dynamic surface renderings. SV and EF are automatically calculated from volume plot. ANT = anterior; INF= interior; LAT = lateral; SEPT = septal; FWAL = free wall. Cedars BPGS.
Dual-Study Correlation
Figure 20 shows a 4D-MSPECT layout that compares 2 different gated SPECT studies done on the same patient: perfusion and blood pool. Slices with automatically contoured myocardium and blood-pool volume demonstrate excellent correlation. Three-dimensional surfaces are color coded for perfusion and wall motion obtained by each method. Septal and inferior wall perfusion defects correlate with hypokinesis in the same regions.
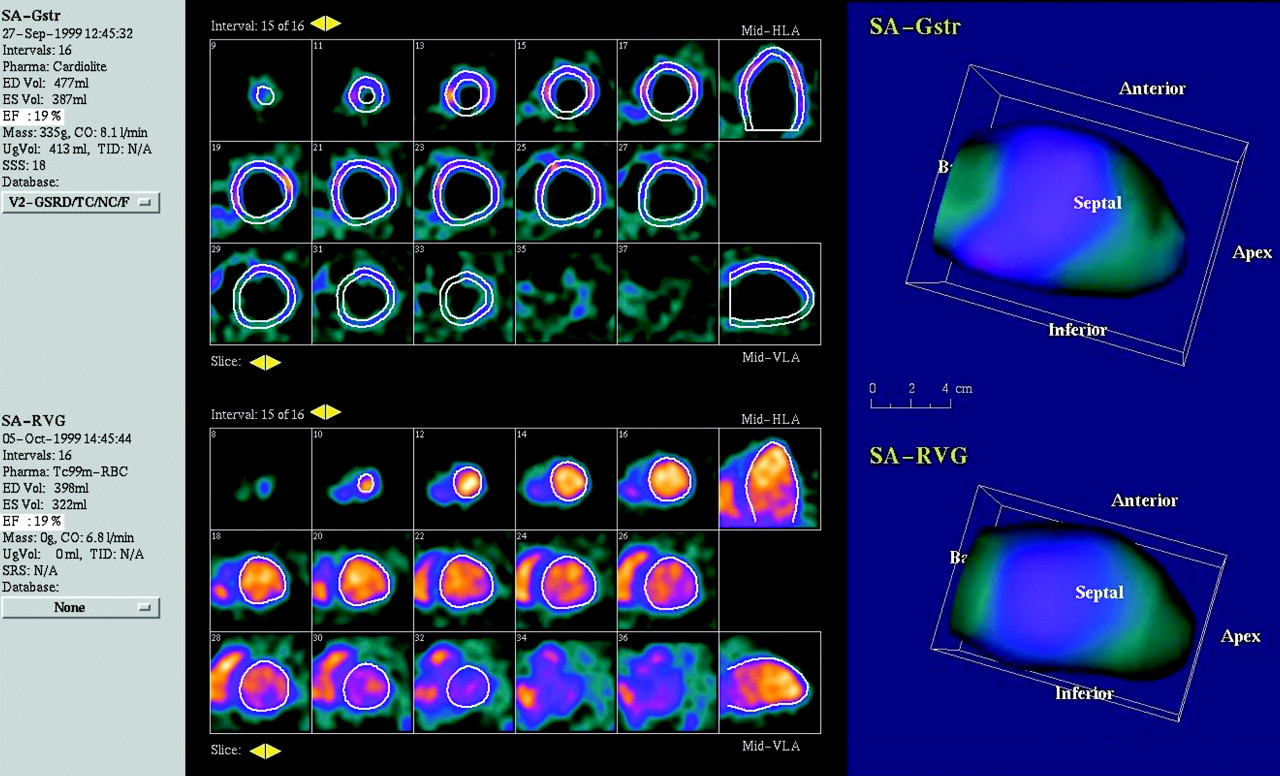
Dual study comparing gated perfusion SPECT with gated blood-pool SPECT. 3D rendering of endocardial wall motion is from gated blood-pool SPECT. Both studies corroborate defective perfusion and function in septal and inferior walls. 4D-MSPECT.
POTENTIAL ERRORS AND ARTIFACTS IN AUTOMATED PROCESSING
Automated software algorithms applied to radiologic images rely on a variety of feature extraction techniques. Whenever possible, software engineers try to implement “sanity checks” that query whether, for example, a particular contour makes sense with reference to known human anatomy. Nevertheless, algorithms are subject to error because they cannot be preprogrammed to anticipate all possible anomalous conditions.
For example, in an ungated myocardial perfusion study, automated contours can be mistakenly drawn in the setting of large infarcts with markedly decreased perfusion. Close proximity of intense bowel uptake may result in inclusion of bowel activity in the myocardial region, creating bright spots in polar maps as well as incorrect quantification and incorrect stress-rest image scaling. The endocardial and epicardial contours frequently can be adjusted manually to minimize these problems.
Errors in valve-plane placement, especially too high toward the base of the heart on a stress image, can lead to incorrect identification of ischemic regions at the base of the LV that do not actually exist. This situation further leads to incorrectly high ischemia scores and inappropriately high TID values. These can be corrected by manually repositioning the valve plane, being careful to match the positions on rest and stress images.
The operator always should be alert to myocardial boundaries that do not look correct and quantitative parameters that are extremely abnormal. Even if the values are not out of line, the operator should check for consistency. For example, is the EF consistent with the observed myocardial wall motion? If not, the operator should look for frames containing anomalous contours that may account for the inconsistency, such as an unexpected jump in the 4D surface display that is mistakenly interpreted by the software as a real myocardial contraction.
CONCLUSION
Reading and interpretation of cardiac SPECT scans today is aided by several clinically validated software packages. The software packages reviewed provide fully automated slice reorientation (with manual overrides), ventricular segmentation, epicardial and endocardial contouring, 4D surface rendering of wall motion, and polar map generation for standardized comparisons to normal databases. Quantification is automated for both global function (EF) and segmental perfusion, function, and scoring. By reducing manual operations, automated processing and quantification reduce interoperator variability, are intrinsically reproducible, and improve speed and ease of use (1,2,6,11,30,34).
Acknowledgments
Coauthors Horace H. Hines, Genine Grant, Kimberly Taylor, and Carl Ryals are employees of Philips Nuclear Medicine.
Footnotes
-
↵* NOTE: FOR CE CREDIT, YOU CAN ACCESS THIS ACTIVITY THROUGH THE SNM WEB SITE (http://www.snm.org/ce_online) THROUGH MARCH 2007.
References
- Received for publication April 10, 2005.
- Accepted for publication January 9, 2006.


