


Article Figures & Data
Figures
- FIGURE 1.
Automatic detection of LV valve plane in 2 segments of septal and lateral walls in perfusion SPECT. Emory Cardiac Toolbox.
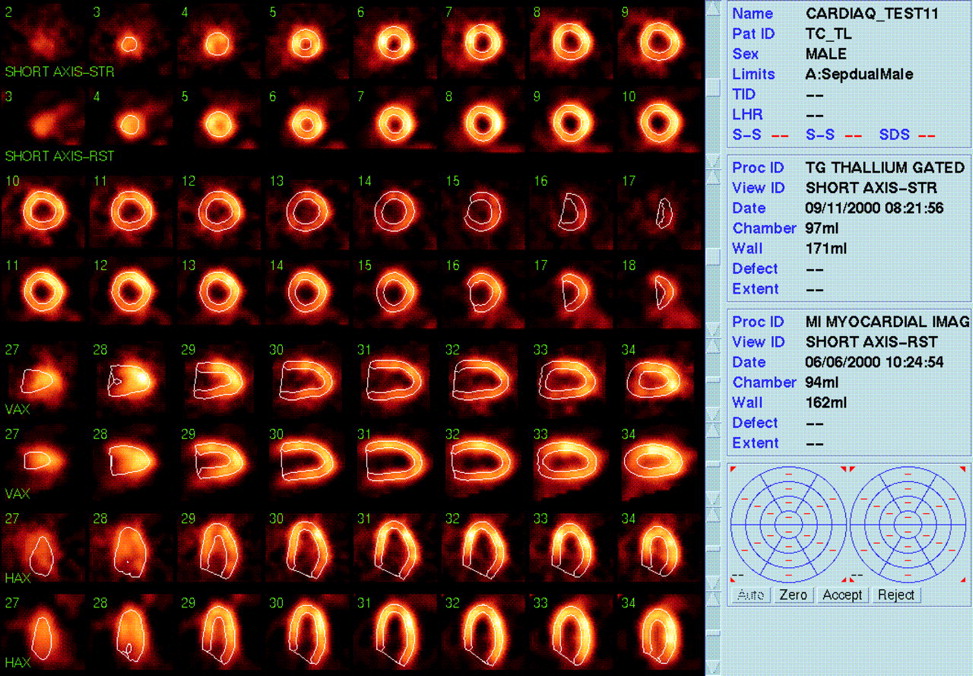
- FIGURE 2.
Multiplanar automatic contouring of LV myocardium in gated perfusion SPECT. Cine-loop display would show dynamic wall motion through complete cardiac cycle. AutoQUANT.
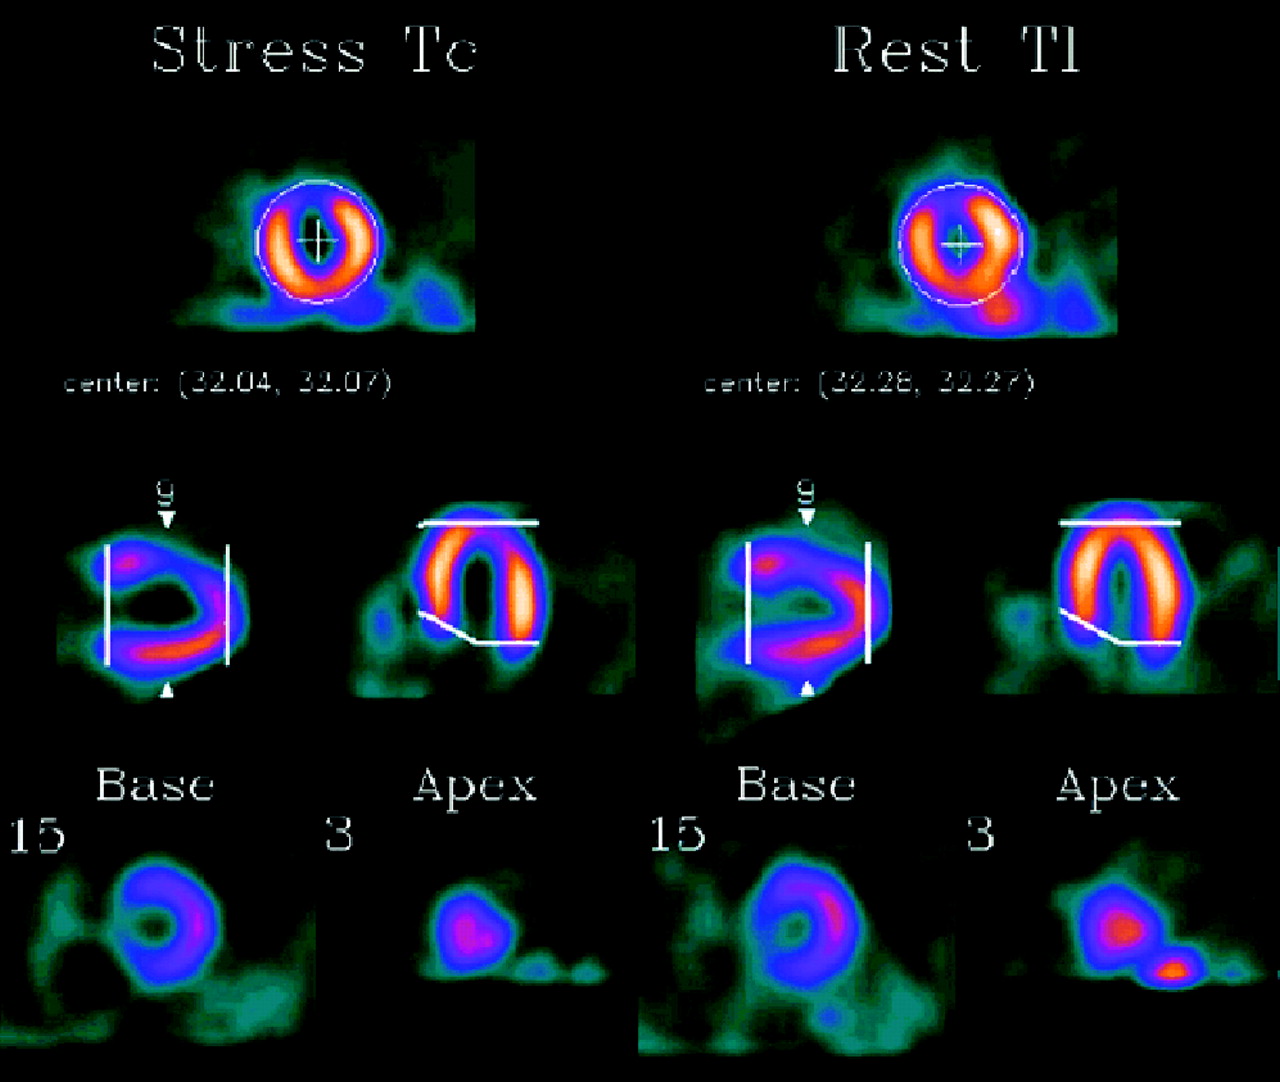
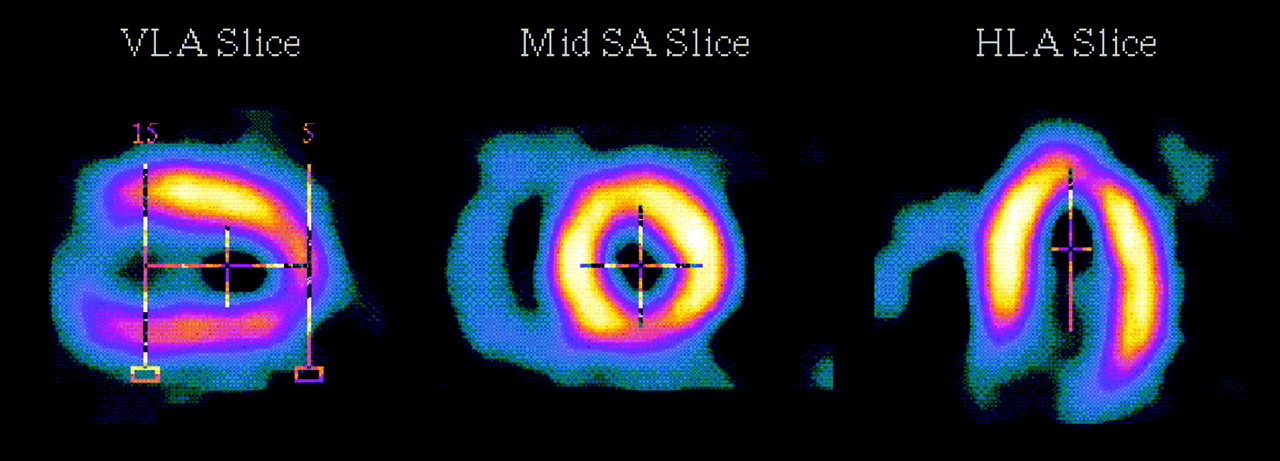
- FIGURE 3.
Automatic detection of basal and apical limits and default placement of central long axis of LV in perfusion SPECT. All cursors can be manually adjusted by user. 4D-MSPECT.
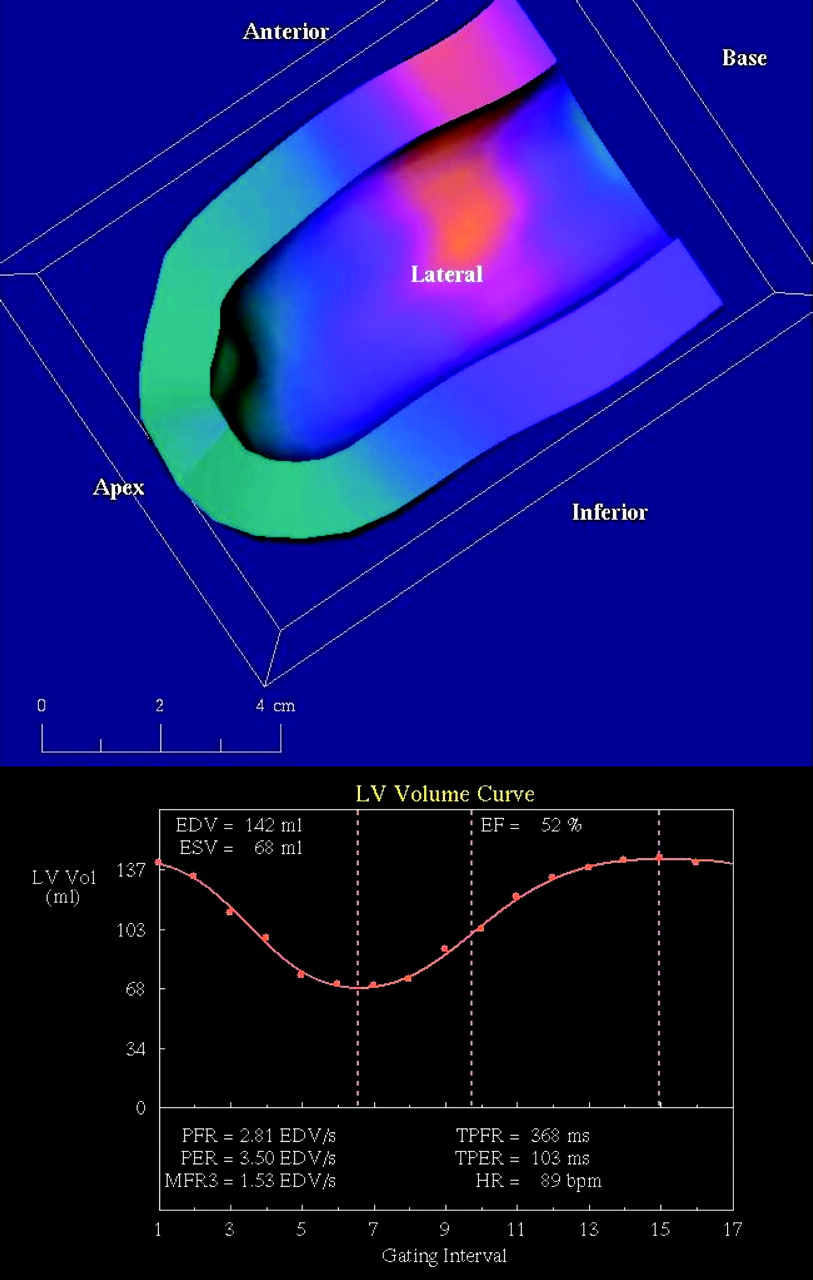
- FIGURE 4.
Gated stress 3D surface rendering of perfusion SPECT displayed as 4D cross section of epicardial and endocardial wall motion viewed from any arbitrary perspective. Blue apical region demonstrates large perfusion defect that extends up inferior wall. EF is automatically calculated from maximum and minimum points on LV volume curve. 4D-MSPECT.
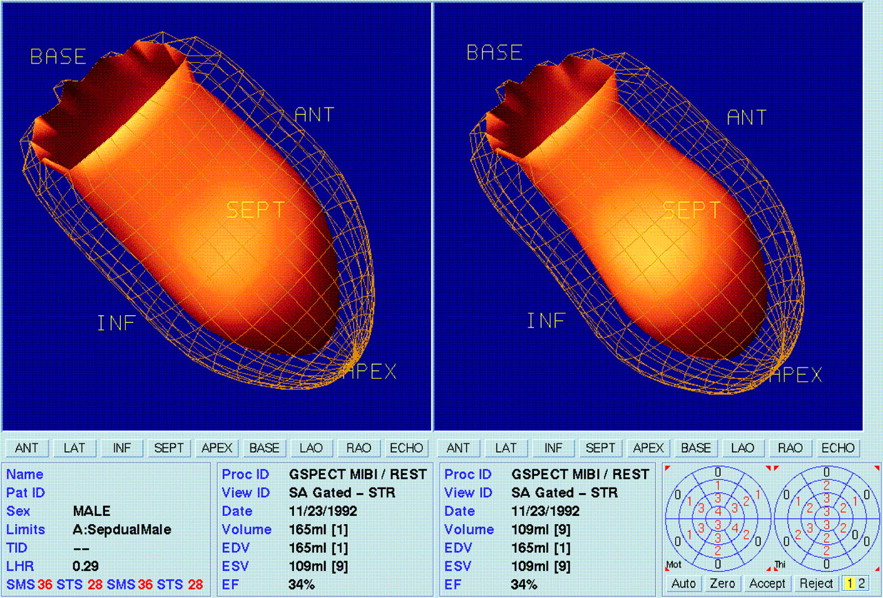
- FIGURE 5.
Gated 3D surface rendering of perfusion SPECT results in 4D display of epicardial and endocardial wall motion. (Left) End diastole. (Right) End systole. EF is automatically calculated. ANT = anterior; INF = inferior; SEPT = septal. AutoQUANT.
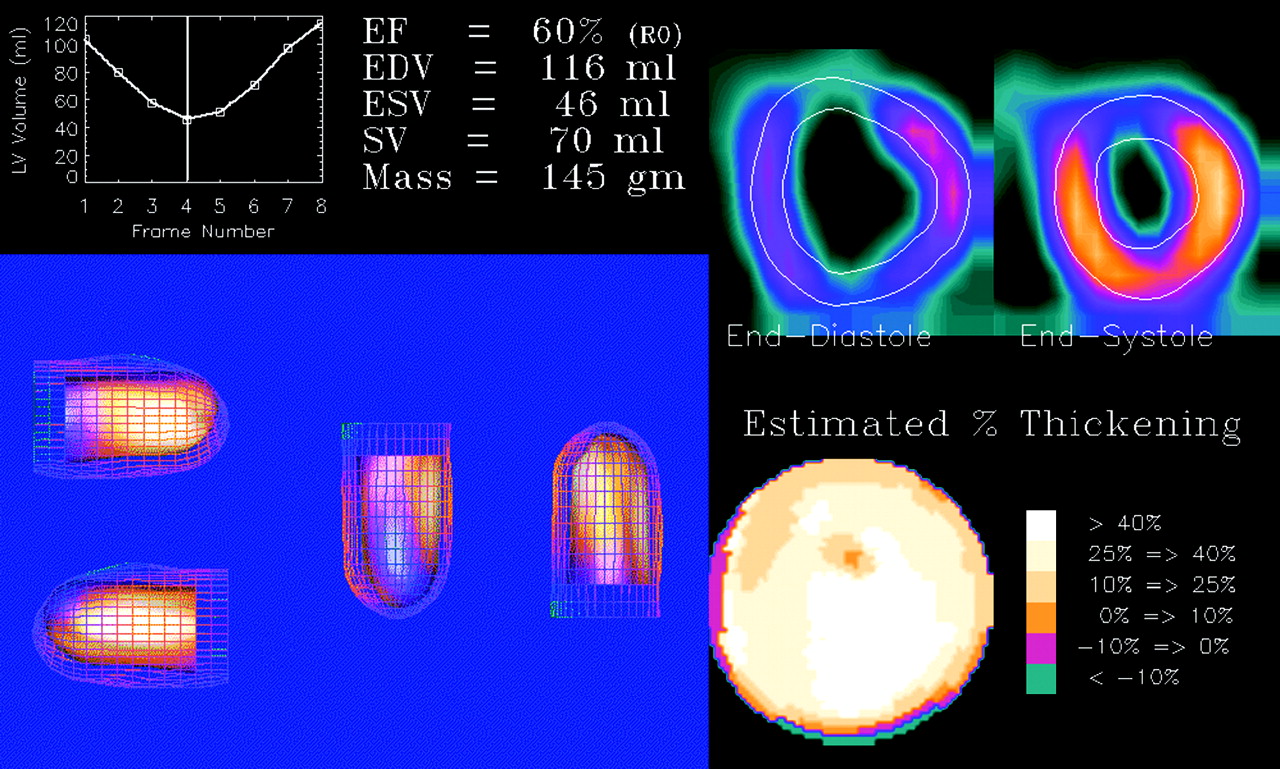
- FIGURE 6.
4D display of gated perfusion SPECT shows epicardial and endocardial wall motion with color mapping of anterior wall myocardial perfusion defect. This defect can be seen in center image in lower left panel, where anterior wall is facing reader. LV EF and myocardial mass are automatically calculated from endocardial and epicardial volume data. Additional reference displays are sample short-axis slices and wall thickening polar map. Emory Cardiac Toolbox.
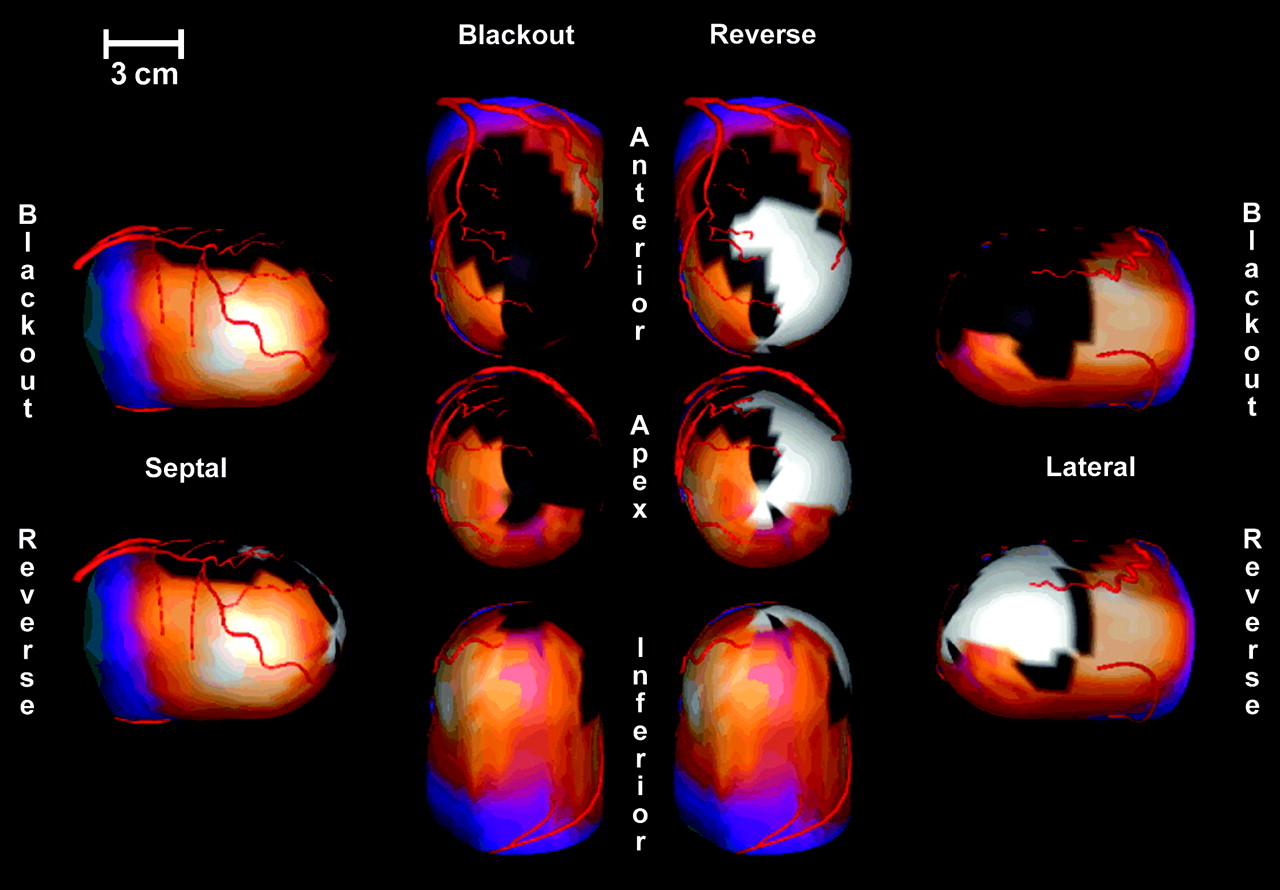
- FIGURE 7.
Generic coronary artery trees overlaid on 3D surface renderings of myocardial perfusion SPECT suggest correlation between regions of perfusion defect (blackout areas) and coronary arteries or branches (in this case, LAD) that may be severely stenotic or occluded. Emory Cardiac Toolbox.
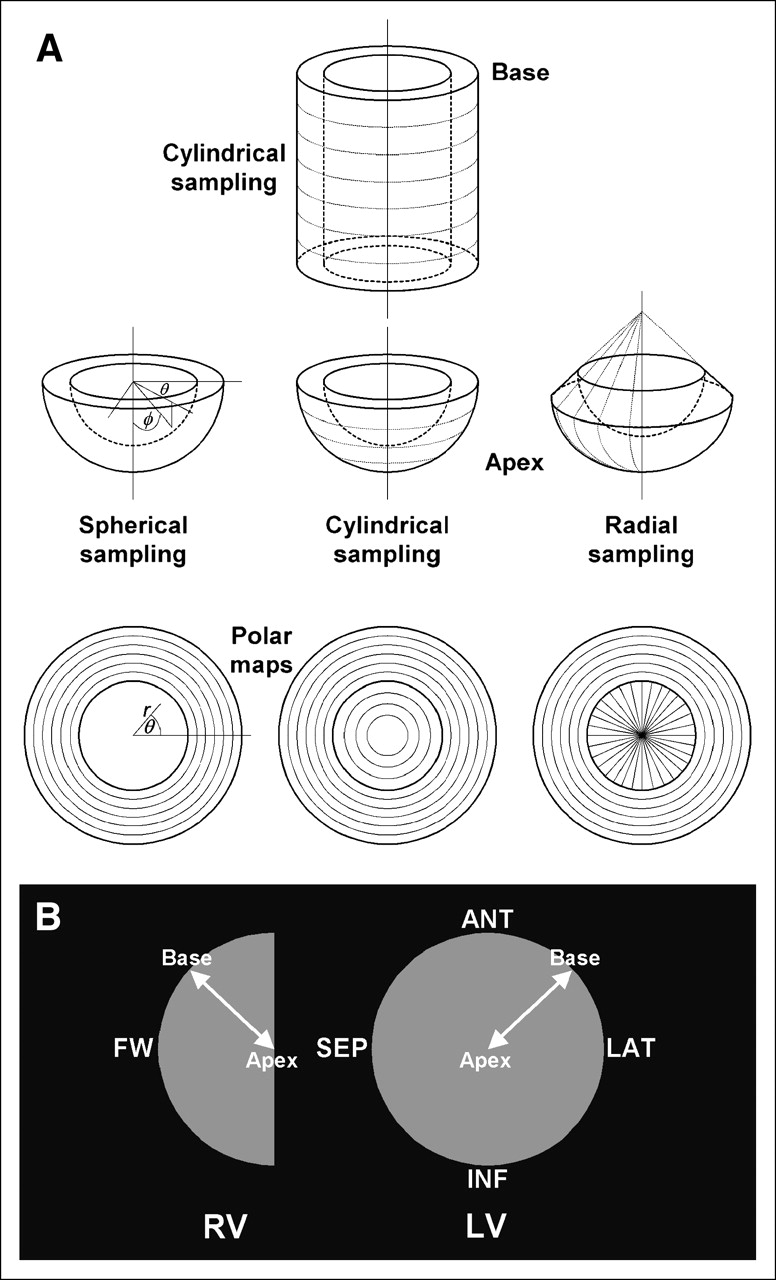
- FIGURE 8.
Polar mapping conventions. (A) Three methods for mapping 3D myocardium in 2D polar maps: Cedars-Sinai Medical Center–Emory University, University of Michigan, and Baylor College of Medicine. Basal and midventricular walls are mapped by cylindric sampling in all methods. Apex is mapped by spheric, cylindric, and radial sampling, respectively. (B) Orientations of polar maps for RV and LV. In LV polar map, anterior (ANT) wall is at top, septal (SEP) wall is at left, inferior (INF) wall is at bottom, lateral (LAT) wall is at right, apex is at center, and base is at circumference. In blood-pool SPECT, RV also is mapped to hemipolar map for RV free wall (FW).
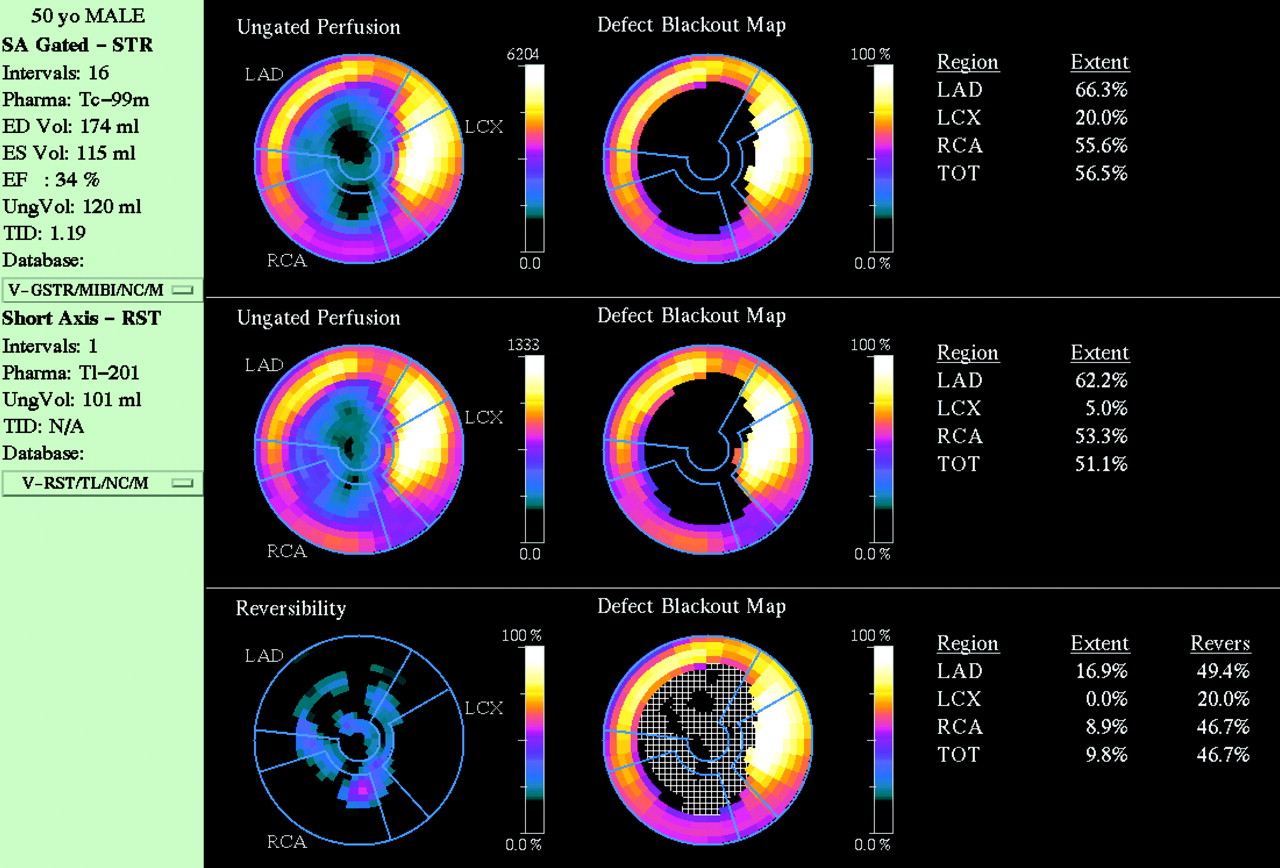
- FIGURE 9.
Polar maps of gated dual-isotope perfusion studies from Figures 5 and 6 show stress, rest, and reversibility (second column from left). Same data were compared with respective normal databases to display blackout defect polar maps (center column). Defect extents and reversibility are automatically calculated for each vascular region of myocardium indicated by graphic overlays (blue lines). LAD = left anterior descending coronary artery; LCX = left circumflex artery; RCA = right coronary artery; TOT = total. 4D-MSPECT.
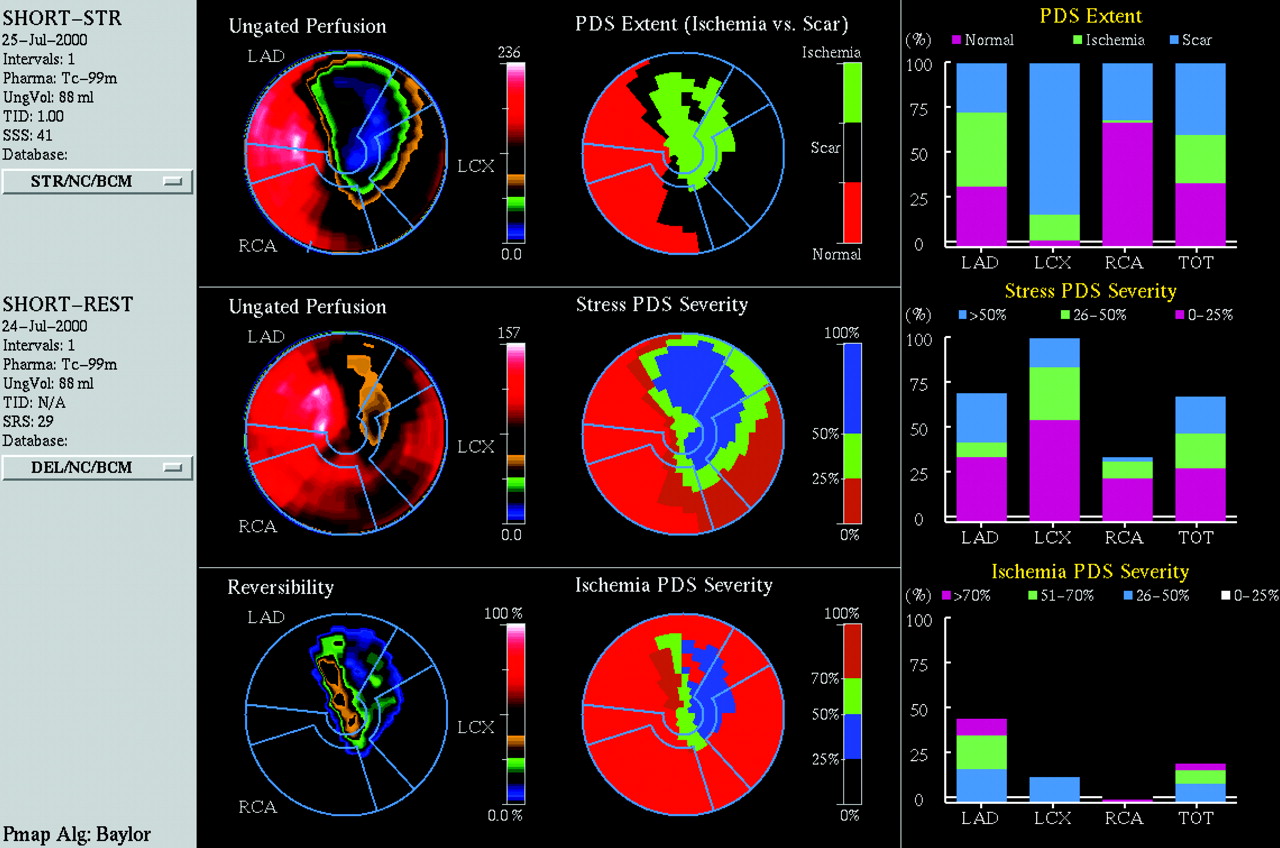
- FIGURE 10.
Polar maps of ungated perfusion studies show stress, rest, and reversibility (second column from left). Same data were compared with respective normal databases to display perfusion defect sizes (PDS): mapping of ischemia versus scar tissue, stress severity, and ischemia severity (center column). Areas of myocardium falling into each classification are automatically graphed for each vascular region of myocardium indicated by graphic overlays (blue lines). 4D-MSPECT with Baylor polar map package.
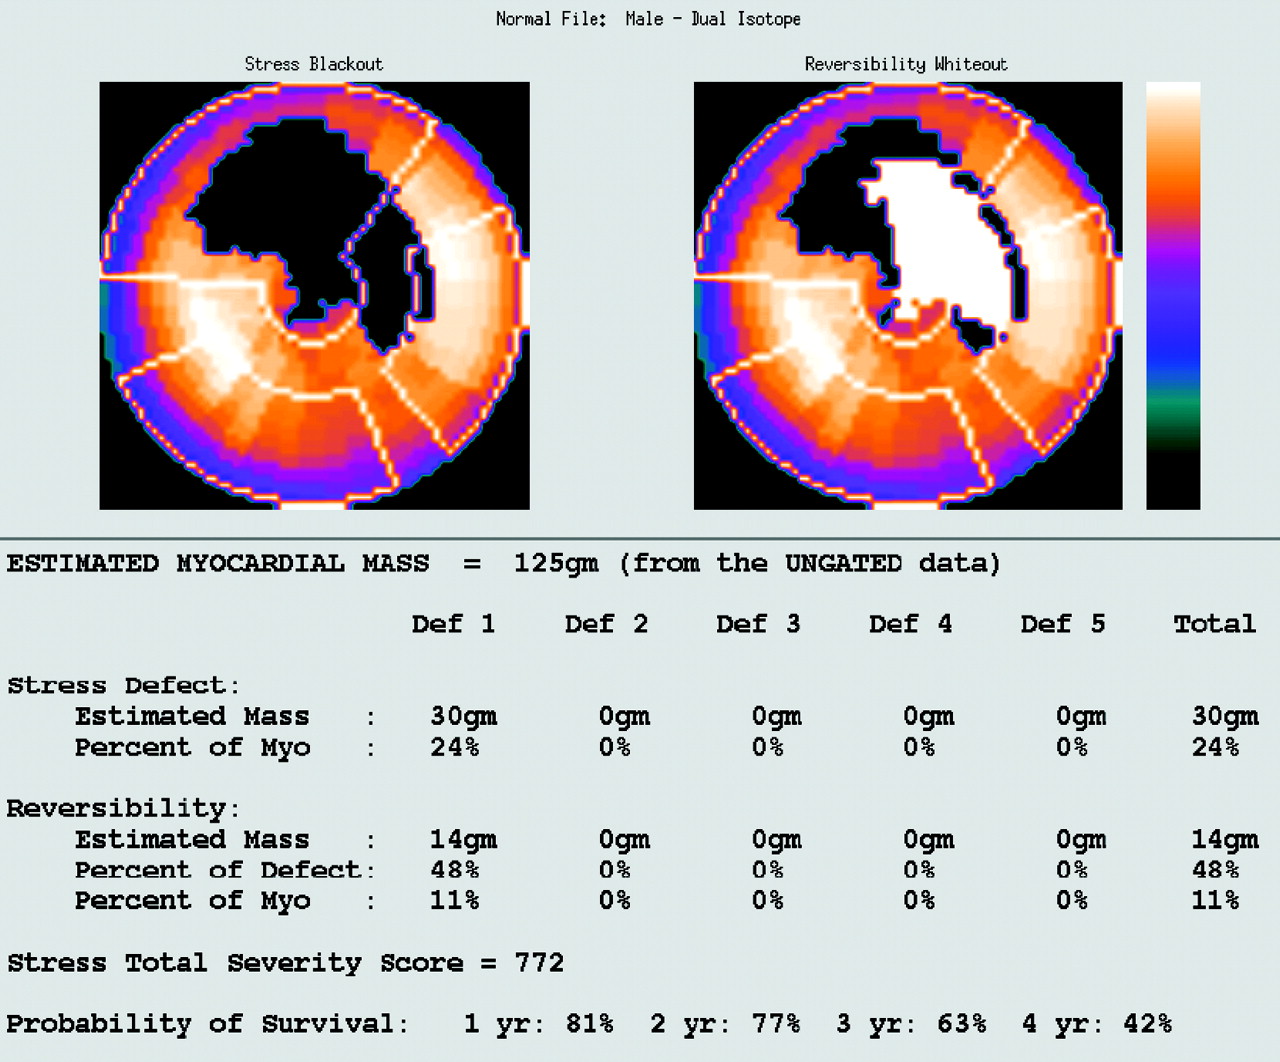
- FIGURE 11.
Myocardial perfusion stress polar maps show large perfusion defect in anterior and lateral walls, half of which significantly improves (reverses) in rest study. Masses of one or more stress defects (Def) and reversible portions of defects are automatically tabulated, along with stress total severity score and probability of survival. Emory Cardiac Toolbox.
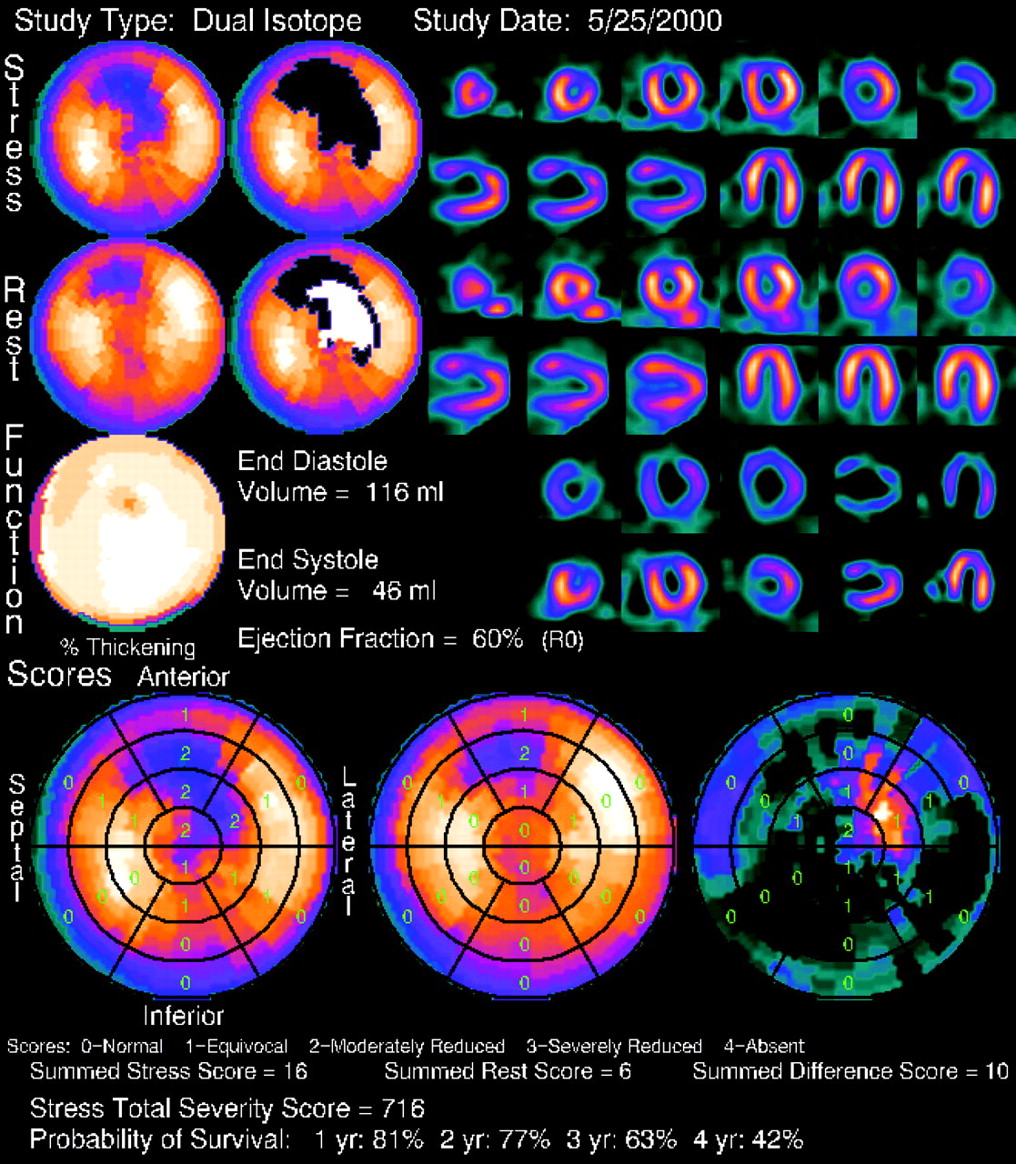
- FIGURE 12.
Summary of same dual-isotope perfusion SPECT study as in Figure 11 viewed in slices and polar maps under stress and rest. Polar maps show perfusion, defect extent, wall thickening, and segmental scoring of perfusion defect severity. EDV, ESV, EF, summed stress scores, and probability of survival are automatically calculated. Emory Cardiac Toolbox.
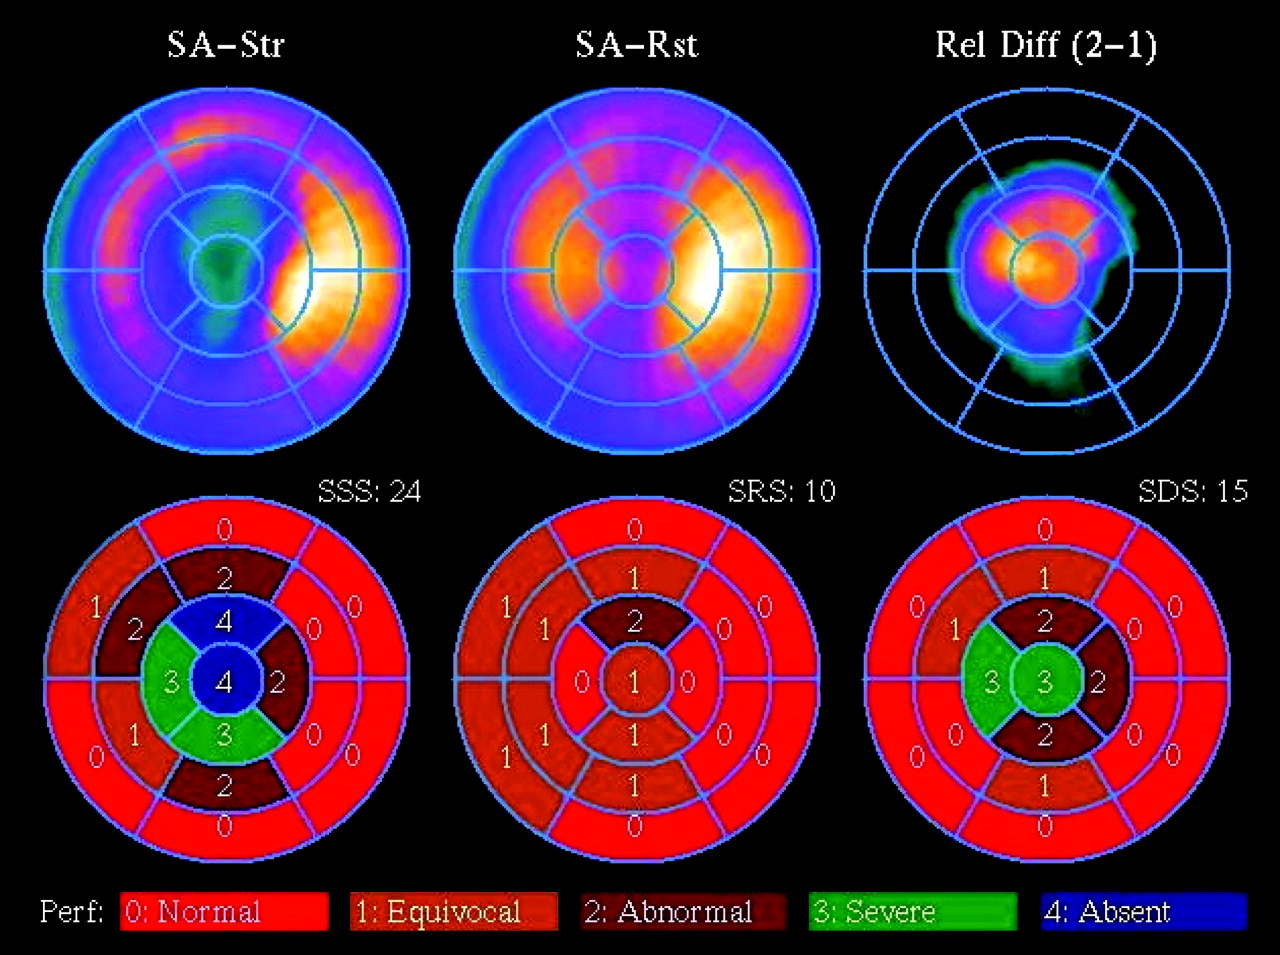
- FIGURE 13.
Fully automated perfusion (Perf) scoring on stress, rest, and reversibility polar maps indicates completely reversible apical perfusion defect. SA-Str = short-axis stress; SA-Rst = short-axis rest; Rel Diff = relative difference; SSS = short-axis stress scores; SRS = short-axis rest scores; SDS = short-axis difference scores. 4D-MSPECT.
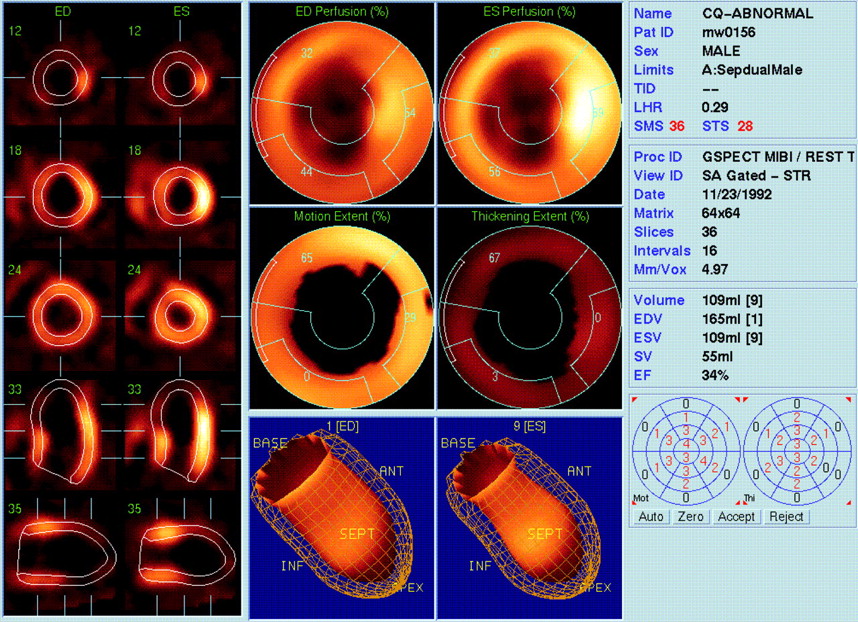
- FIGURE 14.
Dual-isotope gated perfusion SPECT shows large periapical perfusion defect viewed as slices; perfusion, wall motion, wall thickening, and segmental scoring polar maps; and 4D surface renderings with automatic calculation of SV and EF. ED = end diastole; ES = end systole; ANT = anterior; INF = inferior; SEPT = septal. AutoQUANT QGS.
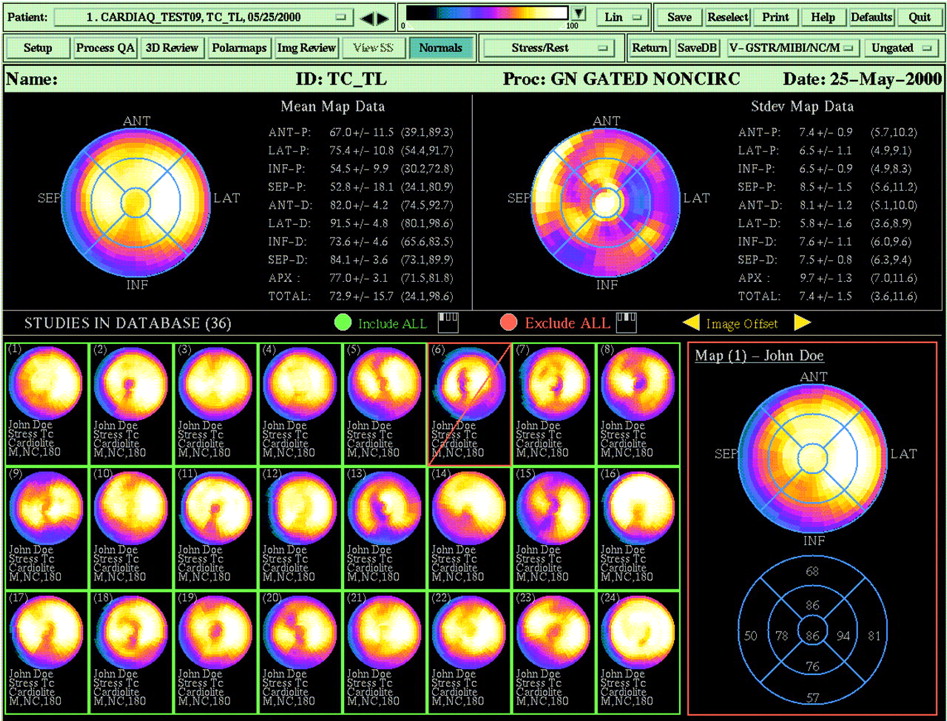
- FIGURE 15.
Normal database editor displays thumbnail images of entries in database. Mean and SD map data are shown for selected patient study and can be included or excluded from active database. 4D-MSPECT.
- FIGURE 16.
Biventricular segmentation in gated blood-pool SPECT. (A) Program begins by drawing ellipsoid region of interest to encompass LV blood pool in 3 short-axis planes, 1 horizontal long-axis plane, and 2 vertical long-axis planes. If necessary, user may manually adjust any ellipse. (B) Automatic segmentation algorithm finishes task by automatically contouring RV and LV endocardia. Cedars BPGS.
- FIGURE 17.
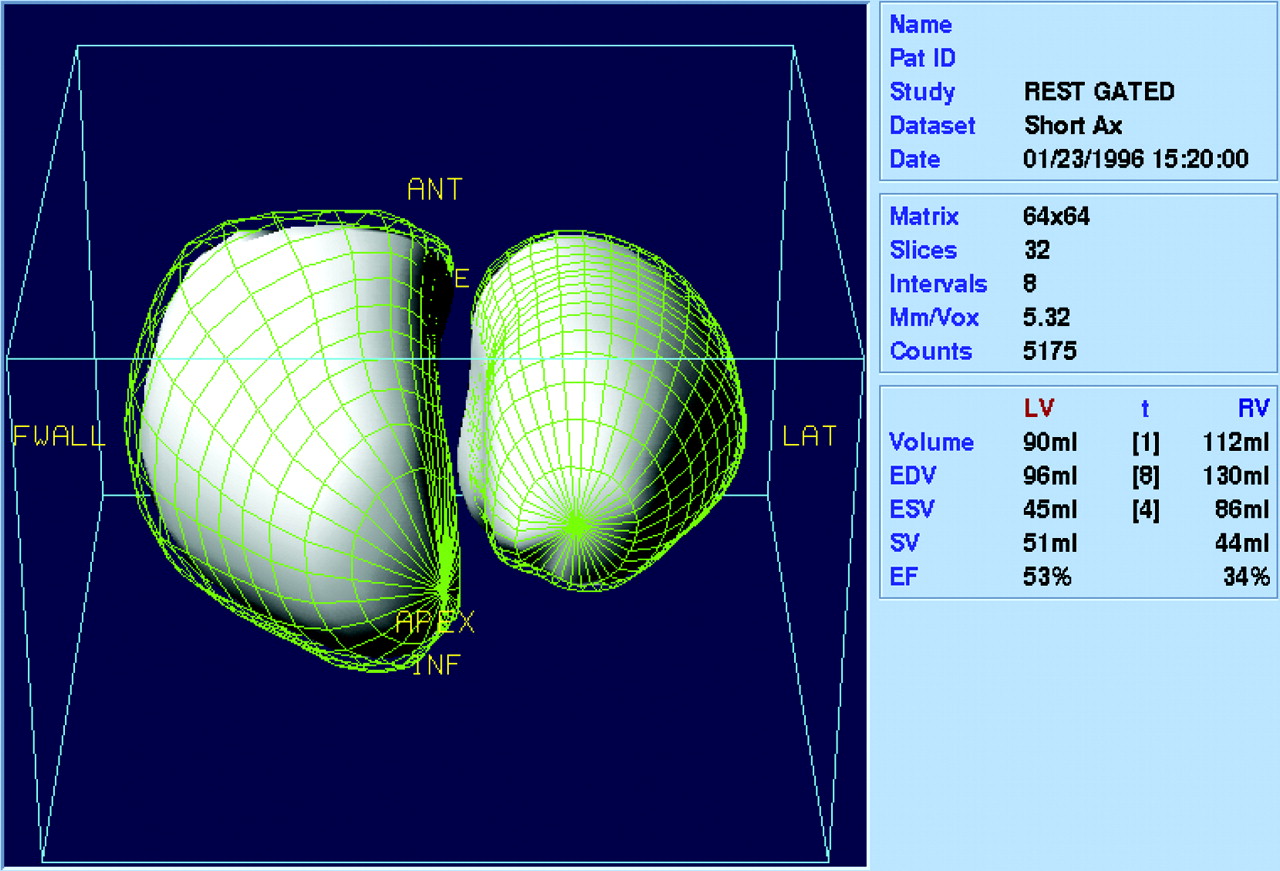
Gated 3D surface rendering of blood-pool SPECT results in 4D display of endocardial wall motion in both ventricles. SV and EF are automatically calculated for LV and RV in this healthy heart. ANT = anterior; INF= interior; LAT = lateral; FWALL = free wall. Cedars BPGS.
- FIGURE 18.
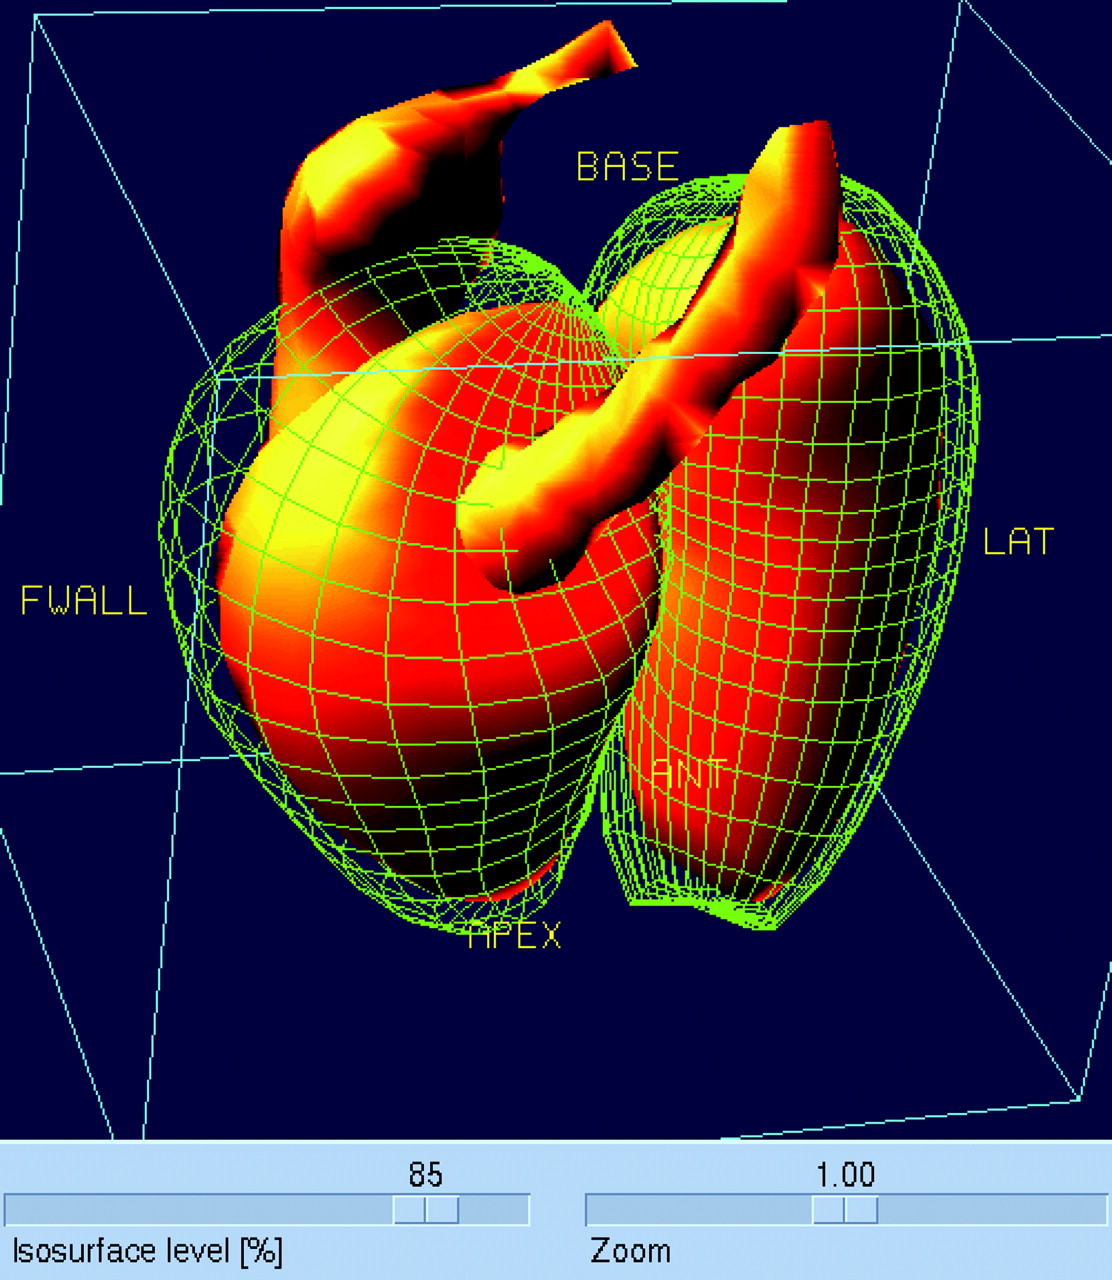
Gated 3D display of 69% isosurface in blood-pool SPECT results in 4D rendering of blood being pumped through both ventricles, right atrium, and pulmonary artery. LAT = lateral; FWALL = free wall. Cedars BPGS.
- FIGURE 19.
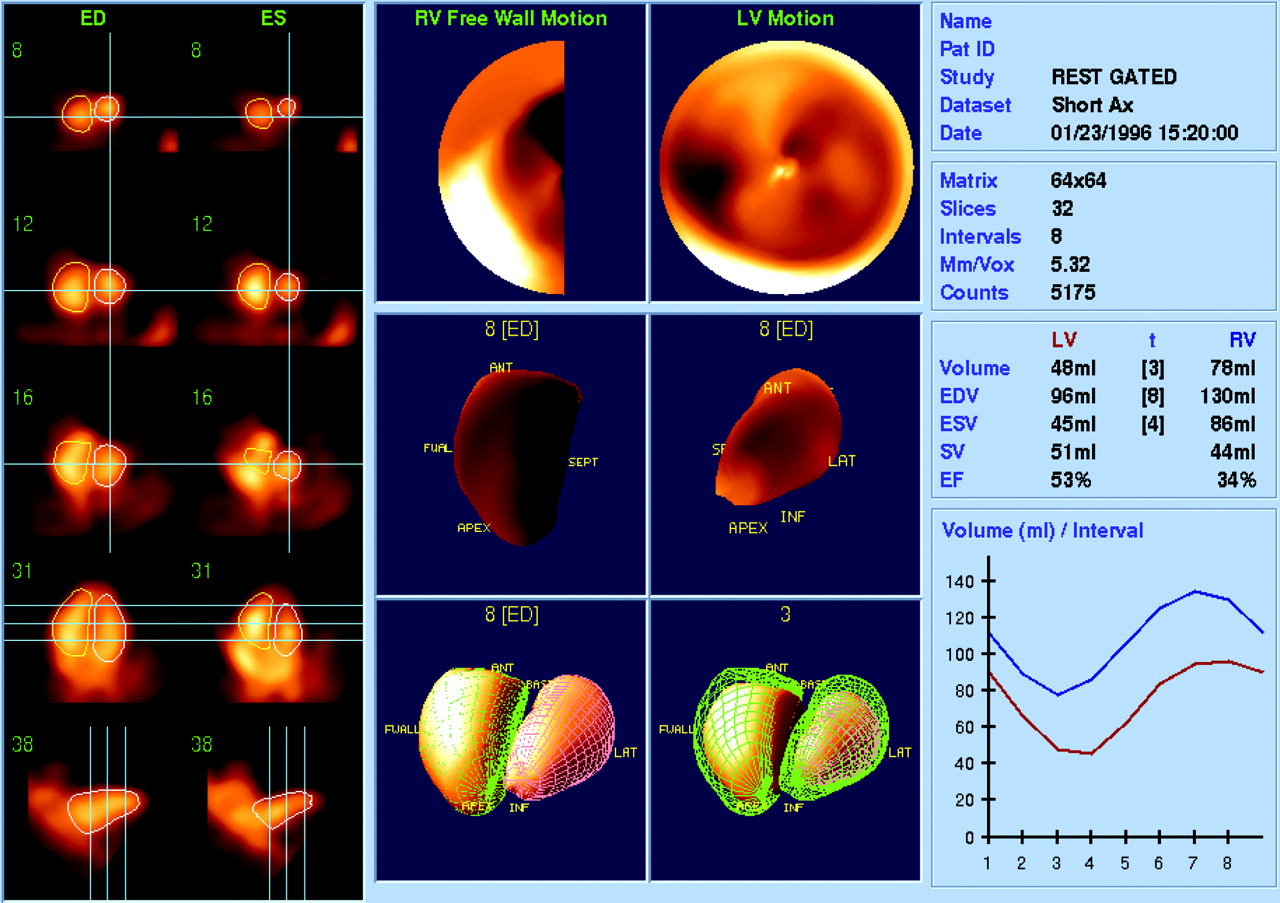
Gated blood-pool SPECT of healthy heart viewed as slices, wall motion polar maps, color-coded wall motion 3D surface renderings, and 4D dynamic surface renderings. SV and EF are automatically calculated from volume plot. ANT = anterior; INF= interior; LAT = lateral; SEPT = septal; FWAL = free wall. Cedars BPGS.
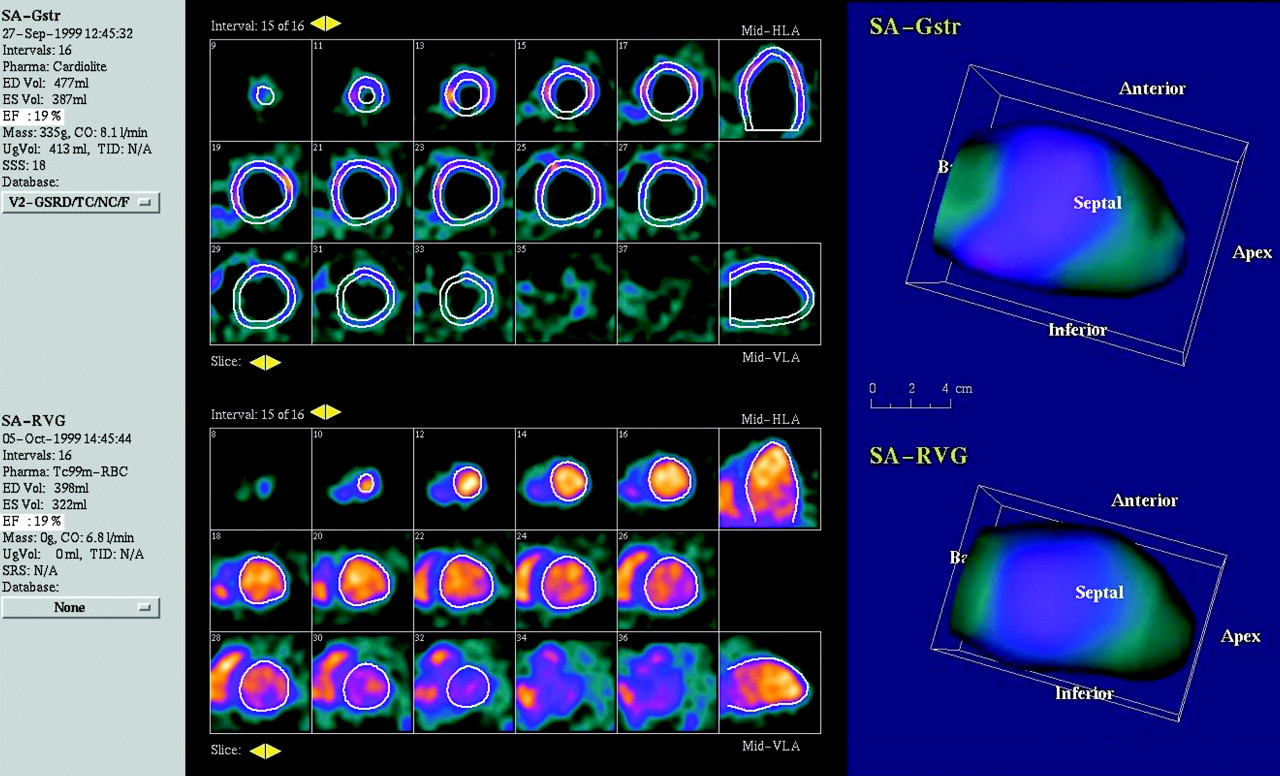
- FIGURE 20.
Dual study comparing gated perfusion SPECT with gated blood-pool SPECT. 3D rendering of endocardial wall motion is from gated blood-pool SPECT. Both studies corroborate defective perfusion and function in septal and inferior walls. 4D-MSPECT.


Tables
Feature AutoQUANT + Cedars BPGS 4D-MSPECT Emory Cardiac Toolbox Baylor polar map package Slices (SAX, VLA, HLA) ✓ ✓ ✓ ✓ Gated slices ✓ ✓ ✓ 3D surfaces, perfusion ✓ ✓ ✓ 3D surfaces, wall motion ✓ ✓ ✓ LV volume curve ✓ ✓ ✓ LV SV, LV EF ✓ ✓ ✓ TID ✓ ✓ ✓ ✓ Polar maps, perfusion ✓ ✓ ✓ ✓ Polar maps, perfusion blackout ✓ ✓ ✓ ✓ Polar maps, reversibility ✓ ✓ ✓ ✓ Polar maps, PDS severity ✓ Polar maps, wall motion ✓ ✓ Polar maps, wall thickening ✓ ✓ ✓ Polar maps, zone quantification ✓ ✓ ✓ ✓ Polar maps, zone graphs ✓ ✓ ✓ Polar maps, zone scoring ✓ ✓ ✓ Polar maps, summed scores ✓ ✓ ✓ Coronary artery trees ✓ Gated blood-pool SPECT ✓ ✓ GBPS, RV ✓ GBPS, isosurfaces ✓ GBPS, polar maps ✓ Results summary ✓ ✓ ✓ Normal database ✓ ✓ ✓ ✓ Normal database editor ✓ ✓ Normal database, diff. stress ✓ ✓ SAX = short axis; VLA = vertical long axis; HLA = horizontal long axis; PDS = perfusion defect size; GBPS = gated blood-pool SPECT; diff. = differential.


