


Visual Abstract

Abstract
The use of prostate-specific membrane antigen (PSMA)–based PET/CT has grown rapidly in recent years. This study estimated lesional uptake, normal physiologic concentrations, and temporal variation on delayed PET/CT of 68Ga-PSMA-11 across different molecular imaging PSMA (miPSMA) expression scores in patients with metastatic castration-resistant prostatic carcinoma. Methods: We retrospectively studied 50 patients who were evaluated for 177Lu-PSMA–targeted radioligand therapy and underwent 68Ga-PSMA-11 PET/CT to determine disease status. Their mean age was 67.5 ± 8 y (52–84 y), and their average serum prostate-specific antigen level was 401 ± 1,353 ng/mL (0.098–9,235.13 ng/mL) at the time of scanning. They underwent standard 68Ga-PSMA-11 PET/CT an average of 65 min after injection (60–90 min). Tumors (n = 50) were correlated with miPSMA expression score and uptake. Physiologic tracer distribution was estimated by placing a volume of interest 1 cm in diameter for smaller organs (submandibular, parotid, lacrimal, and tubarial glands; renal cortices; blood pool; and bowel) and 3 cm for larger organs (liver and spleen). SUVmax and SUVmean were estimated for each region. Tumor-to-spleen (T/S), tumor-to-liver (T/L), and tumor-to-parotid (T/P) ratios were calculated for each lesion. For 16 patients who underwent a delayed scan an average of 135 min after injection (120–150 min), additional analysis evaluated the effect of the delay. Results: Uptake was maximal in renal cortices, followed by salivary glands, bowel, spleen, liver, lacrimal glands, and blood pool. SUVmax averaged 37.7 ± 22.1 for renal cortices, 15.4 ± 7.3 for submandibular glands, 14.4 ± 7.1 for parotid glands, 9.4 ± 4.9 for spleen, 6.2 ± 3.7 for lacrimal glands, 5.9 ± 2.3 for liver, 5.3 ± 1.41 for tubarial glands, 13.8 ± 7.6 for bowel, and 2.4 ± 1.9 for blood pool. SUVmax averaged 10.33 ± 3.27 (6.46–17) for miPSMA expression score 2 and 38.21 ± 25.9 (7.68–119.08) for score 3. T/S and T/P ratios averaged 1.21 ± 0.44 (0.48–2.04) and 0.6 ± 0.18 (0.39–0.87), respectively, for score 2 and 5.05 ± 4.46 (1.25–20.89) and 3.15 ± 2.09 (1.06–9.45), respectively, for score 3. SUVmax for score 3 lesions averaged 18.85, which increased significantly to 26.24 on delayed imaging (P = 0.0001). However, T/L, T/S, and T/P ratios did not significantly change. Temporal variation in normal organs showed SUVmax to increase significantly on delayed scans for salivary (submandibular and parotid) and lacrimal glands and renal cortices, whereas SUVmean increased significantly for spleen; liver; and parotid, tubarial, and lacrimal glands and insignificantly for other organs. Conclusion: These data form a basis for a proposed consensus on standard reference ranges for quantitative 68Ga-PSMA-11 PET/CT. The temporal variations should be kept in mind for delayed acquisitions; T/S, T/L, and T/P ratios might serve as better markers for such scenarios.
- 68Ga-PSMA-11 PET/CT
- miPSMA score
- 177Lu-PSMA-617
- metastatic castration-resistant prostate carcinoma
- peptide receptor radioligand therapy
- PSA
Prostate-specific membrane antigen (PSMA)–labeled radioligands for PET/CT imaging in patients with prostate carcinoma have brought about a major change in the management of the disease. Furthermore, the recent introduction of PSMA-targeted radionuclide therapy for castration-resistant prostatic carcinoma patients has opened new areas of application for the theranostic pair for diagnosis and treatment, upholding the great promise of precision oncology. The role of PET/CT targeting of PSMA expression is well documented for staging and for detecting recurrence even in those with low serum prostate-specific antigen levels (1). Because of the high sensitivity and specificity of PSMA PET/CT, its use is currently expanding at various stages during the course of the disease.
The recently published PROMISE study has set guidelines for standard miTNM staging on PET/CT (2). Qualitative image assessment systems such as the molecular imaging PSMA (miPSMA) expression score are proposed as robust tools for defining objectivity in interpretation and staging (2,3), though they have yet to be validated for routine clinical use and their reproducibility in larger samples are yet to be tested. The miPSMA expression score takes into account the visual intensity of lesions relative to normal tracer uptake in internal reference organs such as the liver or parotid glands. Confirmation of normal biodistribution with the known range objectively can serve as an in vivo method of quality control as well as validate the observations made in the proposed scoring system, and there is a relative paucity of data on this topic, especially the temporal variation in such uptake (4–6). In this study, we attempted first to reproduce the reference ranges of 68Ga-PSMA-11 in a subset of prostate carcinoma patients and subsequently to observe the correlation of miPSMA expression scores with various objective parameters such as SUVmax, tumor-to-spleen (T/S) ratio, tumor-to-liver (T/L) ratio, and tumor-to-parotid (T/P) ratio to supplement subjective observations and correlate semiquantitative values with miPSMA scores.
MATERIALS AND METHODS
In total, 50 patients with metastatic castration-resistant prostatic carcinoma who were being investigated for the feasibility of 177Lu-PSMA–targeted radioligand therapy and underwent 68Ga-PSMA-11 PET/CT either for staging or restaging in the past 2 y were retrospectively analyzed. The institutional medical ethics committee approved this retrospective study, and the requirement to obtain informed consent was waived. From the patient’s medical records, we noted various general and clinical data such as patient age, Gleason score, history of surgery, history of prior therapy (hormonal therapy, chemotherapy, radiotherapy, or 177Lu-PSMA–targeted radioligand therapy), and recent prostate-specific antigen levels. The mean age of the patients was 67.5 ± 8 y (range, 52–84 y), and the mean serum prostate-specific antigen level was 401 ± 1,353 ng/mL (range, 0.098–9,235.13 ng/mL) at the time of PET/CT scanning. The Gleason score was categorized as per the International Society of Urological Pathology Consensus grading, into 5 groups (7). The overall patient characteristics are described in Table 1.
Patient Characteristics and Previous Therapies
PET/CT Acquisition Protocol
After appropriate preparation and quality control testing of the radiotracer, 68Ga-PSMA-11, the patients were administered an average dose of 103.23 ± 22.2 MBq (range, 74–166.5 MBq) and 2 mL of furosemide (10 mg/mL) intravenously. After the injection, the patients were asked to drink an oral contrast medium (10 mL of sodium amidotrizoate and meglumine amidotrizoate [Urografin; Bayer]) diluted in 1 L of water within 1 h for optimal contrast in the abdominal pelvic region. The patients were asked to void before imaging to reduce urinary bladder activity, and whole-body scans were acquired at 65 min, on average (range, 60–80 min), after injection of the radiotracer. A subgroup of 16 patients underwent delayed scanning 135 min after injection, on average (120–150 min), after consenting to the procedure.
The PET/CT scans were acquired using a Philips Gemini TF 16 PET/CT scanner. A CT surview (90 kV, 20 mA) followed by a CT scan (100 mA; 120 kV; field of view, ∼600 mm; CT slice thickness, 2.0 mm; standard resolution; collimation, 16 × 1.5; pitch, 0.813; matrix, 512 × 512) was performed for PET attenuation correction. After CT, whole-body PET was performed in 3-dimensional mode at 8–10 bed positions, with a 2-min emission per bed position, from the mid thighs to the base of the skull in the arms-up position. Images were reconstructed using a standard iterative algorithm based on the 3-dimensional row-action maximum-likelihood algorithm. The 68Ga-PSMA PET/CT data were evaluated in a dedicated Philips EBW workstation.
Volume-of-Interest Measurements
The physiologic tracer biodistribution was assessed in each patient by placing spherical volumes of interest. These had a diameter of 1 cm for smaller organs (renal cortex, submandibular glands, parotid glands, lacrimal glands, the newly described tubarial glands (8), blood pool [abdominal and thoracic aorta], and bowel) and 3 cm for larger organs (liver and spleen). SUVmax and SUVmean for each organ were estimated (average of 2 measurements for smaller organs and 3 for larger). The schematics of measurement are illustrated in Figure 1.

Schema for drawing volumes of interest adopted in this study.
For the first part of the study, in which the miPSMA score was correlated with SUV, only the most intense lesion per patient was selected. In the second part, in which temporal analysis was performed on a smaller cohort, additional lesions per patient were considered to observe the trend in the delayed imaging. These lesions were considered in the following order: primary, nodes, bone (1 or 2), and then other soft-tissue metastases. All these lesions were closer in intensity to the index lesions measured in the first part.
In the subgroup of patients with additional delayed scans, we noted the same quantitative parameters in all regions in a similar manner. The lesions with maximum intensity in each scan was marked as the index lesion (n = 50). We used a fixed 1-cm volume of interest for measuring the SUVmax of such lesions. We measured additional lesions for the subgroup temporal analysis, amounting to total of 40 lesions. The miPSMA score was used for classifying the lesions as per the PROMISE trial (2).
We noted the SUVmax of all individual lesions against their grades. Apart from the directly measured SUVmax of these lesions, we also estimated T/P, T/S, and T/L ratios. For the subgroup of patients who underwent additional delayed imaging, the temporal variation in these parameters was analyzed.
Statistical Analysis
Continuous data were represented as mean with SD. All data were verified for normal distribution. Groups with equal variance were tested for any significant difference between them using a paired t test. The unpaired t test was used for groups with unequal variance. A P value of less than 0.05 was considered significant.
RESULTS
Physiologic Uptake
The SUVmax and SUVmean of the organs with physiologic uptake are represented as average values with their SD, shown in Table 2. The renal cortices showed the highest SUVmax and SUVmean, followed by salivary glands, bowel, spleen, lacrimal glands, liver, and blood pool. The mean SUVmax was 37.72 ± 22.1 for the renal cortices, 15.44 ± 7.34 for the submandibular glands, 14.36 ± 7.05 for the parotid glands, 13.81 ± 7.6 for the bowel, 9.33 ± 4.98 for the spleen, 6.16 ± 3.68 for the lacrimal glands, 5.89 ± 2.32 for the liver, 5.3 ± 1.41 for the tubarial glands, and 2.36 ± 1.95 for the blood pool. A chart of the average SUVmean and SUVmax for these regions is shown in Figure 2.
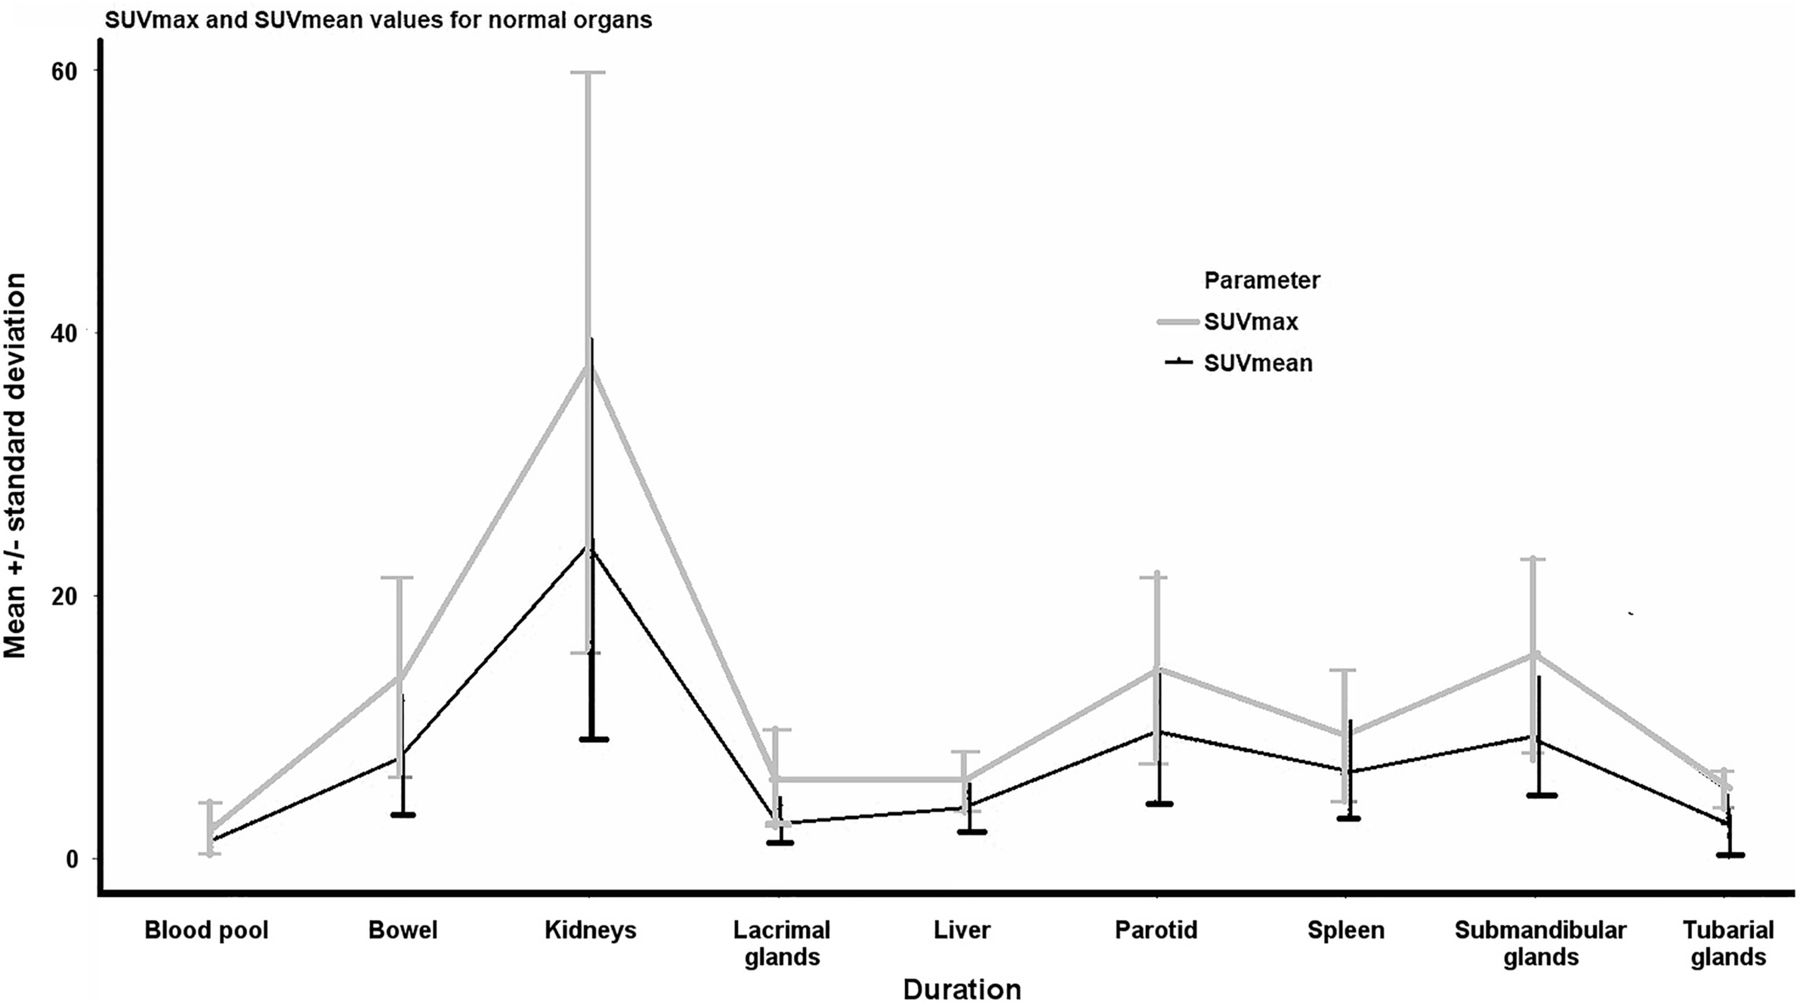
Average SUVmax and SUVmean for different organs.
SUVmean and SUVmax for Normal Organs
Tumor Lesions
When the lesions were classified as per the miPSMA expression score, we got primarily 2 categories, namely scores 2 and 3, as the patients at our center had been referred primarily to assess for 177Lu-PSMA–targeted radioligand therapy feasibility and in that context had overt disease. The averages of SUVmax, T/S ratio, T/L ratio, and T/P ratio in each PSMA expression category were recorded. It appeared that score 3 lesions showed a mean of 3 times the PSMA expression of the parotid glands and 5 times than that of the spleen (Table 3). The presentation and the relative comparison of SUVmax, T/S ratio, T/L ratio, and T/P ratio for each category of lesions (scores 2 and 3) are illustrated in Figure 3. We performed unpaired t tests for these 2 scores of PSMA expression and found significant differences for all parameters (Table 3).
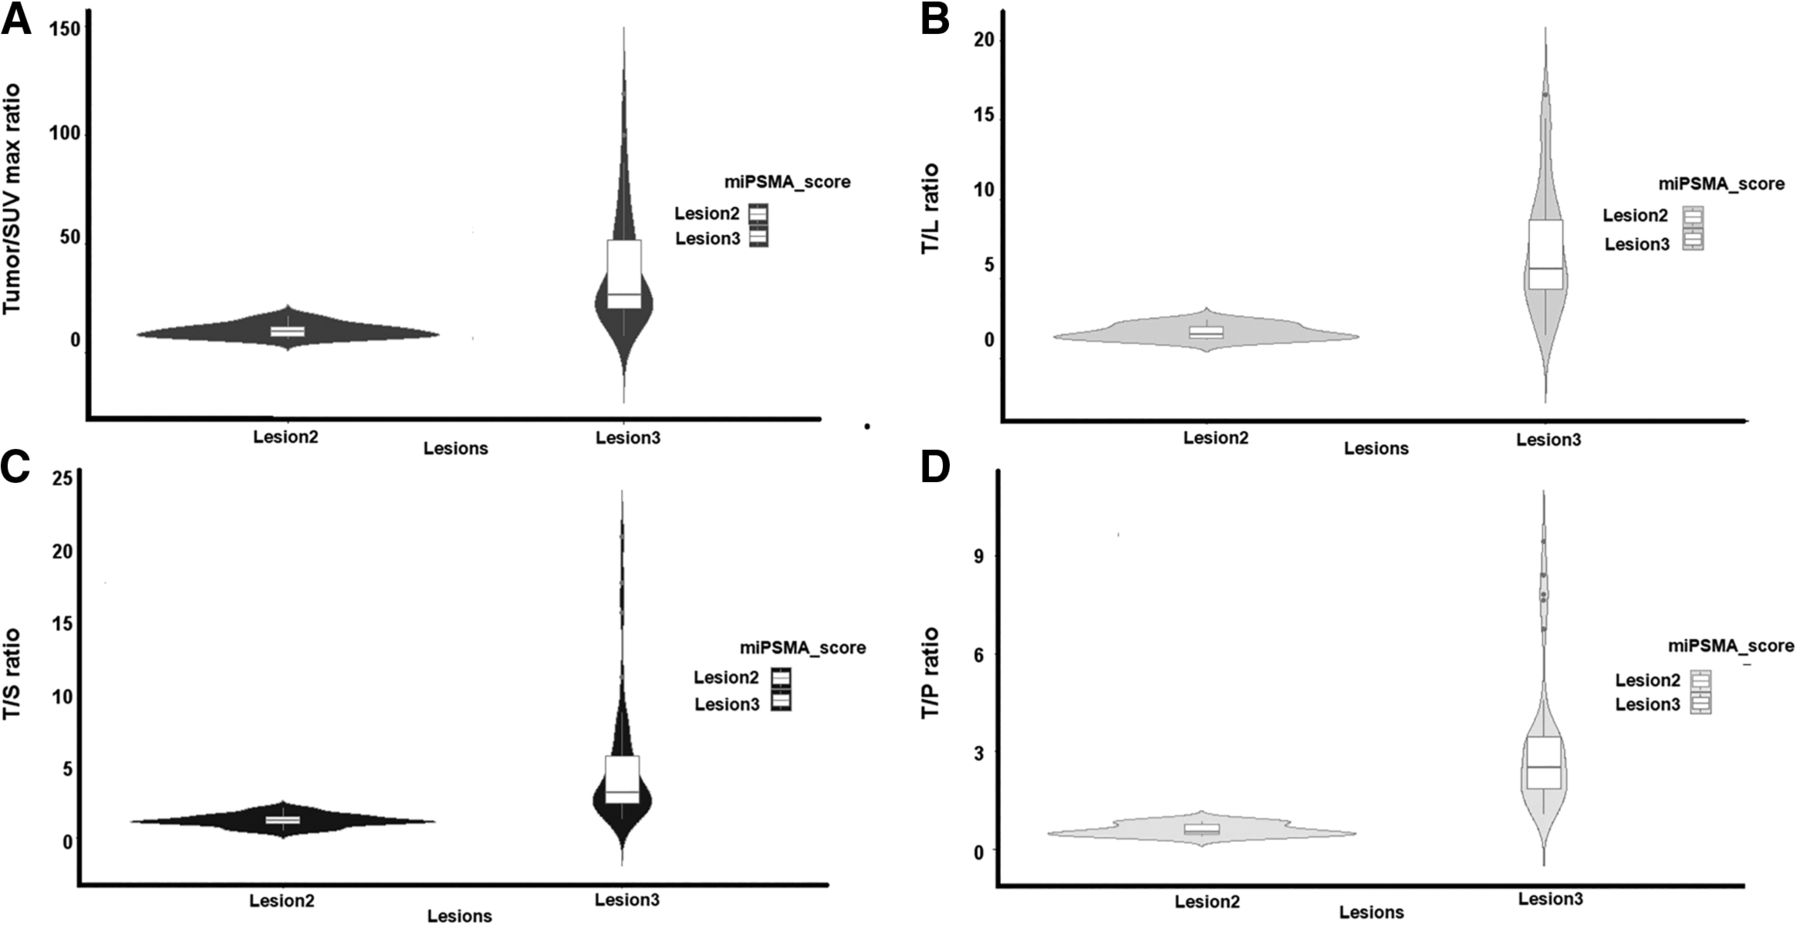
SUVmax, T/L ratio, T/S ratio, and T/P ratio for lesion 2 and lesion 3. Color version of this figure is available as supplemental file at http://tech.snmjournals.org.
Comparative Uptake Values and Ratios of Lesions
Temporal Variation in Uptake
The subgroup of 16 patients with paired early and delayed scan data also passed normality tests. Hence, paired t testing was performed.
Temporal Variation in Normal-Organ Physiologic Uptake
The paired t test assessed the variation in SUVmean and SUVmax between the first and second scan groups. The average SUVmean and SUVmax for most organs remained similar on delayed images. SUVmax was significantly increased in the salivary (submandibular and parotid) and lacrimal glands and in the renal cortices, whereas SUVmean was significantly increased in the spleen and liver and in the parotid, tubarial, and lacrimal glands. The average SUVmean and SUVmax in both studies, with their respective P values, are presented in Table 4.
Comparative Temporal Variation of Mean SUV of Normal Organs with Their P Values
Temporal Variation in Tumor Lesions
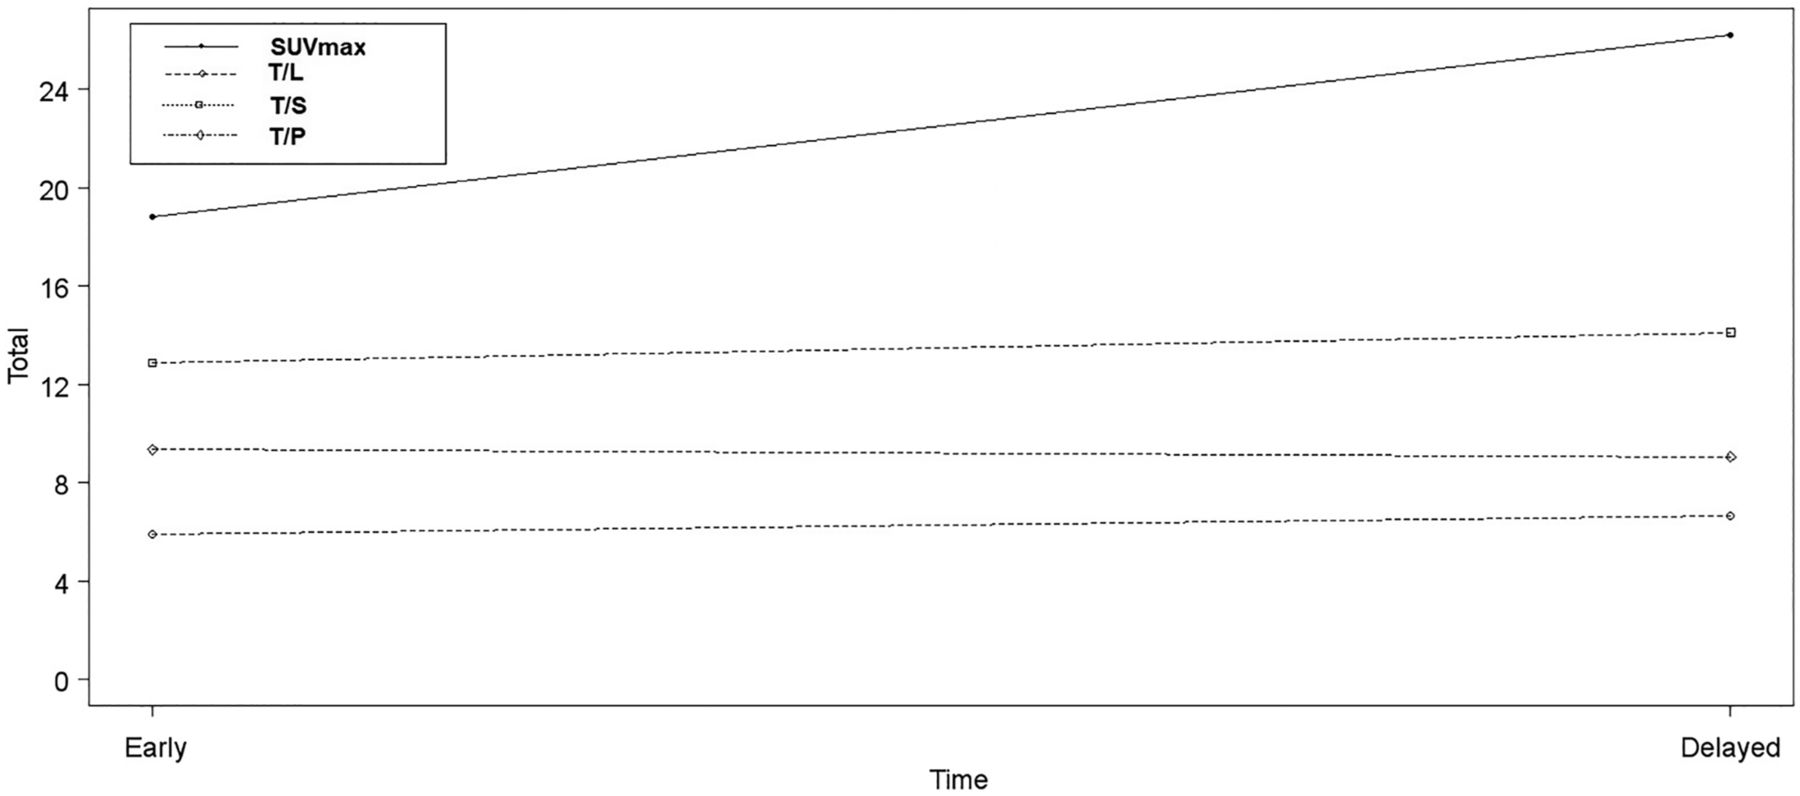
In total, 40 prominent lesions were identified in the subgroup of 16 patients who had dual-time-point imaging for evaluating the temporal variation in values. After applying paired t tests, we observed that SUVmax was significantly different from the baseline PET/CT scan (an increase on the delayed scan; P = 0.0001), whereas there was no significant difference in the T/S, T/L or T/P ratios. The results are in Table 5, and the temporal variation in the lesional parameters is plotted in Figure 4.
Comparison of SUVmax, T/L ratio, T/S ratio, and T/P ratio between scores 2 and 3.
Paired t Test Mean Values for Temporal Variation of Lesional Parameters Between Early and Delayed Images
DISCUSSION
PSMA-based PET/CT imaging and theranostics have brought about a major change in the understanding and management of prostate cancer (9–17). The incorporation of semiquantitative and quantitative information continues to evolve and has the potential to enhance the fundamental understanding of tumor heterogeneity, in vivo kinetics, and response to various therapies and hence can be a valuable supplement to visual interpretation and of paramount importance for undertaking clinical research (9,10,13,17). The present study analyzed 68Ga-PSMA-11, the most common PET tracer used in prostate cancer diagnostics currently. Our results for the physiologic uptake align with some of the previously reported studies (4–6). Thus, we believe the present study results would allow a consistent pattern of reference range to be generated as a standard reference for future studies and research.
The miPSMA score as proposed by Eiber et al. (2) gives an elaborate description of miTNM staging on PSMA-based PET/CT. It is based on assigning a visual score from 0 to 3, with internal organs as reference points. When physiologic uptake is used as an internal reference for a scoring system, the ligand and biodistribution in the presence of high-volume disease have to be kept in mind and interpreted accordingly. The demonstration of SUVmax and its capacity to differentiate grades of lesions can elicit the incremental benefit of objective evidence to accurately assign the score.
Furthermore, to date, only a few studies have compared and addressed intra- and interpatient variability with 68Ga- and 18F-labeled PSMA ligands, with the recommendation of using the spleen as the reference organ for 18F-PSMA-1007 (2,4–6). Besides these variations, other factors that also can influence uptake parameters, such as patient weight, injected dose, and wait duration, have not been conclusively studied. Hence, additionally, in the present study, we evaluated the effect of delayed imaging on SUVmax and SUVmean in normal organs, as well as SUVmax, T/S ratio, T/L ratio, and T/P ratio for tumor lesions.
In our study, the renal cortices showed the highest SUVmax and SUVmean, followed by the salivary glands, bowel, spleen, lacrimal glands, liver, and blood pool. 68Ga-PSMA-11 has been known to demonstrate high renal uptake, as stated in the literature, similar to the results obtained in our study (4–6). However, the maximum uptake in the kidneys was slightly higher in previous studies.
With respect to the temporal variation in normal physiologic uptake, SUVmax showed a significant increase on delayed scans in the salivary (submandibular and parotid) and lacrimal glands and in the renal cortices, whereas SUVmean was significantly increased in the spleen and liver and in the parotid, tubarial, and lacrimal glands. In one previous study, no correlation was found between the uptake time and 68Ga-PSMA-11 SUVpeak in the liver (4). The semiquantitative measurements in our study have additionally demonstrated that the temporal variation in uptake is especially significant for lesions as well. Although the SUVmax of lesions as a standalone parameter varied significantly with time, the T/S and T/P ratios did not show a significant change. This observation would indicate that such temporal variations need to be kept in mind while interpreting images with delayed acquisitions and that T/S, T/L, or T/P ratio may be considered better parameters. The other area in which these values can have potential implications is treatment response assessment: the role of the quantitative parameters with receptor-based PET/CT continues to be in a development phase, and the various SUVs and ratios and their correlation with visual scoring can be useful for this purpose.
The limitations of this study are related to its retrospective nature, the limited number of cases, and its use of a single-center source. We did not study the effect of, or variations in, SUV normalized by lean body mass, which has been postulated to be a more robust parameter for quantitative analysis (18). Our study aimed to establish a reference range for normal organs; however, coexisting pathologies in reference organs, though rare in a given case scenario, are possible (e.g., splenic hemangioma). When present, they would need to be validated, and outliers can be identified. In the present study, the ratios were generated from a holistic perspective rather than a particular case in isolation. As standardization of such reference values becomes acceptable, we can get a general idea on distinguishing between normal and abnormal. We also have to mention that partial-volume effect was not considered in lesion selection in this analysis; the SUV and visual score of a very small lesion may be underestimated because of the partial-volume effect.
CONCLUSION
The reference ranges of normal organs (physiologic uptake) and tumor lesions for uptake and ratios for miPSMA scores of 2 and 3 were documented and established in the present study. On the basis of these data, a consensus on standard reference ranges can be generated for quantitative 68Ga-PSMA-11 PET/CT. The temporal variation trends in lesions and reference organs should be kept in mind for delayed acquisitions. T/S, T/L, or T/P ratios serve as better markers for such scenarios.
DISCLOSURE
No potential conflict of interest relevant to this article was reported.
Footnotes
Published online July 9, 2021.
REFERENCES
- Received for publication December 2, 2020.
- Accepted for publication March 26, 2021.


