


Abstract
18F-NaF PET/CT has a rapid single-pass extraction and fast clearance from soft tissues, resulting in a good target-to-background ratio. This study aimed to establish the optimum acquisition time and dosimetry for 18F-NaF PET/CT to evaluate bone metastases in obese patients. A secondary objective was to evaluate the impact of acquisition time on image quality, lesion detection rate, noise level, and radiation burden in this patient group. Methods: In total, 60 patients were included in the study (20 patients with a body mass index (BMI) of 30.0–34.9 kg/m2, 20 with a BMI of 35–39.9 kg/m2, and 20 with a BMI of >40 kg/m2). Images were acquired after intravenous injection of a 2.2 MBq/kg (0.06 mCi/kg) dose of 18F-NaF. Data were acquired in list mode using ordered-subset expectation maximization reconstruction. The raw data were rebinned to simulate scans with acquisition times of 2, 2.5, and 3 min per bed position. The scans were visually analyzed by 2 observers and scored by rank against a panel of parameters (overall image quality, noise level, background soft tissue, and lesion detectability), and the contrast-to-noise ratio (CNR) was calculated. Results: The mean CNR was 20.19 ± 8.39 for a 2-min acquisition, 21.03 ± 8.35 for 2.5 min, and 22.16 ± 8.37 for 3 min. There were no statistically significant differences in CNR among the 3 different acquisition durations (P > 0.05). Lesion delineation was excellent and independent of the acquisition time. All relevant lesions could be identified with all 3 acquisition times. A mean activity of 215.4 ± 31.3 MBq was injected, with estimated mean effective absorbed doses of 4.09 ± 0.59 mSv for 18F-NaF PET and 7.88 ± 1.66 mSv for CT alone. Conclusion: 18F-NaF PET/CT can be beneficial in obese patients because of its good pharmacokinetics. Optimal osseous staging can be achieved with relatively low doses and radiation burden. Lesion delineation was excellent regardless of acquisition time. However, it is recommended that an acquisition of 3 min per bed position be used in patients with a BMI of more than 40.
Morbid obesity causes many serious health problems, and its prevalence is increasing worldwide. The American Society of Clinical Oncology recently noted that obesity is overtaking tobacco use as the most significant preventable lifestyle risk factor for cancer mortality (1). Being overweight or obese contributes to as many as 1 in 5 cancer-related deaths. Historically, imaging to evaluate skeletal metastases has been accomplished mostly using scintigraphy with 99mTc-methylene diphosphonate (MDP). However, this conventional bone scan has certain limitations due to the low quality of obese patients’ images secondary to high soft-tissue activity in the background. In bone scintigraphy, image quality is often limited by soft-tissue attenuation and photon scatter caused by overlying fatty tissue. A large amount of fat tissue can entirely obscure the underlying imaged bone (2). 18F-NaF PET/CT is especially superior to conventional planar imaging in obese patients because of its particularly favorable pharmacokinetics in this group. 18F-NaF PET/CT is less susceptible to artifacts induced by body habitus and retains its image quality and diagnostic confidence. We have previously reported on the advantages and superior diagnostic accuracy of 18F-NaF PET/CT for detecting bone metastases in obese patients (3). We believe that 18F-NaF PET/CT should be the imaging modality of choice for skeletal staging in these patients. This study aimed to evaluate the impact of acquisition time on detection of bone metastases using 18F-NaF imaging in obese patients and to optimize protocols, possibly leading to reduced radiation burden.
MATERIALS AND METHODS
Patients
Consecutive obese patients referred for skeletal staging with 18F-NaF PET/CT between April 2018 and October 2019 were included. 18F-NaF PET/CT was performed for routine primary staging or restaging or for imaging workup when bone metastases were clinically suspected (e.g., bone pain, elevated tumor marker, or suggestive lesions on a conventional radiologic modality). Cases with missing demographics and scan-specific data were excluded from the study. The institutional review board approved this retrospective study, and the requirement to obtain informed consent was waived.
Body Mass Index (BMI)
Patient height and weight were measured and recorded at the scan time. From this information, BMI was calculated as the body weight in kilograms divided by the height in square meters. Several classifications and definitions for grading obesity are accepted. The World Health Organization criteria for classifying BMI in an Asian population (the population of this study) specifies 3 classes of obesity, with class I being a BMI of 30.0–34.9 kg/m2; class II, 35.0–39.9 kg/m2; and class III (extreme), more than 40 kg/m2 (4).
18F-NaF PET/CT
Images were acquired after intravenous injection of a 2.2 MBq/kg (0.06 mCi/kg) dose of 18F-NaF and after a 60- to 90-min uptake period (5). PET emission images were obtained in 3-dimensional time-of-flight mode on a Discovery 710 PET/CT system (GE Healthcare) at 3 min per bed position from vertex to toes. PET images were reconstructed using ordered-subset expectation maximization (OSEM) with point-spread function modeling. The standard PET reconstruction algorithm at our center is time-of-flight OSEM, and the point-spread function protocol uses 3 iterations, 32 subsets, and a 6.4-mm filter. Data were acquired in list mode so that the raw data could be rebinned to simulate scans acquired with 2, 2.5, and 3 min per bed position. Unenhanced CT was performed using a tube current of 50–120 mA determined by an automated algorithm based on the planar scout view in order to achieve a noise index of 20 with a tube voltage of 120 kVp and a table pitch of 1.3. Axial CT images were reconstructed in a 512 × 512 matrix, with a thickness of 2.5 mm. PET, CT, and fusion images were reviewed on a workstation integrated with a PACS on a Hermes Hybrid Viewer workstation (version 2.2).
Image Interpretation and Data Analysis
Qualitative Analysis
PET images comprising 3 reconstructions per case were visually analyzed by 2 nuclear medicine consultants with more than 8 y of experience. The reconstructions were labeled A–C in a randomized order, with the CT component available for image fusion. The cases were reviewed sequentially, and the images were scored (from 1 [excellent] to 5 [unacceptable]) for overall quality, background soft-tissue quality, noise level, and lesion detectability. The scorers also indicated their most and least preferred reconstruction for each case. Interscorer agreement on the ranking within each image quality parameter was assessed using the Cohen κ-statistic.
Quantitative Analysis
Contrast-to-noise ratio (CNR) was calculated using the methodology described by Beijst et al. (6). CNR is defined as…
where  is the mean count or SUV in the target volume of interest (VOI),
  is the mean count or SUV in the background VOI, and
  is the SD in the background VOI. The target VOI was a sphere with a diameter of 2 cm (volume, 4.2 cm3) centered in the L3 vertebra. Background spheric VOIs of the same diameter were centered on the right or left psoas muscle at the L3 level.
Lesion Analysis
Each site of abnormal radiotracer uptake was graded using a standardized reporting system with a 5-point scale (1 = definitely benign, 2 = possibly benign, 3 = equivocal, 4 = possibly malignant, and 5 = definitely malignant) based on the intensity of uptake, its anatomic location, and morphologic features on CT (3). A score of 1, 2, or 3 was considered negative for metastatic disease, and a score of 4 or 5 was considered positive. Patients were followed every 3–6 mo for a minimum of 1 y after the initial 18F-NaF PET/CT imaging. The reference standard was the composite of follow-up data consisting of clinical examination, tumor markers, and serial radiologic follow-up (including 18F-NaF PET/CT, bone scanning, 18F-FDG PET/CT, CT, or MRI).
Patient Radiation Dosimetry
The effective dose imparted by 18F-NaF (internal exposure) was calculated using a coefficient of 0.024 mSv/MBq (0.089 mrem/mCi) according to publication 106 of the International Commission on Radiological Protection (7). The volume CT dose index (mGy) and dose–length product (mGy⋅cm) were obtained directly from the display screen of the CT workstation to estimate the effective dose from the whole-body CT scan (external exposure). The estimated effective dose was calculated by multiplying the dose–length product by a conversion coefficient of 0.015 (mSv/[mGy⋅cm]) based on publication 103 of the International Commission on Radiological Protection (8).
Statistical Analysis
Statistical analysis was performed using SPSS, version 20.0. Results are presented as mean ± SD. ANOVA was used to test the significance of differences between the reconstructions. Post hoc testing was done using the Tukey honestly-significant-difference test to determine whether there was a difference between the mean of all possible pairs using a studentized range distribution. P values of less than 0.05 were considered to be significant. The Cohen weighted κ-coefficient was used to calculate agreement between reviewers. The possible range of weighted κ-values was from −1 (complete disagreement) to +1 (perfect agreement) and was corrected to eliminate agreement expected by chance alone. κ was classified as follows (9): 0, chance agreement; <0.20, poor agreement; 0.21–0.40, fair agreement; 0.41–0.60, moderate agreement; 0.61–0.80, substantial agreement; 0.81–1.00, very good agreement. Sensitivity, specificity, positive predictive value, negative predictive value, and accuracy, together with exact 95% CIs, were calculated for 18F-NaF PET/CT on the basis of the true-positive and true-negative findings.
RESULTS
In total, 60 patients were included in the study (20 patients with a class I BMI, 20 with class II, and 20 with class III). Relevant clinical data are summarized in Table 1.
Patient Characteristics
In all patients, 18F-NaF PET/CT images showed high tracer extraction with low soft-tissue and background activity across the range of imaged BMI categories, and none of the scans were categorized as suboptimal for diagnostic reading. In most cases (63% and 57% for scorers 1 and 2, respectively), both scorers preferred the 3-min acquisition. Interscorer agreement is shown in Table 2.
Interscorer Agreement on Image Quality Parameters for Different Acquisition Times
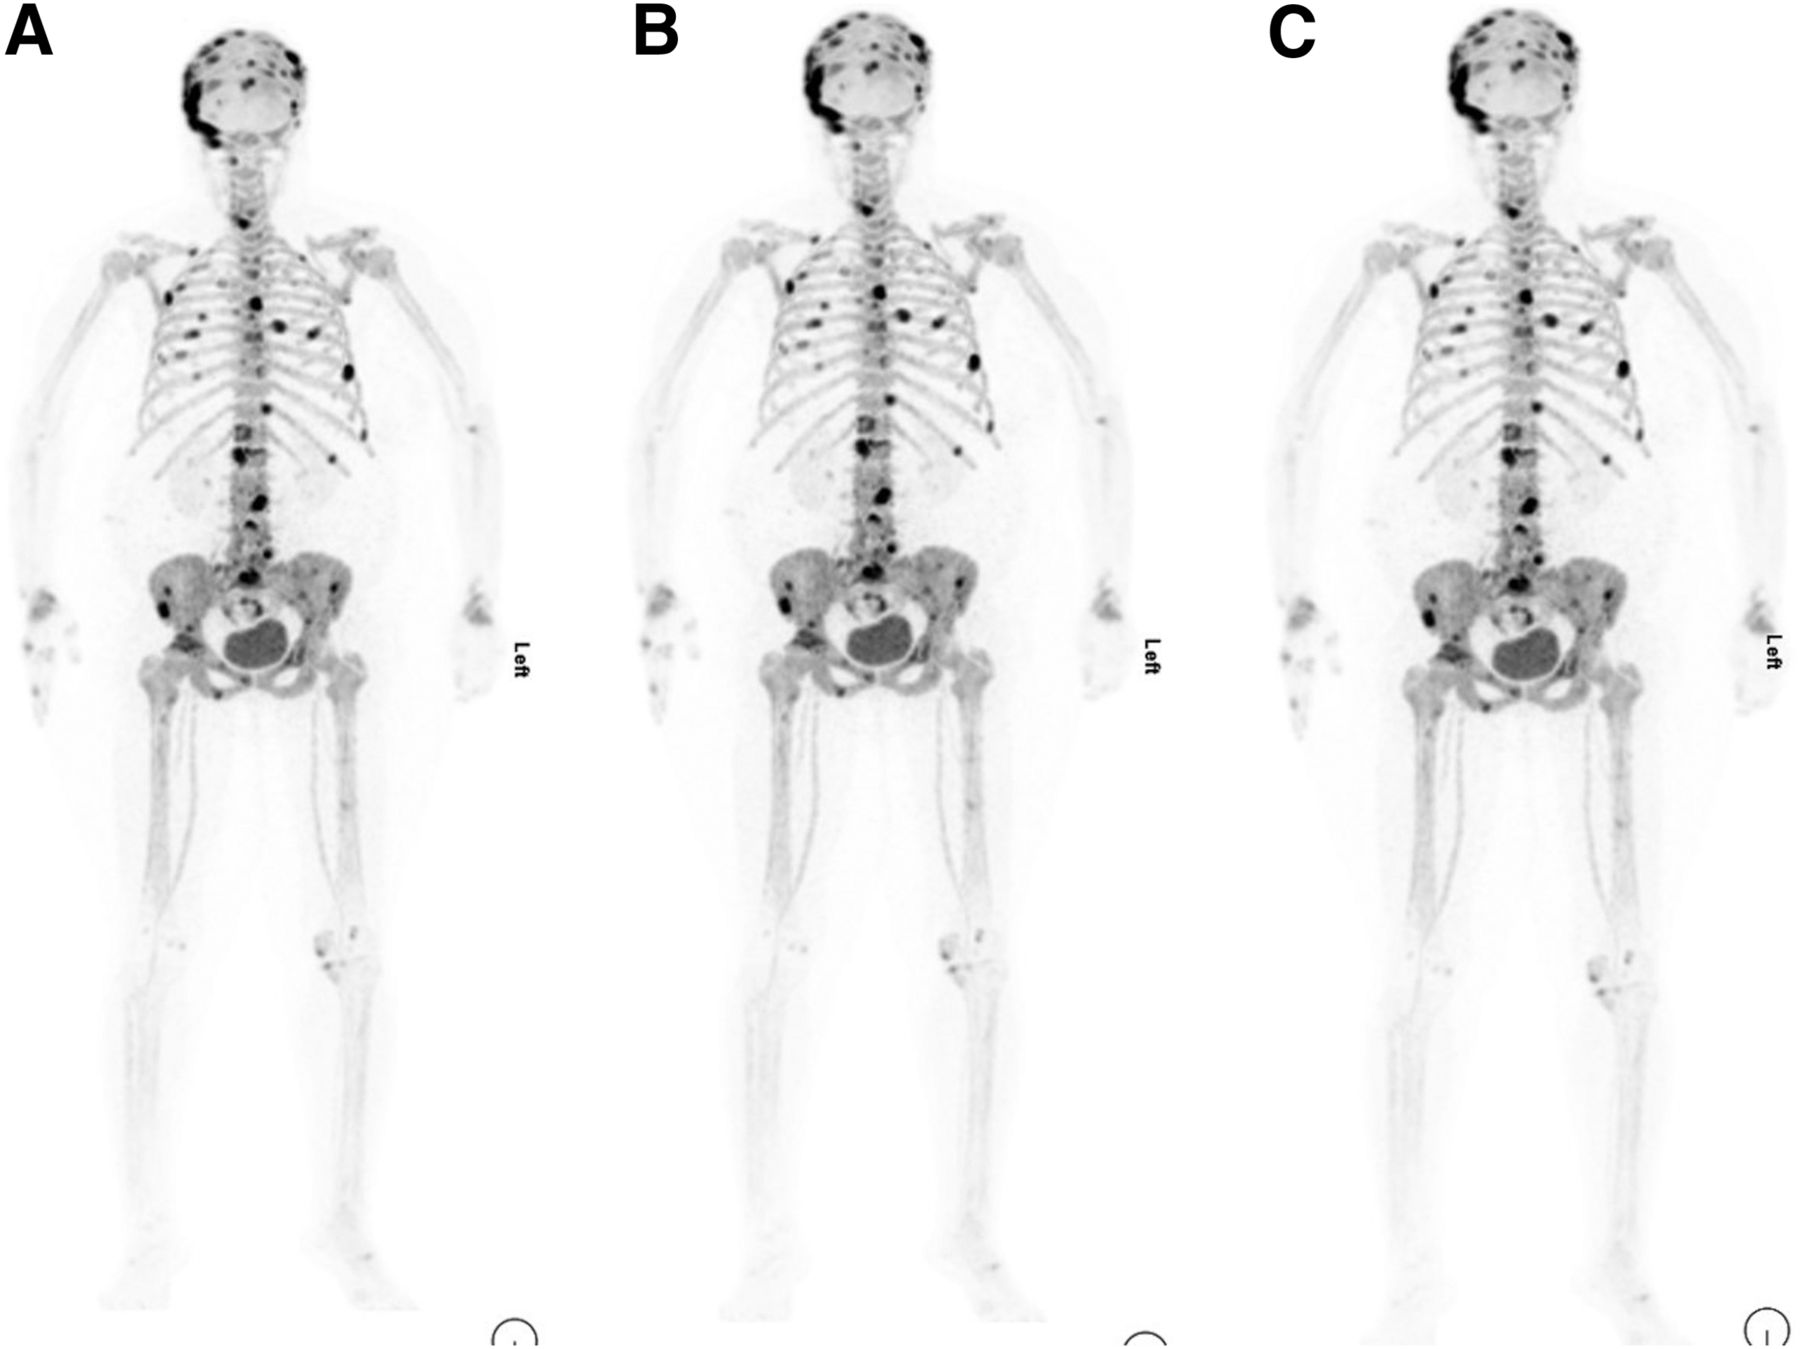
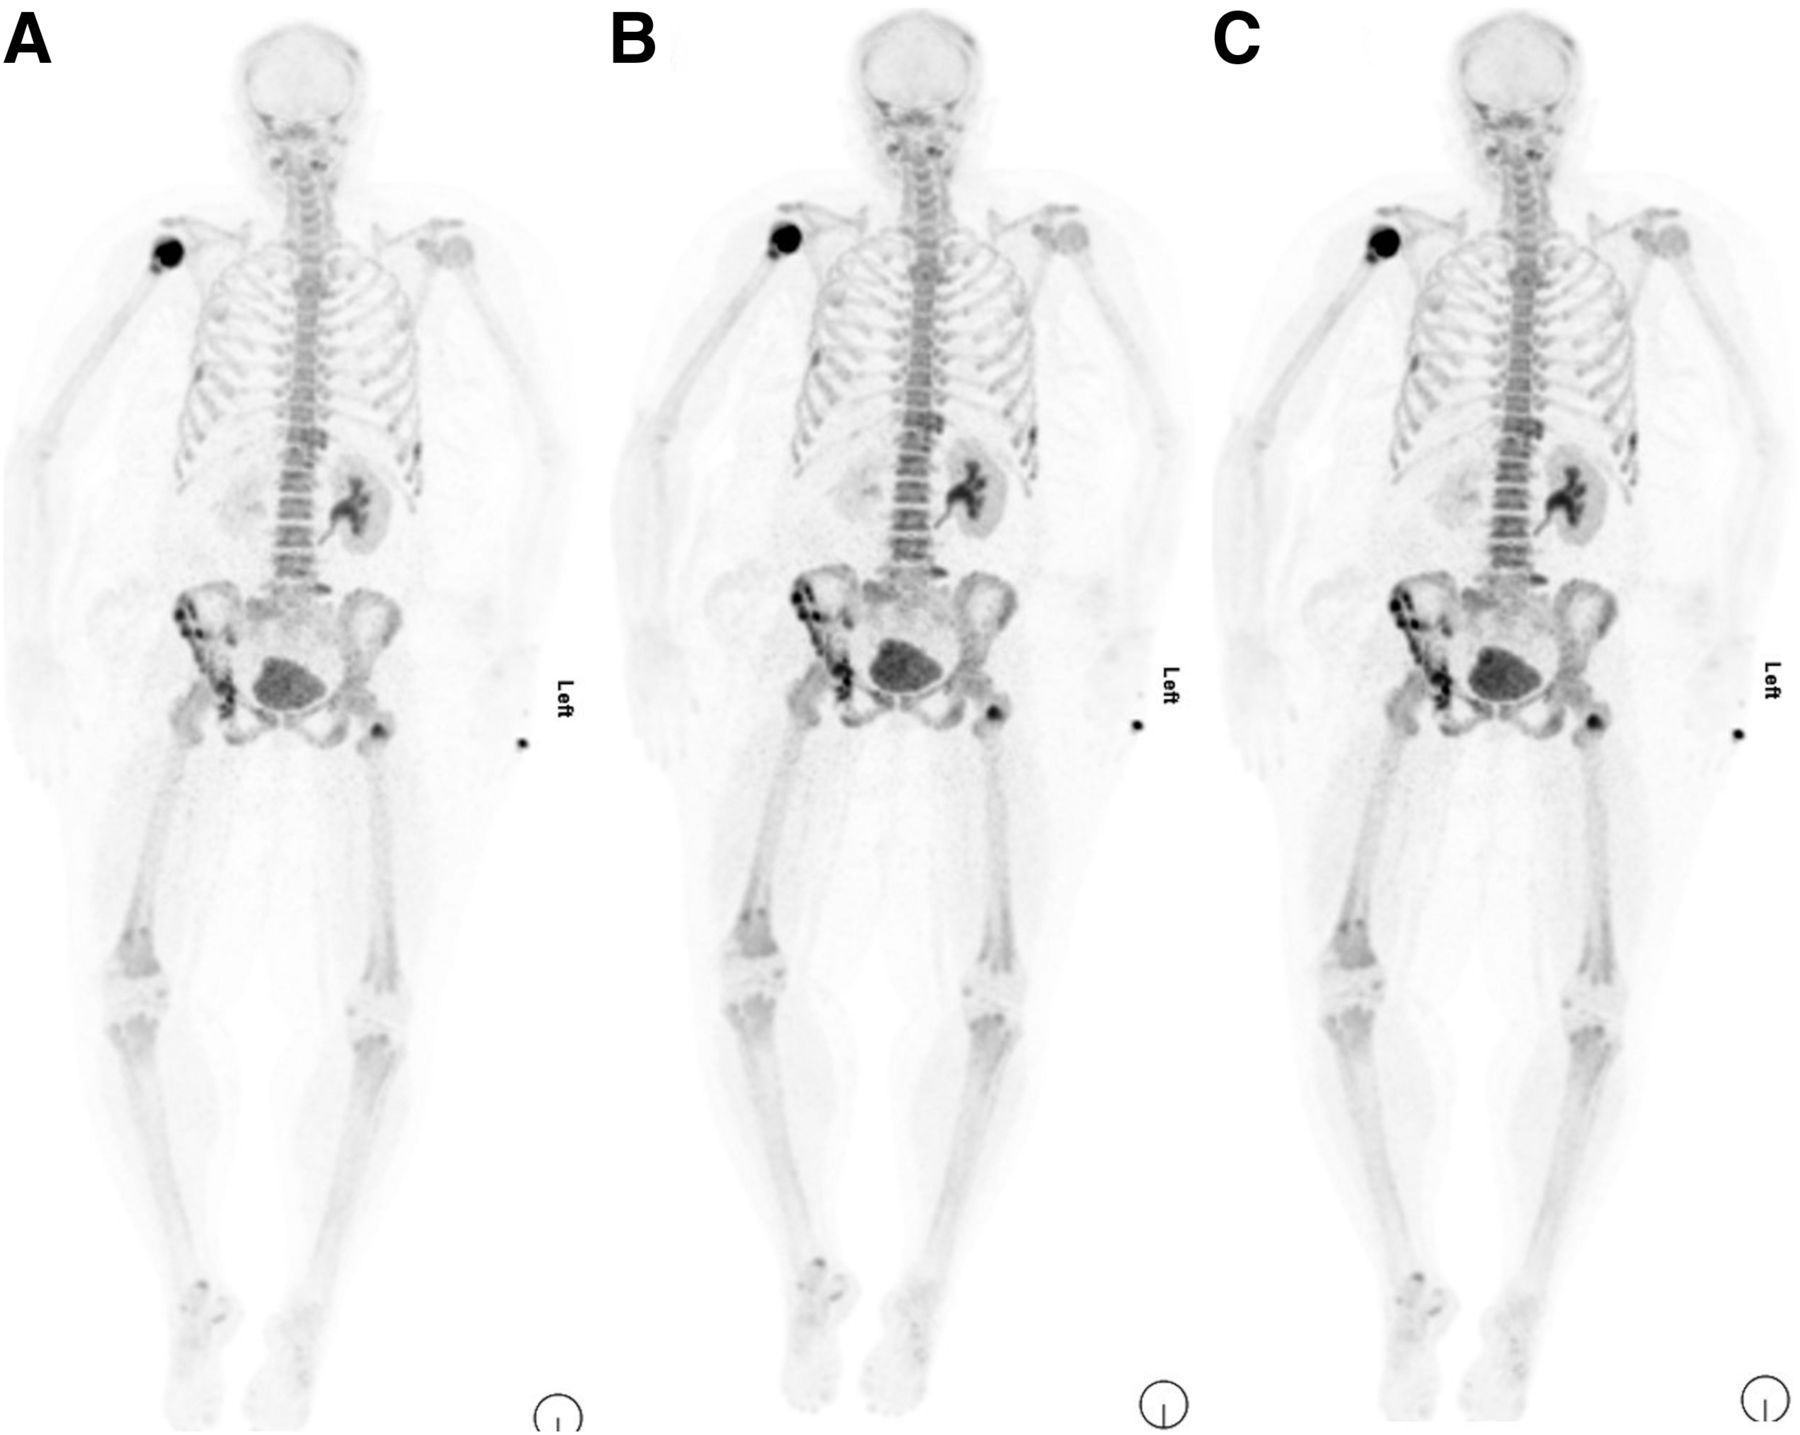
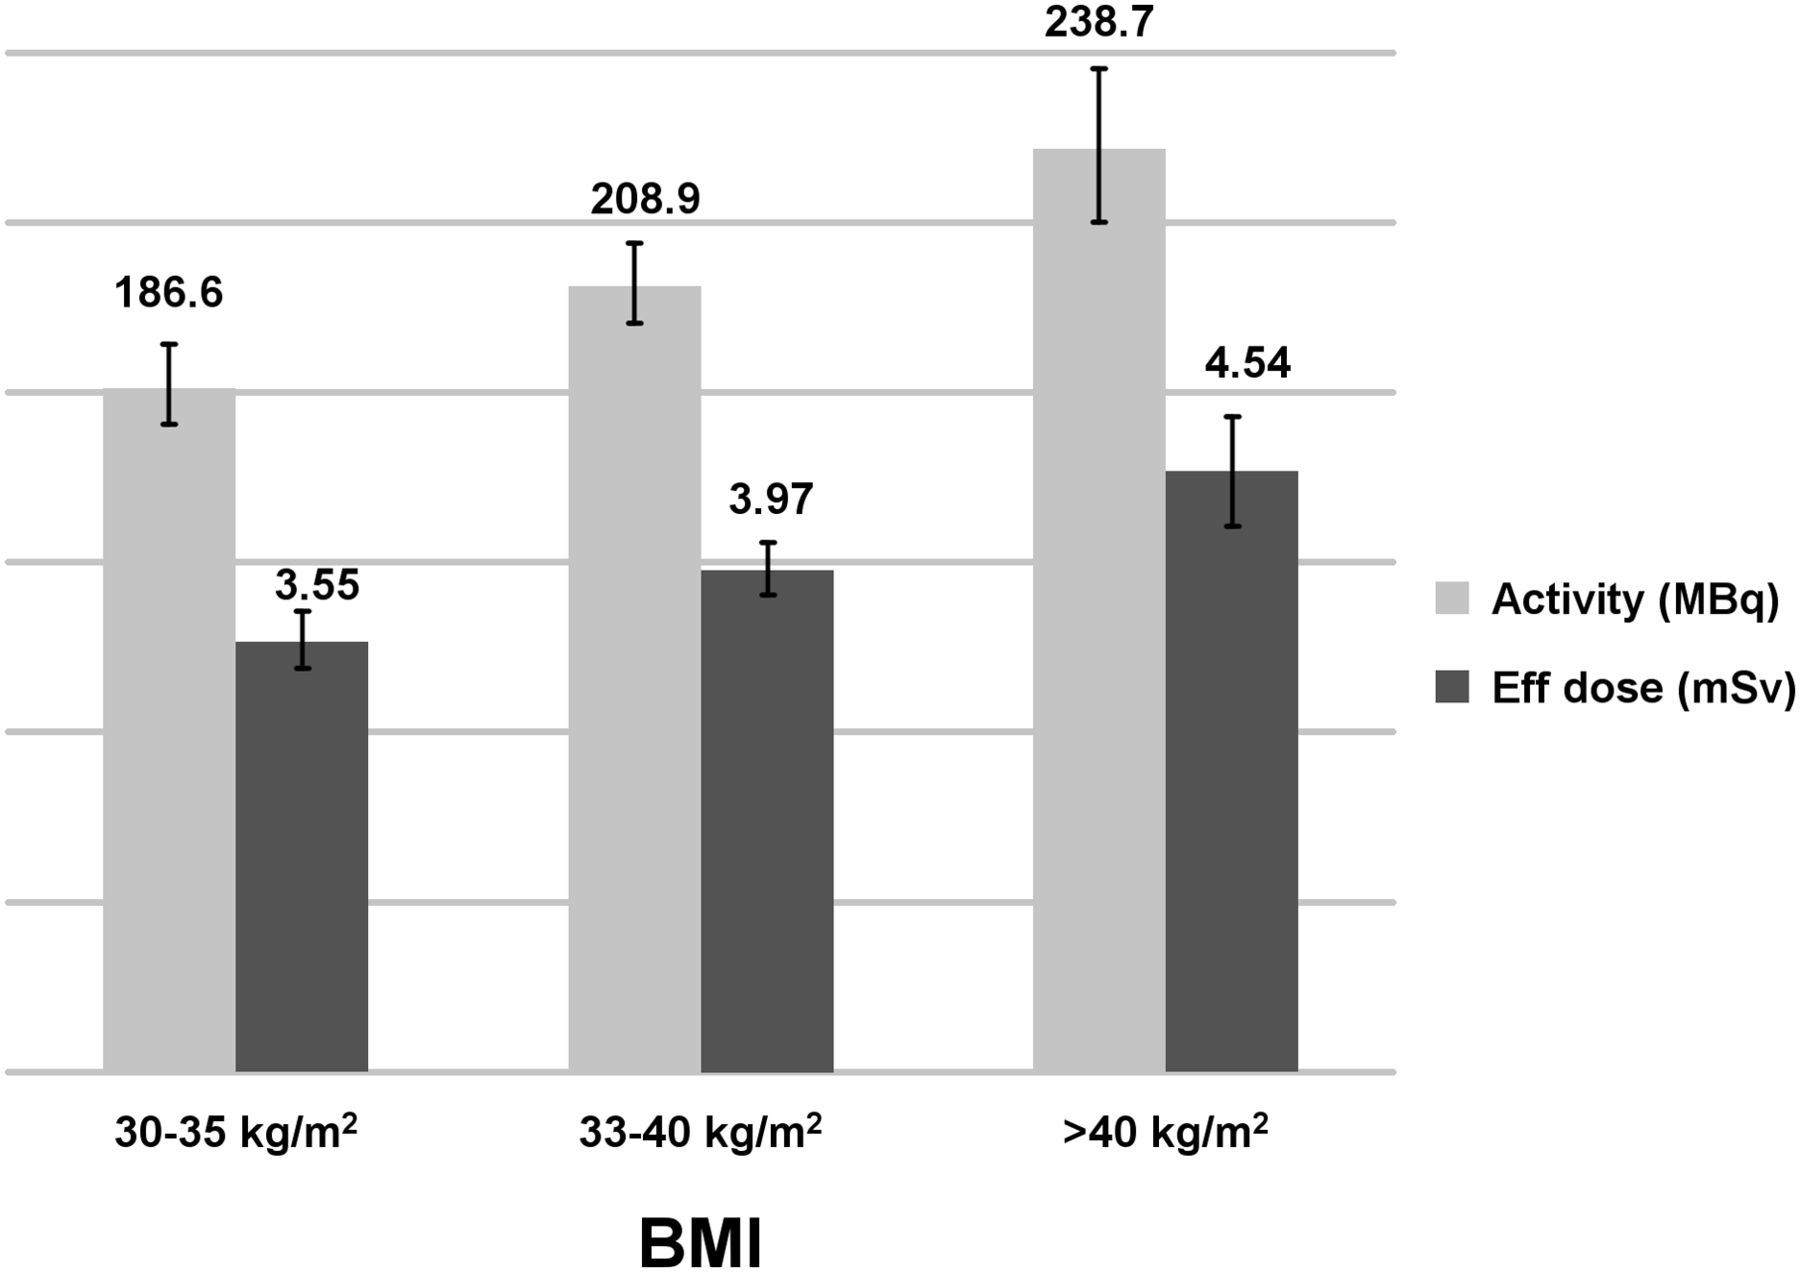
The qualitative analysis results are shown in Table 3. The study did not reveal any statistically significant differences in overall image quality or individual image quality parameters (background soft tissue, noise level, and lesion detectability) in classes I or II (Figs. 1 and 2). In class III, a statistically significant difference in noise level score was observed (P < 0.001), with lower noise for the 3-min acquisition, whereas background soft tissue and lesion detectability did not significantly differ among acquisition times (Fig. 3). All relevant lesions could be delineated well at all 3 acquisition times.
Qualitative Analysis of Image Quality Parameters for Different Acquisition Times

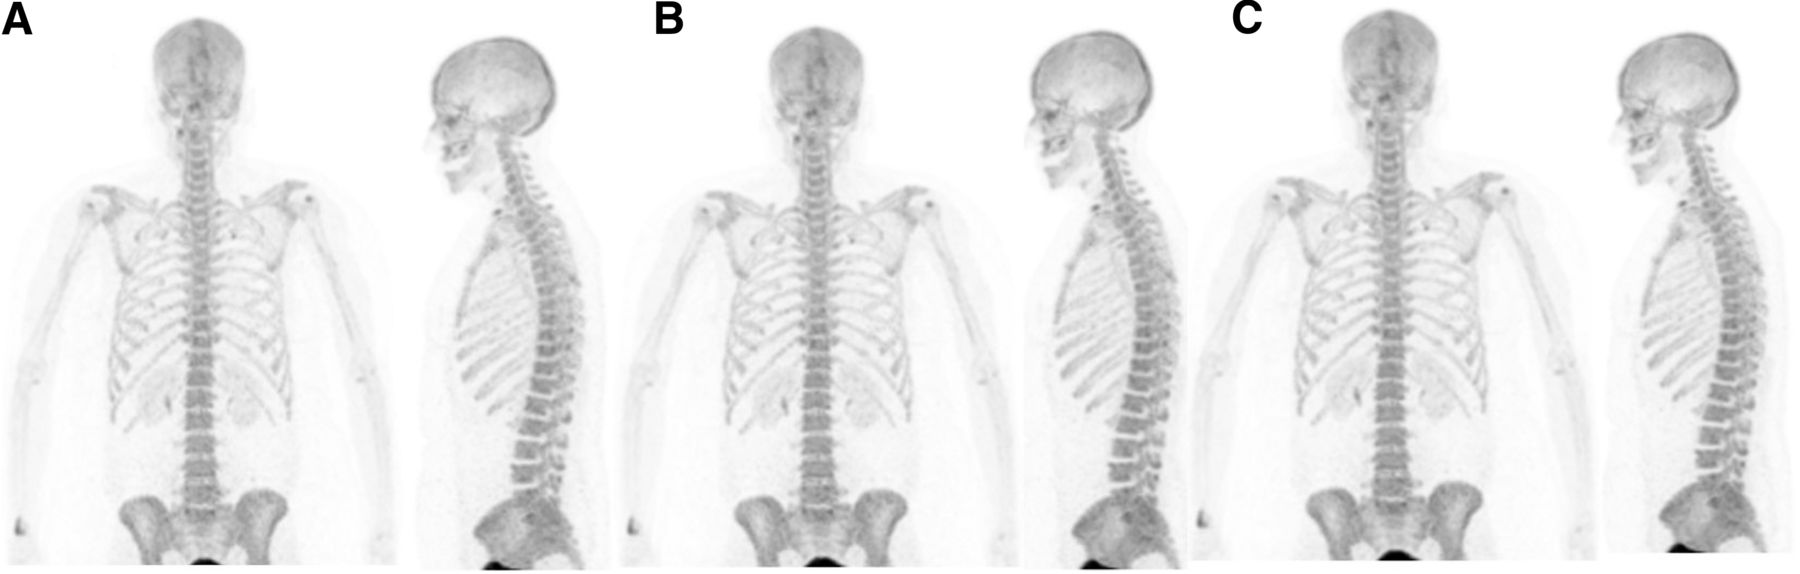
Anterior and lateral maximum-intensity-projection 18F-NaF PET images of 44-y-old woman who has class I obesity (BMI, 32.4 kg/m2), with OSEM reconstructions using different acquisition times per bed position: 2 min (A), 2.5 min (B), and 3 min (C). On visual analysis, there is no difference in image quality among acquisition times.
Anterior maximum-intensity-projection 18F-NaF PET images of 60-y-old woman who has class II obesity (BMI, 38.6 kg/m2), with different OSEM acquisition times per bed position: 2 min (A), 2.5 min (B), and 3 min (C). On visual analysis, there is no difference in image quality or lesion detection among acquisition times.
Anterior maximum-intensity-projection 18F-NaF PET images of 45-y-old woman who has class III obesity (BMI, 44 kg/m2), with different OSEM acquisition times per bed position: 2 min (A), 2.5 min (B), and 3 min (C). Visual analysis shows decrease in noise gradient from images A to C. Readers considered image C to provide best clinical information and quality at lowest noise level.
The mean CNR was 20.19 ± 8.39 for a 2-min acquisition, 21.03 ± 8.35 for 2.5 min, and 22.16 ± 8.37 for 3 min. CNR did not significantly differ among the different acquisition times (P = 0.4) in any of the BMI groups (Table 4).
CNRs for Different Acquisition Times
The 18F-NaF PET/CT findings were graded as definitely benign in 21 patients, possibly benign in 8, equivocal in 2, possibly malignant in 4, and malignant in 25. Sensitivity was 96.6% (95% CI, 82.2%–99.9%); specificity, 96.8% (95% CI, 83.3%–99.9%); positive predictive value, 96.6% (95% CI, 80.3%–99.5%); negative predictive value, 96.8% (95% CI, 81.4%–99.5%); and accuracy, 96.7% (95% CI, 88.5%–99.6%).
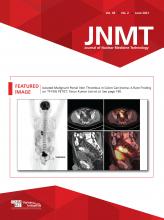
Patients were administered a mean activity of 215.4 ± 31.3 MBq, resulting in an estimated mean effective absorbed dose of 4.09 ± 0.59 mSv for 18F-NaF PET and 7.88 ± 1.66 mSv for CT alone. The mean cumulative effective dose of the 18F-NaF PET/CT scans was 11.9 ± 2.08 mSv. The average activity and effective dose of the 18F-NaF PET scans among the different BMI subgroups is shown in Figure 4.
Average dose and effective dose of 18F-NaF among different BMI classes.
DISCUSSION
Many studies in the literature have demonstrated that a patient’s BMI can affect image quality (10). In obese patients, image noise is increased because fewer photons are collected, and the increased attenuation correction factors amplify noise. Radiologic and nuclear medicine investigations in patients with a high BMI can therefore be challenging. Some authors have suggested that a higher administered activity per kilogram of body weight should be used to improve image quality. The detectability of low-contrast features in PET scans depends on count statistics, which rely on various factors such as scanner efficiency, administered activity, uptake time, acquisition time, and patient size. Increasing the administered activity is less effective at improving image quality than the same proportional increase in acquisition time (11). Advances in PET hardware and software over the last 2 decades have significantly increased the sensitivity of PET systems (12), and optimal image quality can be achieved with lower injected activities. The impact of reducing acquisition time on image quality or lesion detectability can be investigated by acquiring data in list mode so that the raw data can be rebinned to simulate scans acquired with reduced times (13,14).
18F-NaF PET/CT has proved to be an excellent bone-seeking agent because its high bone uptake, minimal binding to serum proteins, rapid single-pass extraction, and fast clearance from soft tissues (15,16) allows a shorter interval between injection and imaging (17). The improved bone-to-background ratio and the higher spatial and contrast resolution of 18F-NaF PET/CT lead to better delineation of bone lesions. Ohnona et al. (18) suggested that the dose of 18F-NaF may be lowered to as much as half the recommended dose without any significant untoward effect on image quality; with such a reduction in injected activity, the effective dose of 18F-NaF would be no more than that of 99mTc-MDP.
The current study aimed to evaluate the impact on image quality, lesion detection rate, noise level, and soft-tissue uptake when 3-dimensional time-of-flight function is used to vary the acquisition time for 18F-NaF PET in obese patients. Patient data were investigated using list-mode acquisition to obtain comparable 2-, 2.5-, and 3-min frames. Qualitative and quantitative analysis showed that image quality was excellent regardless of acquisition time. All relevant lesions could be identified with all 3 acquisition times. There was no difference in CNR among shorter and longer acquisition times, and acquisition time did not seem to significantly influence lesion detection rates. Most importantly, the study showed that it is clinically feasible to reduce acquisition times from 3 min to 2 min per bed position in class I and II obese patients. OSEM reconstruction using an acquisition time of 3 min per bed position had a relatively higher CNR, but this difference was not statistically significant in patients with a BMI of more than 40 (P = 0.20)—that is, image quality was only slightly adversely affected by the shorter acquisition time in extremely obese patients. There was, however, a significant improvement in visual assessment of image noise when using acquisitions of 3 min per bed position in this group (P = 0.001). Perhaps a higher acquisition time (3 min) should therefore be preferable in this group (Fig. 3).
The Society of Nuclear Medicine and Molecular Imaging guidelines (19) suggest a fixed activity of 185–370 MBq (5–10 mCi) for 18F-NaF in adults. The European Association of Nuclear Medicine (5) guidelines suggest 1.5–3.7 MBq/kg in adults, with a maximum recommended dose of 370 MBq (10 mCi) for obese individuals. Our center has adapted a low-injected-activity protocol for 18F-NaF PET by injecting a 2.2 MBq/kg (0.06 mCi/kg) dose of 18F-NaF for patients in all BMI groups—a dose that is relatively low compared with the usual injected activity of 185–370 MBq (5–10 mCi). Recently published data from our group showed that a good-quality adult scan could be achieved with as low as a 2.22 MBq/kg (0.06 mCi/kg) dose of 18F-NaF (20). The current findings suggest that 18F-NaF activity can potentially be lowered further in prospective trials, reducing the radiation burden even below that of 99mTc-MDP dose levels.
In our study, the mean effective absorbed dose for 18F-NaF PET was 4.09 ± 0.59 mSv, comparable to that for 99mTc-MDP bone imaging. The typical effective dose for a 1,110-MBq 99mTc-MDP bone scintigraphy examination in an obese adult is around 6.32 mSv. Similarly, Jambor et al. (21) reported that the radiation dosimetry for 18F-NaF PET is similar to that for 99mTc-MDP imaging. Diagnostic-quality 18F-NaF imaging can be effectively performed using an administered activity that is lower, overall, than that for 99mTc-MDP (5).
Our clinical experience shows that 18F-NaF PET/CT is less susceptible than conventional bone scan (MDP imaging) to artifacts induced by body habitus and retains its image quality even in patients with a high BMI. In our study, 18F-NaF PET/CT had excellent diagnostic test characteristics for the detection of bone metastases, with results similar to those reported by Jambor et al. (21). 18F-NaF PET/CT is a sensitive tool for detecting skeletal metastases and is more sensitive and specific than conventional MDP bone scan in evaluating osteoblastic metastases and has fewer equivocal findings (22).
Our study had some limitations; the scans were performed on a highly sensitive lutetium-yttrium oxyorthosilicate PET/CT system using time-of-flight mode, which may not be ubiquitously available. The high-resolution reconstruction protocol included point-spread function modeling, which generated relatively smooth images with low noise characteristics. Also, the OSEM reconstruction settings were not changed for the simulated acquisition times per bed position. The work needs to be repeated with different scanner technology types and other reconstruction protocols in obese populations to further validate these results.
CONCLUSION
18F-NaF PET/CT facilitates high-quality imaging in obese patients. Health-care institutions should consider 18F-NaF an imaging agent of choice for detecting metastasis in such patients. 18F-NaF PET/CT retains its image quality in patients with a high BMI even with a lower injected activity of 2.2 MBq/kg (0.06 mCi/kg) and a reasonable acquisition time of 2–3 min per bed position. 18F-NaF PET/CT is less susceptible than conventional MDP bone scan to artifacts secondary to obesity, and dedicated protocols are not required for morbidly obese patients. Moreover, our results suggest that further reductions in administered activities are possible with the current generation of PET/CT devices.
DISCLOSURE
No potential conflict of interest relevant to this article was reported.
Footnotes
Published online Dec. 30, 2020.
REFERENCES
- Received for publication October 6, 2020.
- Accepted for publication December 28, 2020.


