


Article Figures & Data
Figures
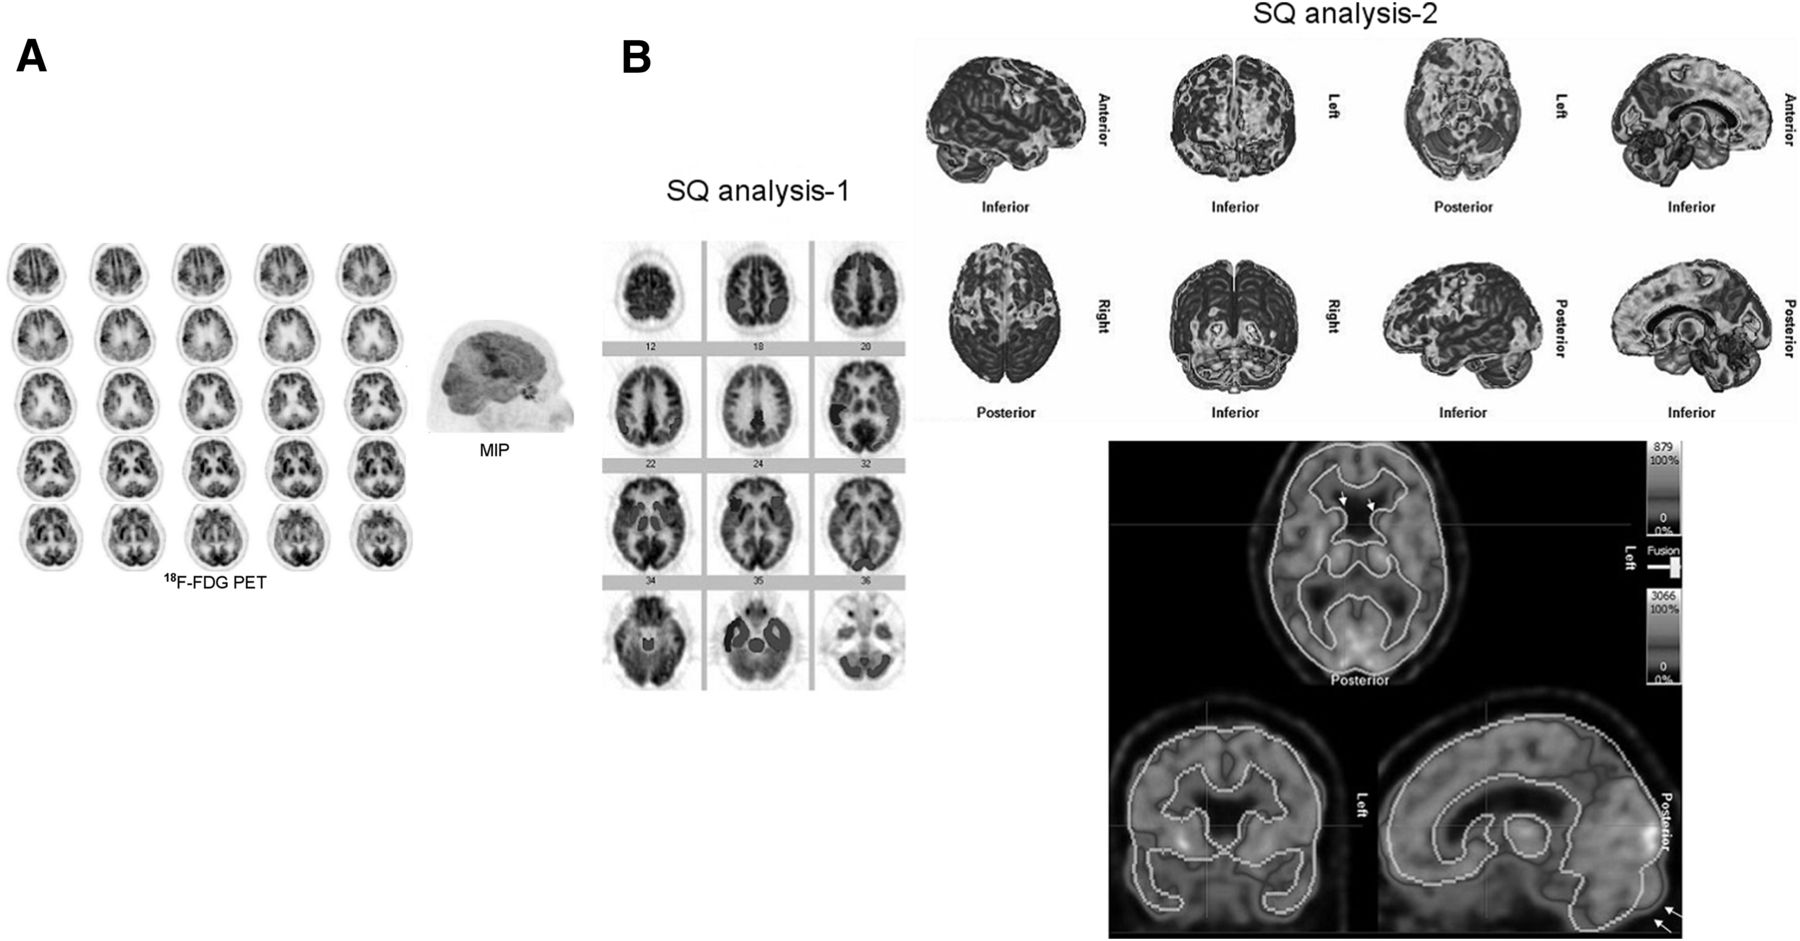
- FIGURE 1.
A 60-y-old woman with progressive cognitive decline. (A) 18F-FDG PET images show bilateral marked hypometabolism in parietal and temporal lobes and bilateral mild hypometabolism in frontal lobes. Preserved metabolism is seen bilaterally in motor cortices, occipital lobes, and basal ganglia. Findings are consistent with AD. PET maximum-intensity projection better locates cerebral cortical hypometabolic regions in 3-dimensional presentation. (B) Commercially available semiquantitative analysis program (semiquantitative analysis 1: NeuroQ; Syntermed Inc.) shows reduced metabolism bilaterally in frontal lobes, posterior cingulate cortices, temporoparietal junctions, temporal lobes (more on right); in right visual associative cortex; and very mildly in left basal ganglia (blue: normal metabolism; red, pink, and purple: hypometabolism [red > −3 SDs, pink > 2–3 SDs, and purple > 1–2 SDs]; color-coded images can be found as supplemental files online at http://jnmt.snmjournals.org). However, the program does not show bilaterally marked hypometabolism in parietal lobes (superior and inferior) and underestimates hypometabolism in left temporal lobe. Another commercially available semiquantitative analysis program (semiquantitative analysis 2: Hermes BRASS; Hermes Medical Solutions) provides results better matching visual analysis in cerebral cortex but not in basal ganglia (hypometabolism: SD > −2). This program shows suboptimal registration in various parts of brain, including caudate heads (arrows). MIP = maximum-intensity projection; SQ = semiquantitative.
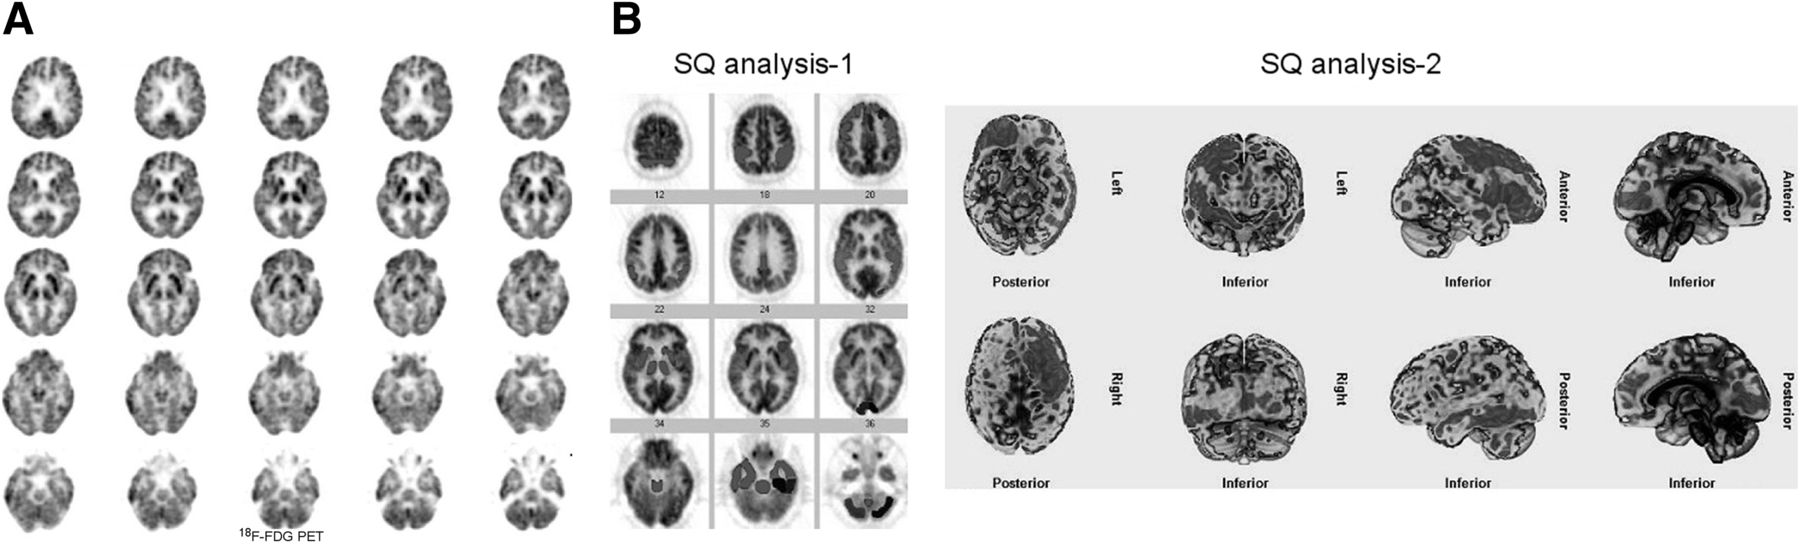
- FIGURE 2.
A 71-y-old woman who is clinically DLBD, with progressive dementia, visual hallucinations, and parkinsonian features. (A) 18F-FDG PET images demonstrate reduced glucose metabolism bilaterally in primary visual cortices (arrows) and a mild or questionable reduction in metabolism in left medial frontal region and left temporal lobe. Findings are consistent with DLBD. (B) Semiquantitative analysis 1 shows markedly reduced metabolism bilaterally in visual cortices, cerebellum, and left posterior temporal lobe and mildly reduced metabolism in left parietotemporal region, frontal lobe, and anterior cingulate cortex. Cerebellar uptake appears to be normal on visual analysis. This finding is likely due to suboptimal selection of cerebellum in semiquantitative analysis 1, possibly erroneously including occipital lobes in region of interest for cerebellum. Semiquantitative analysis 2 underestimates reduced metabolism bilaterally in occipital lobes (including visual cortices) and shows reduced metabolism in right frontal and left temporal lobes. SQ = semiquantitative. Color version of this figure is available as supplemental file at http://tech.snmjournals.org.
- FIGURE 3.
(A) Suboptimal PET image registration using template (semiquantitative analysis 2). Left posterior part of brain is not symmetric with right and therefore is not completely within region of interest (arrows), causing erroneous hypometabolism in this region. Suboptimal registration is also seen in temporal lobes and caudate heads (arrows). (B) Reformatted patient image with semiquantitative analysis 1. Hypometabolic regions in frontal and parietal lobes are better identified on color images, available as supplemental files at http://tech.snmjournals.org.
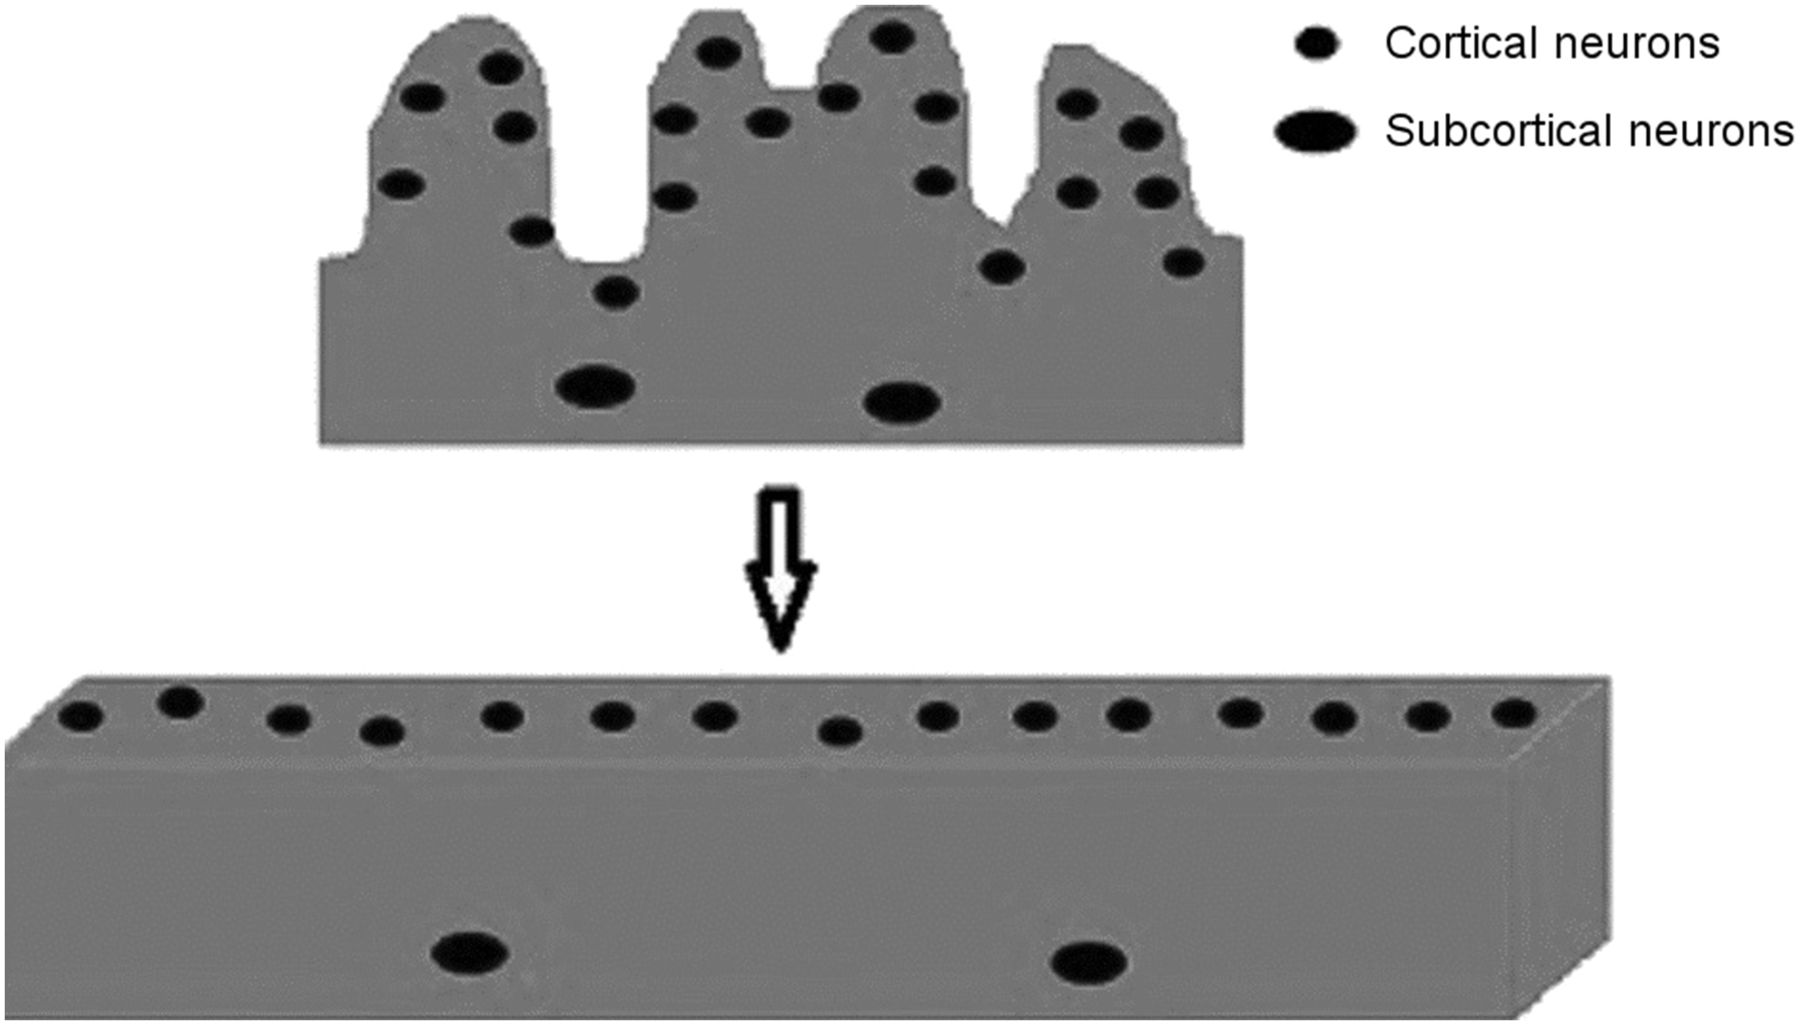
- FIGURE 4.
Basic diagrammatic illustration of opening of cerebral cortical gyri into flat area. Color version of this figure is available as supplemental file at http://tech.snmjournals.org.
- FIGURE 5.
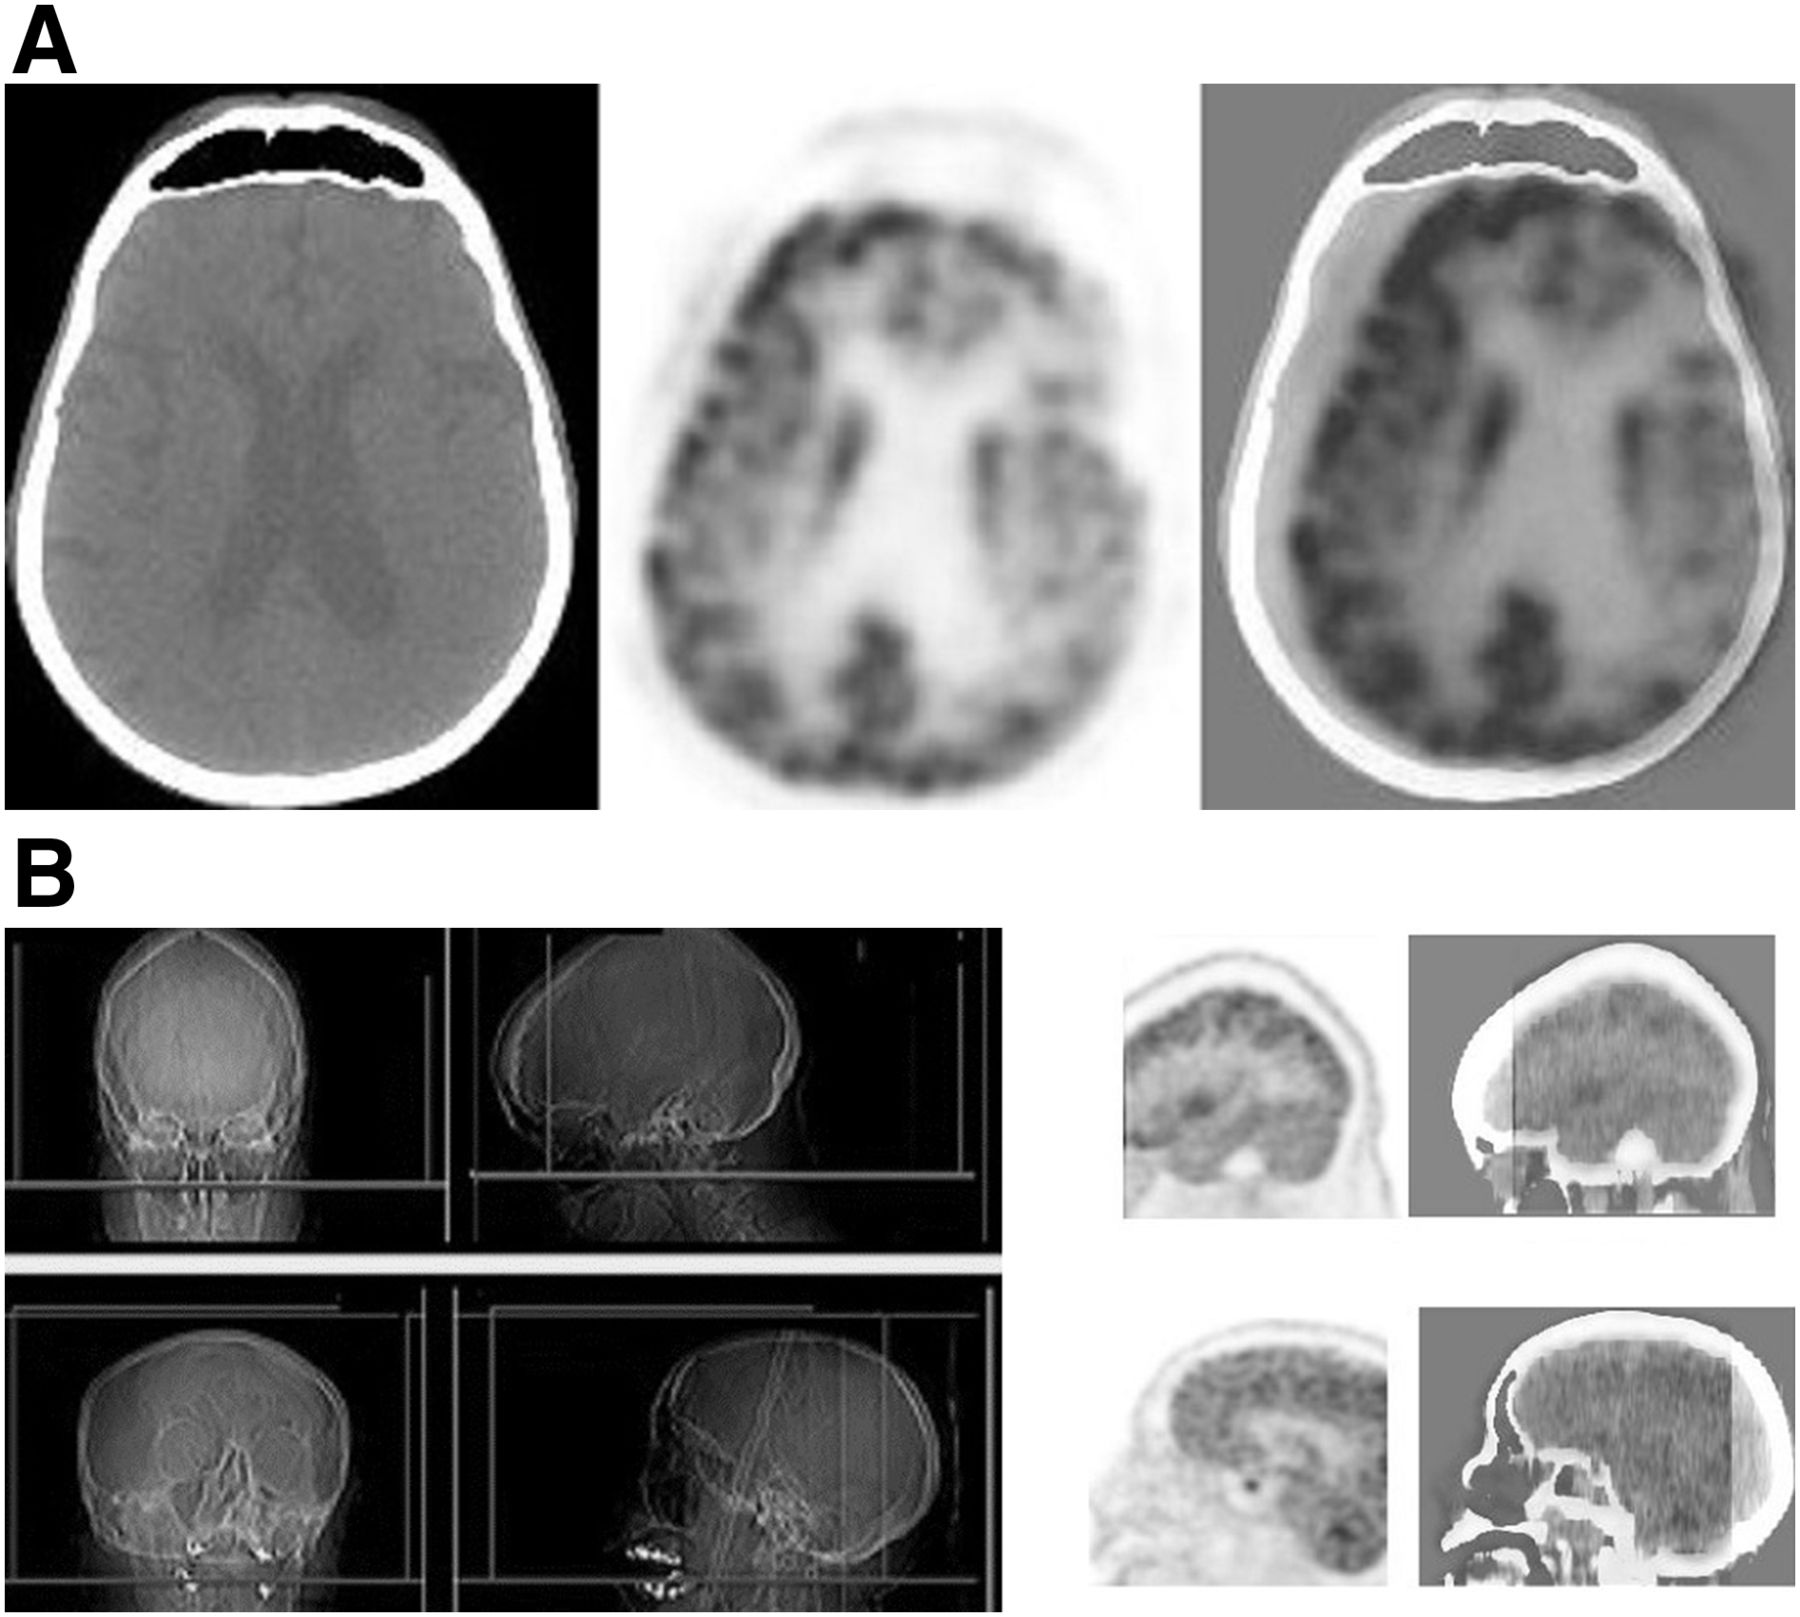
(A) Selected CT, 18F-FDG PET, and PET/CT images of brain. Significant motion artifact is causing artifactually reduced uptake in left hemicortex (CT attenuation correction artifact). It is important to review PET/CT images to better identify motion artifacts and not interpret them as reduced metabolism. (B) Anterior and lateral x-ray scout and PET/CT images of head in transaxial and sagittal views. Misplacement of region-of-interest box (green lines) on lateral scout x-ray images causes anterior part of brain not to be imaged in patient (top) and posterior part of brain not to imaged in another patient (bottom) during PET acquisition. Color version of this figure is available as supplemental file at http://tech.snmjournals.org.
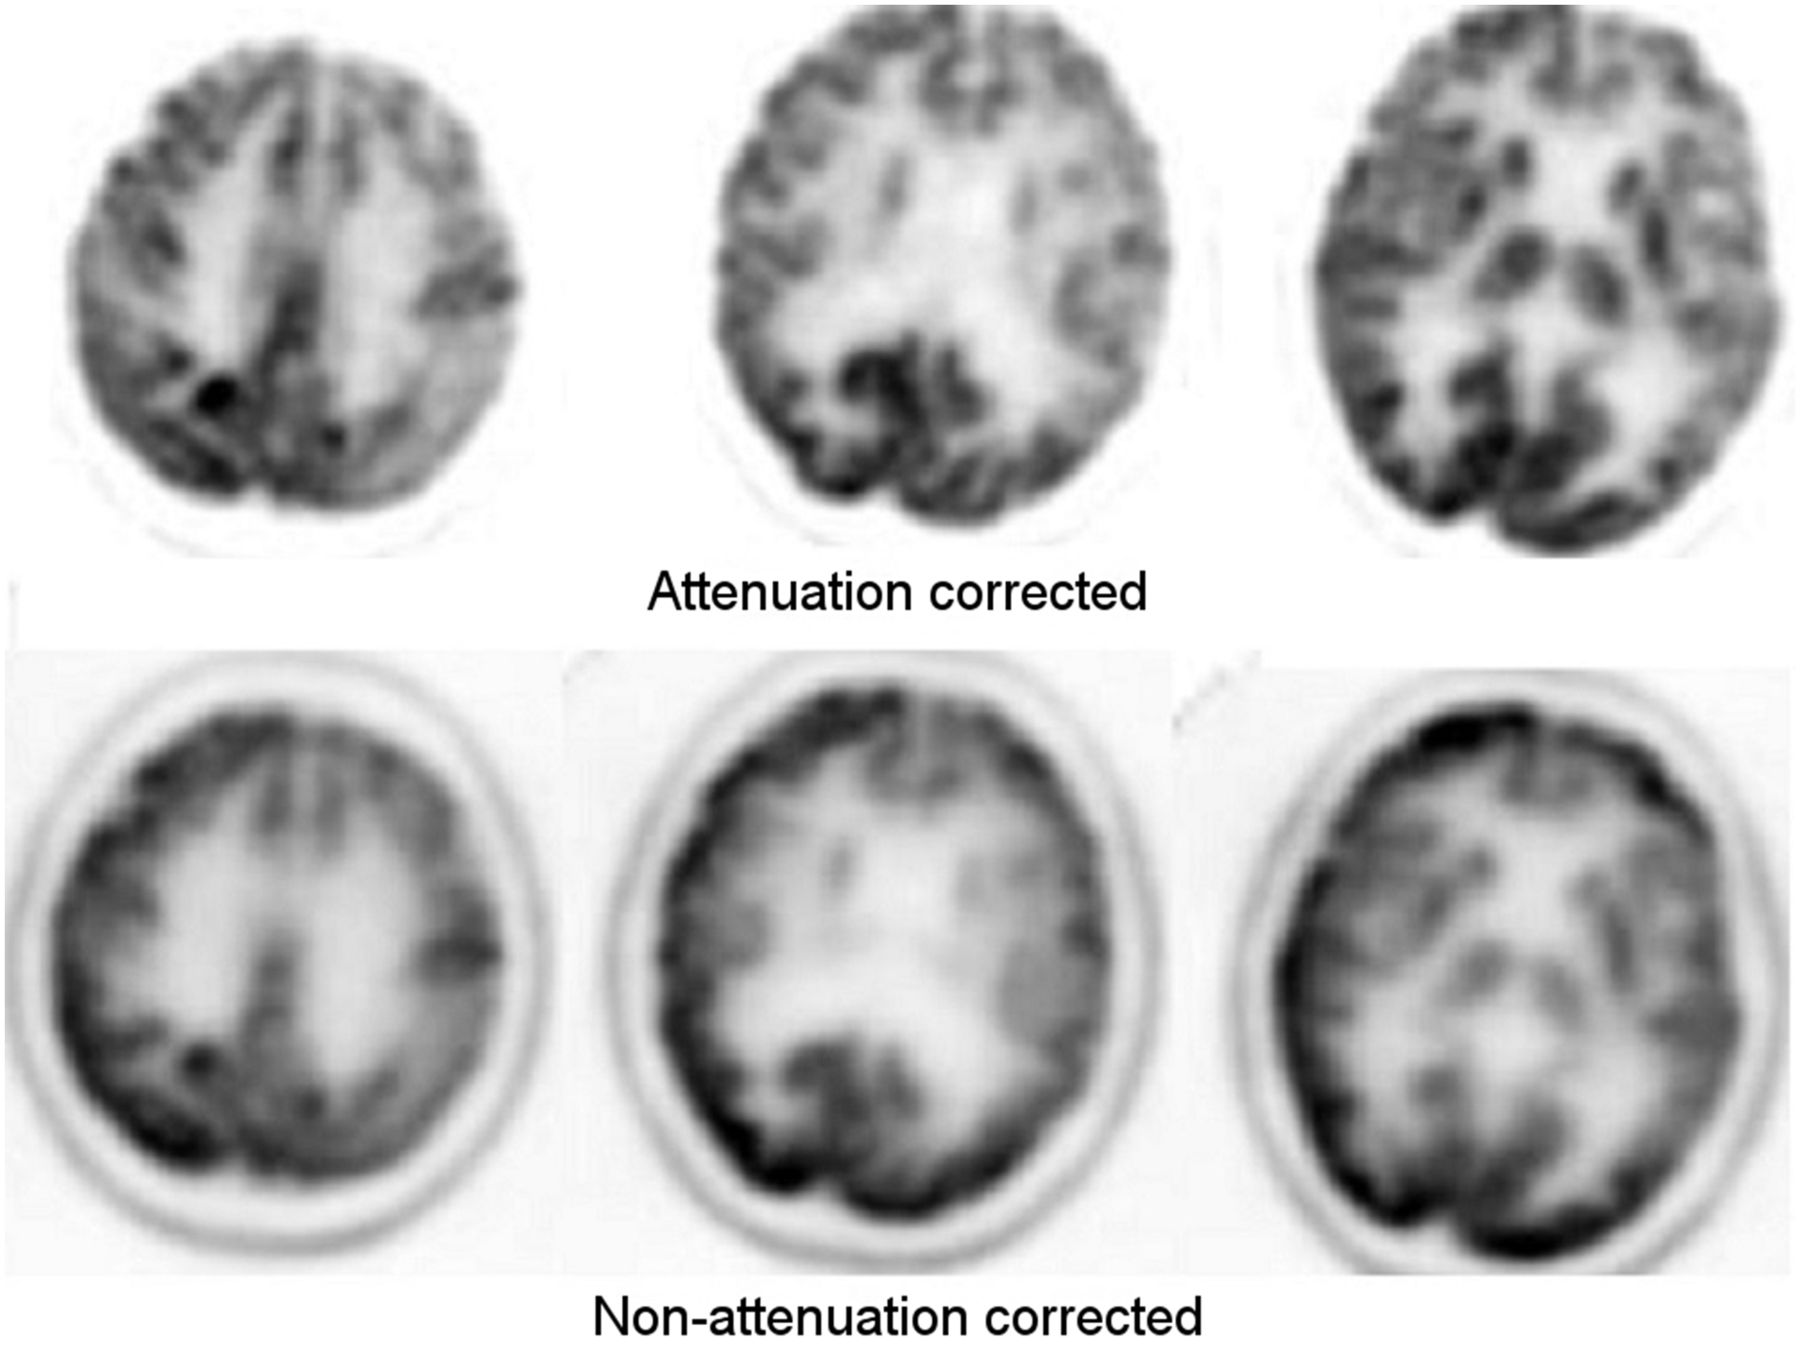
- FIGURE 6.
18F-FDG PET images of brain showing reduced metabolism in left frontal and parietal lobes on both attenuation-corrected and non–attenuation-corrected images. Mildly reduced metabolism in right frontal and parietal lobes seen on attenuation-corrected images is not as apparent on non–attenuation-corrected images. Basal ganglia appear less intense on non–attenuation-corrected images because of higher attenuation of photons coming from deep subcortical structures. Color version of this figure is available as supplemental file at http://tech.snmjournals.org.


Additional Files
Supplemental Data
Files in this Data Supplement:
Supplemental Data
Files in this Data Supplement:


