


Abstract
18F-FDG PET brain imaging is commonly used in the early detection and differential diagnosis of various subtypes of dementias. 18F-FDG PET images are mainly evaluated visually, and semiquantitative analysis programs are also commonly used in many centers. However, visual and semiquantitative analysis carry certain limitations. Visual assessment is subjective and dependent on expertise. Commercially available semiquantitative analysis programs have certain limitations such as suboptimal selection of brain areas or erroneous uptake normalization procedures that may provide inaccurate results, and physicians reporting semiquantitative results should be aware of these. In this pictorial review article, we will discuss the current status of 18F-FDG PET brain imaging in patients with dementia and present figures and semiquantitative analysis results of various subtypes of dementias as well as certain artifacts seen on 18F-FDG PET brain imaging studies.
Dementia is characterized by both memory loss and at least one other type of cognitive impairment, or decline in cognitive ability in memory and thinking skills. There are various subtypes of dementia, each of which has a different management, disease course, and outcome. Alzheimer disease (AD), the most common cause of dementia, is usually seen after the age of 65 y. AD is characterized by accumulation of the β-amyloid peptide (amyloid plaques) and neurofibrillary tangles of hyperphosphorylated tau protein within the brain. Mild cognitive impairment is an intermediate stage between normal age-related cognitive decline and dementia. Frontotemporal dementias (FTDs) arise from degeneration of the frontal and temporal lobes and are usually seen in patients younger than 65 y. In FTDs, a personality change and inappropriate social conduct, with early loss of insight and blunted emotional responses, are prominent features. Dementia syndromes associated with parkinsonism include diffuse Lewy body dementia (DLBD), Parkinson disease dementia, and Parkinson disease combined with other dementia syndromes (progressive supranuclear palsy and cortical basal ganglionic degeneration). Visual hallucinations and parkinsonism (bradykinesia in combination with rest tremor, rigidity, or both) are commonly seen in patients with DLBD.
Early diagnosis of dementias allows early and appropriate use of specific medications for symptomatic treatment. The basic approach for evaluating patients with cognitive dysfunction includes detailed history, physical and neurologic examination, cognitive testing, laboratory testing, specialty consultation, and routine brain imaging with CT or MRI to identify structural, demyelinating, inflammatory, or vascular etiologies (1). SPECT and PET imaging studies are used in selected difficult cases to improve diagnostic accuracy.
There are various SPECT and PET studies for dementia. The commonly performed studies in routine clinical practice are 99mTc-labeled brain perfusion radiotracers for SPECT imaging and 18F-FDG and 18F-labeled β-amyloid imaging radiotracers for PET imaging (2). Dopamine transporter scanning or SPECT is also available to confirm dementias with parkinsonism (3). 15O-water brain perfusion and 15O PET imaging studies are available only in limited centers (4). Recently, tau PET ligands have been developed (5).
18F-FDG PET BRAIN IMAGING IN DEMENTIA
18F-FDG PET/CT is commonly used in the early and differential diagnosis of subtypes of dementias (6,7). Subtypes of dementias usually show characteristic findings on 18F-FDG PET images (8–13). In AD, hypometabolism involves the parietal (lateral and medial/precuneus) and temporal lobes and the posterior cingulate cortices either unilaterally or bilaterally (Fig. 1). Hypometabolism may also involve the frontal lobes. There is usually preserved metabolism in the sensorimotor cortices, basal ganglia, occipital lobes, and cerebellum. In DLBD, hypometabolism involves the occipital (mainly primary visual cortex) lobes unilaterally or bilaterally (Fig. 2). Hypometabolism may also involve the parietal and temporal lobes. There is preserved metabolism in the posterior cingulate cortex (cingulate island sign) (13). In FTD, hypometabolism is seen unilaterally or bilaterally in the frontal (mainly medial and anterior, also lateral) and temporal (anterior) lobes, sometimes also involving the parietal lobes and subcortical structures. In multiinfarct dementia, there are focal areas of hypometabolism corresponding to areas of infarction in cerebral cortical and subcortical structures and the cerebellum. Diffusely reduced uptake in the hemicerebellum contralateral to a large area of infarction (crossed cerebellar diaschisis) may also be seen. In mild cognitive impairment, hypometabolism occurs mainly in the posterior cingulate cortex and hippocampus (area medial to temporal lobe).
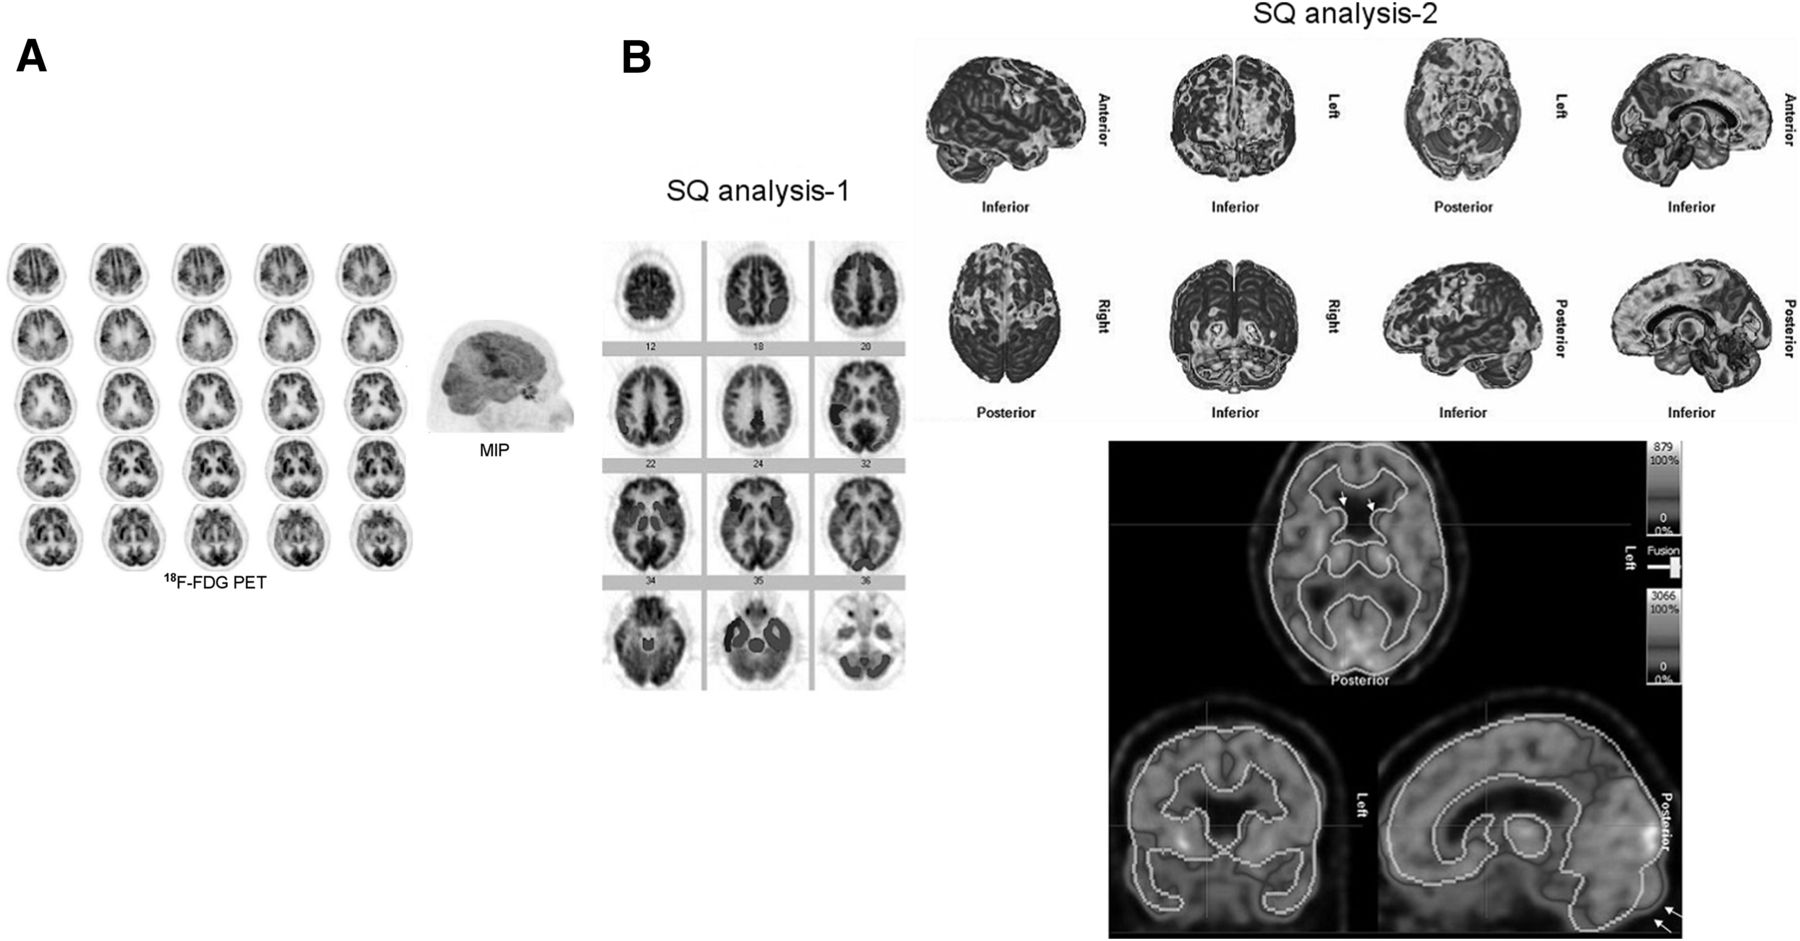
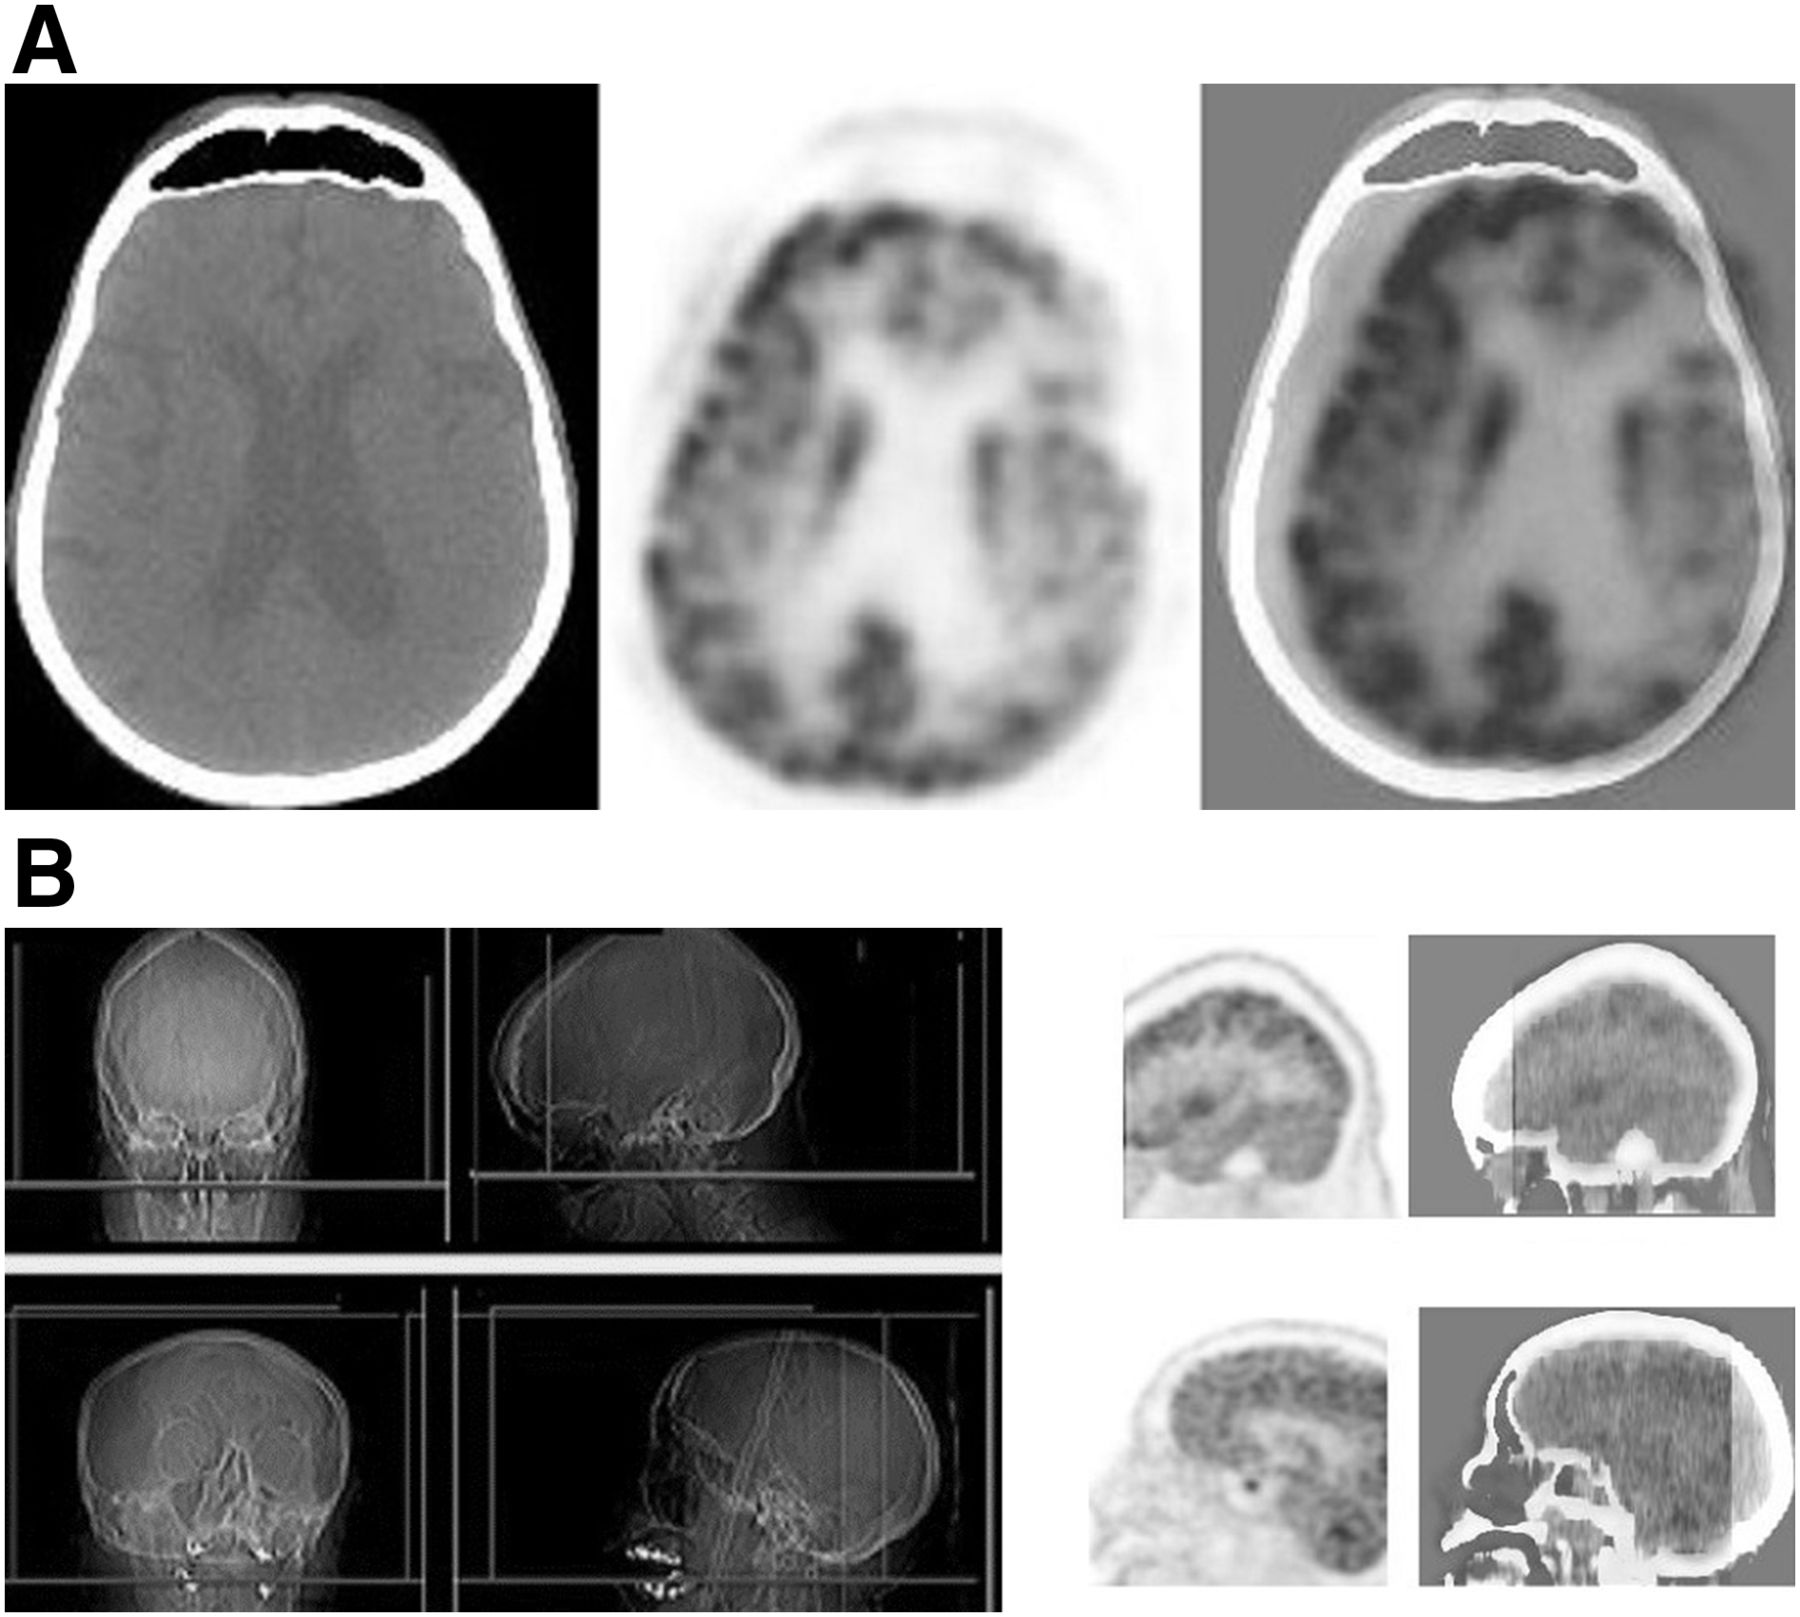
A 60-y-old woman with progressive cognitive decline. (A) 18F-FDG PET images show bilateral marked hypometabolism in parietal and temporal lobes and bilateral mild hypometabolism in frontal lobes. Preserved metabolism is seen bilaterally in motor cortices, occipital lobes, and basal ganglia. Findings are consistent with AD. PET maximum-intensity projection better locates cerebral cortical hypometabolic regions in 3-dimensional presentation. (B) Commercially available semiquantitative analysis program (semiquantitative analysis 1: NeuroQ; Syntermed Inc.) shows reduced metabolism bilaterally in frontal lobes, posterior cingulate cortices, temporoparietal junctions, temporal lobes (more on right); in right visual associative cortex; and very mildly in left basal ganglia (blue: normal metabolism; red, pink, and purple: hypometabolism [red > −3 SDs, pink > 2–3 SDs, and purple > 1–2 SDs]; color-coded images can be found as supplemental files online at http://jnmt.snmjournals.org). However, the program does not show bilaterally marked hypometabolism in parietal lobes (superior and inferior) and underestimates hypometabolism in left temporal lobe. Another commercially available semiquantitative analysis program (semiquantitative analysis 2: Hermes BRASS; Hermes Medical Solutions) provides results better matching visual analysis in cerebral cortex but not in basal ganglia (hypometabolism: SD > −2). This program shows suboptimal registration in various parts of brain, including caudate heads (arrows). MIP = maximum-intensity projection; SQ = semiquantitative.

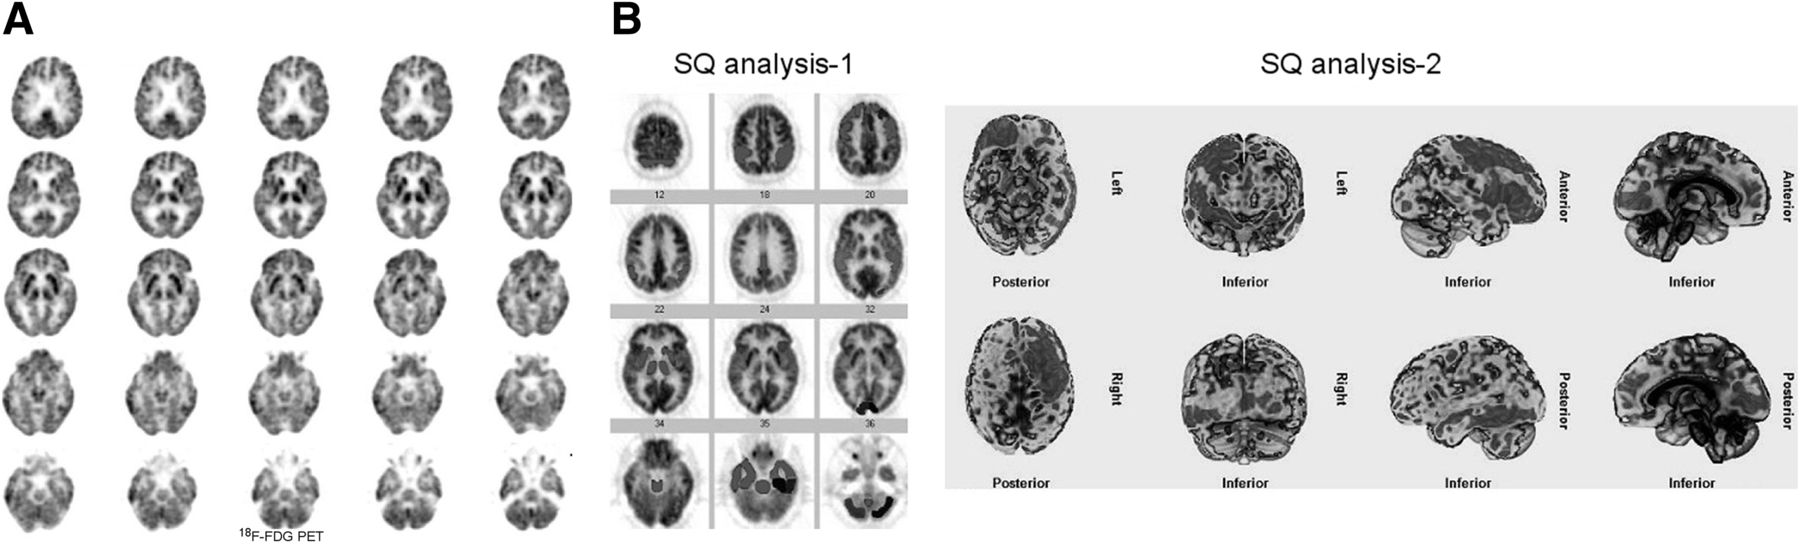
A 71-y-old woman who is clinically DLBD, with progressive dementia, visual hallucinations, and parkinsonian features. (A) 18F-FDG PET images demonstrate reduced glucose metabolism bilaterally in primary visual cortices (arrows) and a mild or questionable reduction in metabolism in left medial frontal region and left temporal lobe. Findings are consistent with DLBD. (B) Semiquantitative analysis 1 shows markedly reduced metabolism bilaterally in visual cortices, cerebellum, and left posterior temporal lobe and mildly reduced metabolism in left parietotemporal region, frontal lobe, and anterior cingulate cortex. Cerebellar uptake appears to be normal on visual analysis. This finding is likely due to suboptimal selection of cerebellum in semiquantitative analysis 1, possibly erroneously including occipital lobes in region of interest for cerebellum. Semiquantitative analysis 2 underestimates reduced metabolism bilaterally in occipital lobes (including visual cortices) and shows reduced metabolism in right frontal and left temporal lobes. SQ = semiquantitative. Color version of this figure is available as supplemental file at http://tech.snmjournals.org.
Expert visual reading of the 18F-FDG PET images resulted in 90% concordance with the clinical diagnosis in all subjects; specifically, this concordance was 93.4% for AD, 88.8% for FTD, and 66.6% for DLBD (7). A metaanalysis of 24 studies showed that 18F-FDG PET has 88% sensitivity and 84% specificity in the prediction of conversion to AD in patients with mild cognitive impairment (14).
18F-FDG PET brain images are assessed visually, and semiquantitative analysis programs are also available in many centers. Visual analysis is subjective and dependent on expertise (15). Accurate visual analysis requires a good knowledge of the normal distribution of 18F-FDG in various ages, the characteristic distribution of metabolic abnormalities in various subtypes of dementias, and normal brain anatomy, as well as recognition of abnormal findings on low-dose CT images and certain artifacts on PET/CT images. In addition to assessing metabolic activity in basic brain lobes and subcortical structures, it is also important to define the metabolic activity in different parts of a lobe and in other specific areas of the brain such as the anterior and posterior cingulate cortices, precuneus, hippocampus, and primary visual cortex, as is important for differential diagnosis of dementias. 18F-FDG brain PET images should be reviewed in both color and gray scale. Reviewing images in color display better shows hypometabolic regions than does gray scale. Maximum-intensity projections may help better locate abnormalities in the cerebral cortex in a 3-dimensional presentation (Fig. 1).
Various semiquantitative analysis programs have been developed over the years to detect mild abnormalities that are not apparent on visual inspection (15–21). Herholz et al. reported that automated analysis of 18F-FDG PET provided 93% sensitivity and specificity for detection of a mild to moderate probability of AD and 84% sensitivity and 93% specificity for detection of a very mild probability of AD (16). Lehman et al. reported that the diagnostic accuracy, specificity, and confidence of 18F-FDG PET interpretation improved with semiquantitative analysis for evaluation of mild cognitive impairment or AD (17). However, in routine assessment of 18F-FDG brain PET studies, semiquantitative analysis software carries certain limitations, which we wanted to address in this article.
There are various commercially available semiquantitative analysis programs. Some are voxel-based and some ROI-based. Some programs automatically select the brain areas using brain templates or atlases, and in other programs brain areas are selected manually. These programs determine whether there is a statistically significant difference between patient and reference values or between the right and left sides of the brain (asymmetry index). In the automatic selection of brain areas, global spatial normalization matches global spatial features of a patient’s brain (position, orientation, and dimensions) with a standard or brain atlas using various algorithms (22). The most commonly used brain template is the Talairach atlas (23). The brain has 52 Brodmann areas in each hemisphere, with each area having a unique function. A recent study using multimodal MR images delineated 180 areas per hemisphere bounded by sharp changes in cortical architecture, function, connectivity, or topography (24). These regions are of various sizes, and some are very small. Assessing metabolism in very small brain regions is difficult because of low camera resolution and high physiologic brain activity. Registration of a patient’s image with a brain template or atlas and automatic selection of areas via semiquantitative analysis programs are usually suboptimal because of the complexity of brain anatomy (differences in gyral and sulcal pattern), the various sizes and shapes of the brain, and the various positions of the head during image acquisition. Manual selection of areas without reference to the patient’s coregistered MR or CT images is also not easy. Suboptimal selection of brain areas causes inaccurate semiquantitative results, particularly when assessing uptake in small regions such as the basal ganglia, in regions close to each other on images such as right and left posterior cingulate cortices, in all or part of a lobe, and in specific areas such as a Broca area (Figs. 1 and 2). Figure 3 demonstrates suboptimal registration with semiquantitative analysis programs.

(A) Suboptimal PET image registration using template (semiquantitative analysis 2). Left posterior part of brain is not symmetric with right and therefore is not completely within region of interest (arrows), causing erroneous hypometabolism in this region. Suboptimal registration is also seen in temporal lobes and caudate heads (arrows). (B) Reformatted patient image with semiquantitative analysis 1. Hypometabolic regions in frontal and parietal lobes are better identified on color images, available as supplemental files at http://tech.snmjournals.org.
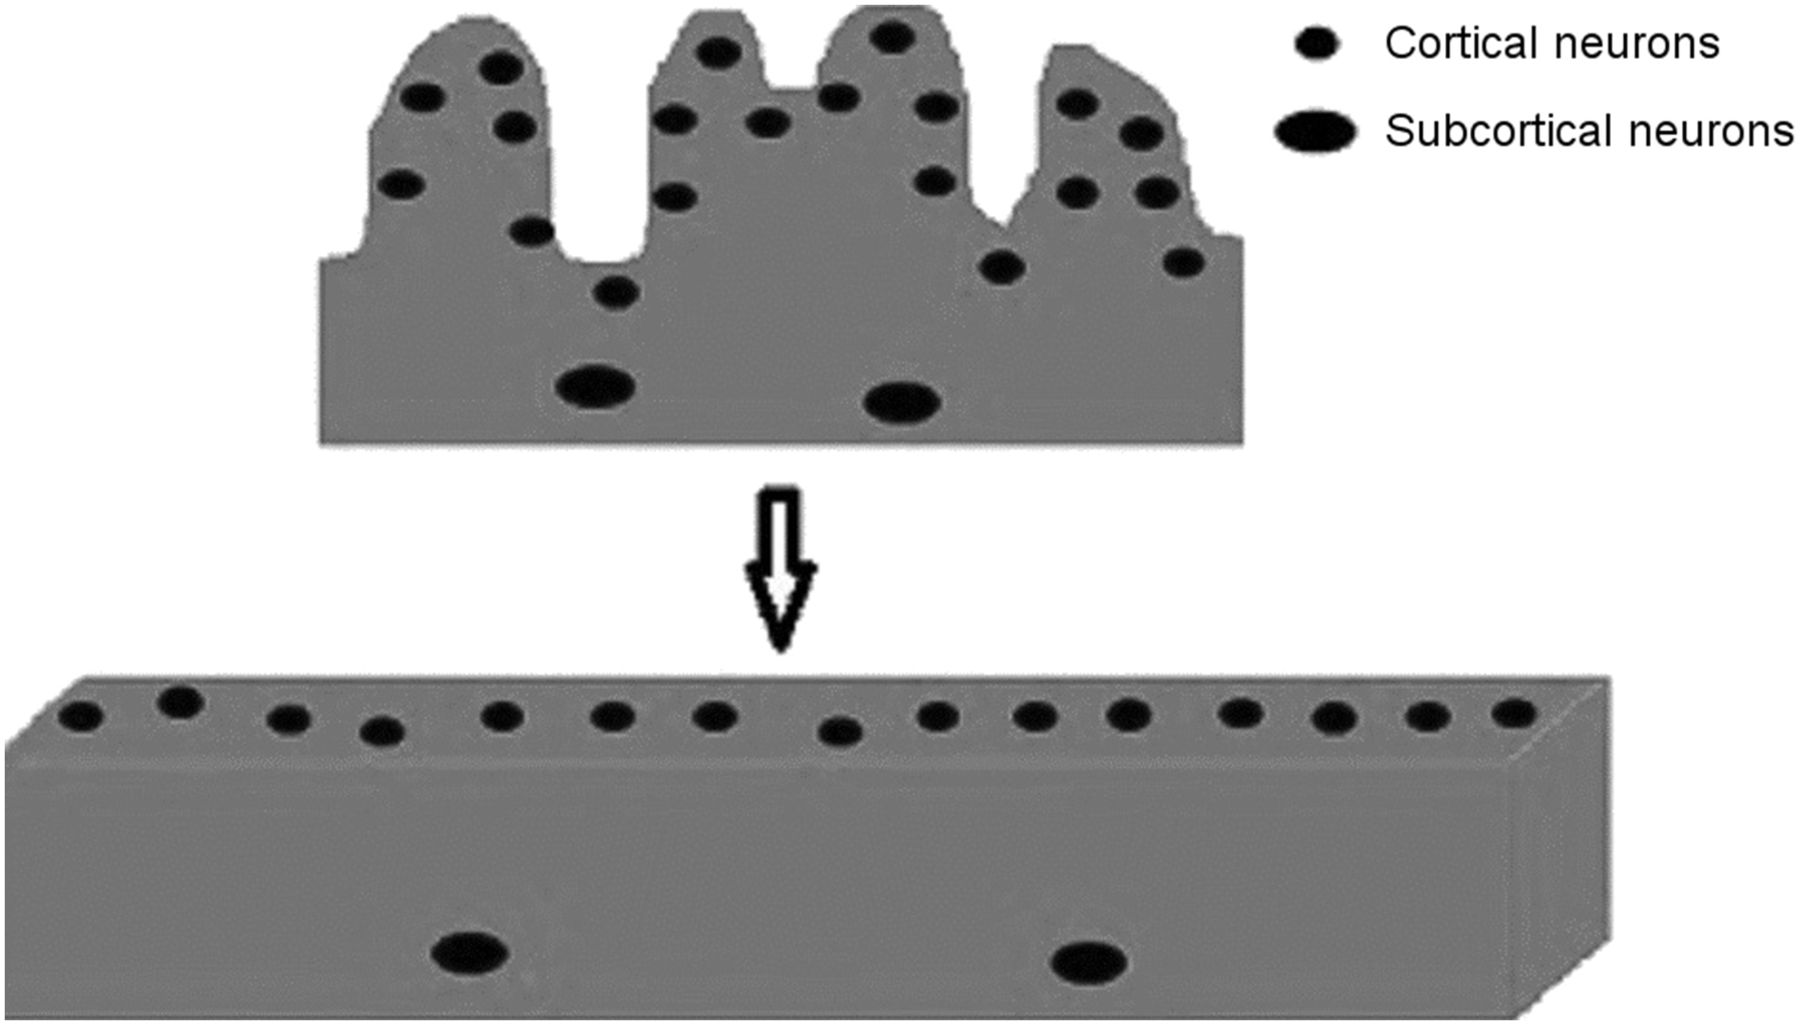
There is a need to develop new semiquantitative analysis programs that better locate brain areas and more accurately assess regional changes in glucose metabolism or perfusion. PET/MR images, fused either via image coregistration or a dedicated PET/MRI camera, can more accurately localize brain areas. A recent study demonstrated that PET quantitation accuracy using the MRI-based attenuation correction in a dedicated PET/MRI camera is reliable in a clinical setting and is similar to that obtained using a PET/CT camera (25). Manual selection of brain areas on PET with the help of a patient’s MR images can provide more accurate semiquantitative results than does automated selection of areas. Manual selection also requires knowledge of normal MRI anatomy or assessment of images with the help of an MRI specialist. Perhaps developing a software program to open up brain gyri into a large, flat area and parceling this area into specific brain areas (brain map) may help better locate areas in the brain (Fig. 4). It is also important to compare brain PET images with age-matched controls. In some semiquantitative analysis programs, the control age range is suboptimally wide and includes young people. Also, the number of healthy control individuals—usually around 30–50—in these semiquantitative analysis programs should be higher to provide more accurate reference values for comparison with the patients. Reference values may also show differences between women and men and among races.

Basic diagrammatic illustration of opening of cerebral cortical gyri into flat area. Color version of this figure is available as supplemental file at http://tech.snmjournals.org.
Semiquantitative analysis programs also use normalization of brain 18F-FDG uptake, with images being normalized to whole-brain activity or a reference region such as the cerebellum. In patients with significant reductions in metabolic activity in the whole brain or in a reference region, uptake normalization can generate erroneous results.
SUV can also be used to compare metabolic activity in brain regions (26,27). Yamaji et al. reported that patients with moderate AD had a significantly decreased cerebral metabolic rate of glucose in the temporal, frontal, occipital, parietal, and sensorimotor cortices and a significantly decreased SUV in the temporal, frontal, occipital, and parietal cortices (26). However, compared with healthy persons, patients with mild AD showed a significantly decreased cerebral metabolic rate of glucose in the temporal, frontal, and parietal cortices, but there was no significantly decreased SUV in any region in the same study. Ohyama et al. suggested that an SUV threshold of 5 in the parietal lobe in 18F-FDG PET studies could discriminate patients with AD from healthy subjects with a sensitivity of 86% and a specificity of 90% (27). SUV is affected by many factors, including technical errors or biologic or physical factors such as extravasation of radiotracer, blood glucose level, and scan acquisition parameters (28).
For accurate results, PET images should be obtained under optimal conditions, with appropriate patient preparation, adequate radiotracer dose, and correct injection and imaging techniques (29). The blood sugar level should be below 150 mg/dL at the time of 18F-FDG injection. When hyperglycemia is present, high circulating insulin levels drive 18F-FDG into muscle and results in globally reduced uptake in the brain in cortical and subcortical structures. The scalp-to-brain uptake ratio may help determine whether globally reduced uptake in the brain is due to technical or noncerebral reasons. Injection of a small dose of activity, extravasation of activity, or the presence of large, markedly hypermetabolic lesions in the other parts of the body, taking up most of the activity, can cause reduced uptake in both the scalp and the brain, whereas cerebral pathologic states such as brain atrophy due to normal aging can cause reduced uptake in most of the cerebral structures but not in scalp.
Physicians interpreting the images should be aware of certain artifacts (Fig. 5). Major artifacts are easy to recognize, but mild motion causing a slight right–left shift should not be mistaken as a unilateral decrease in activity. PET/CT images better show motion artifacts by demonstrating misregistration between the PET and CT images. Patient motion during the PET acquisition or between the PET and CT acquisitions will create artifacts on attenuation-corrected PET images. Reviewing non–attenuation-corrected images may help when repeat imaging is not possible. Non–attenuation-corrected PET images can grossly assess the cerebral metabolic activity (Fig. 6). If the motion was during the PET acquisition, a repeat image should be obtained.

(A) Selected CT, 18F-FDG PET, and PET/CT images of brain. Significant motion artifact is causing artifactually reduced uptake in left hemicortex (CT attenuation correction artifact). It is important to review PET/CT images to better identify motion artifacts and not interpret them as reduced metabolism. (B) Anterior and lateral x-ray scout and PET/CT images of head in transaxial and sagittal views. Misplacement of region-of-interest box (green lines) on lateral scout x-ray images causes anterior part of brain not to be imaged in patient (top) and posterior part of brain not to imaged in another patient (bottom) during PET acquisition. Color version of this figure is available as supplemental file at http://tech.snmjournals.org.
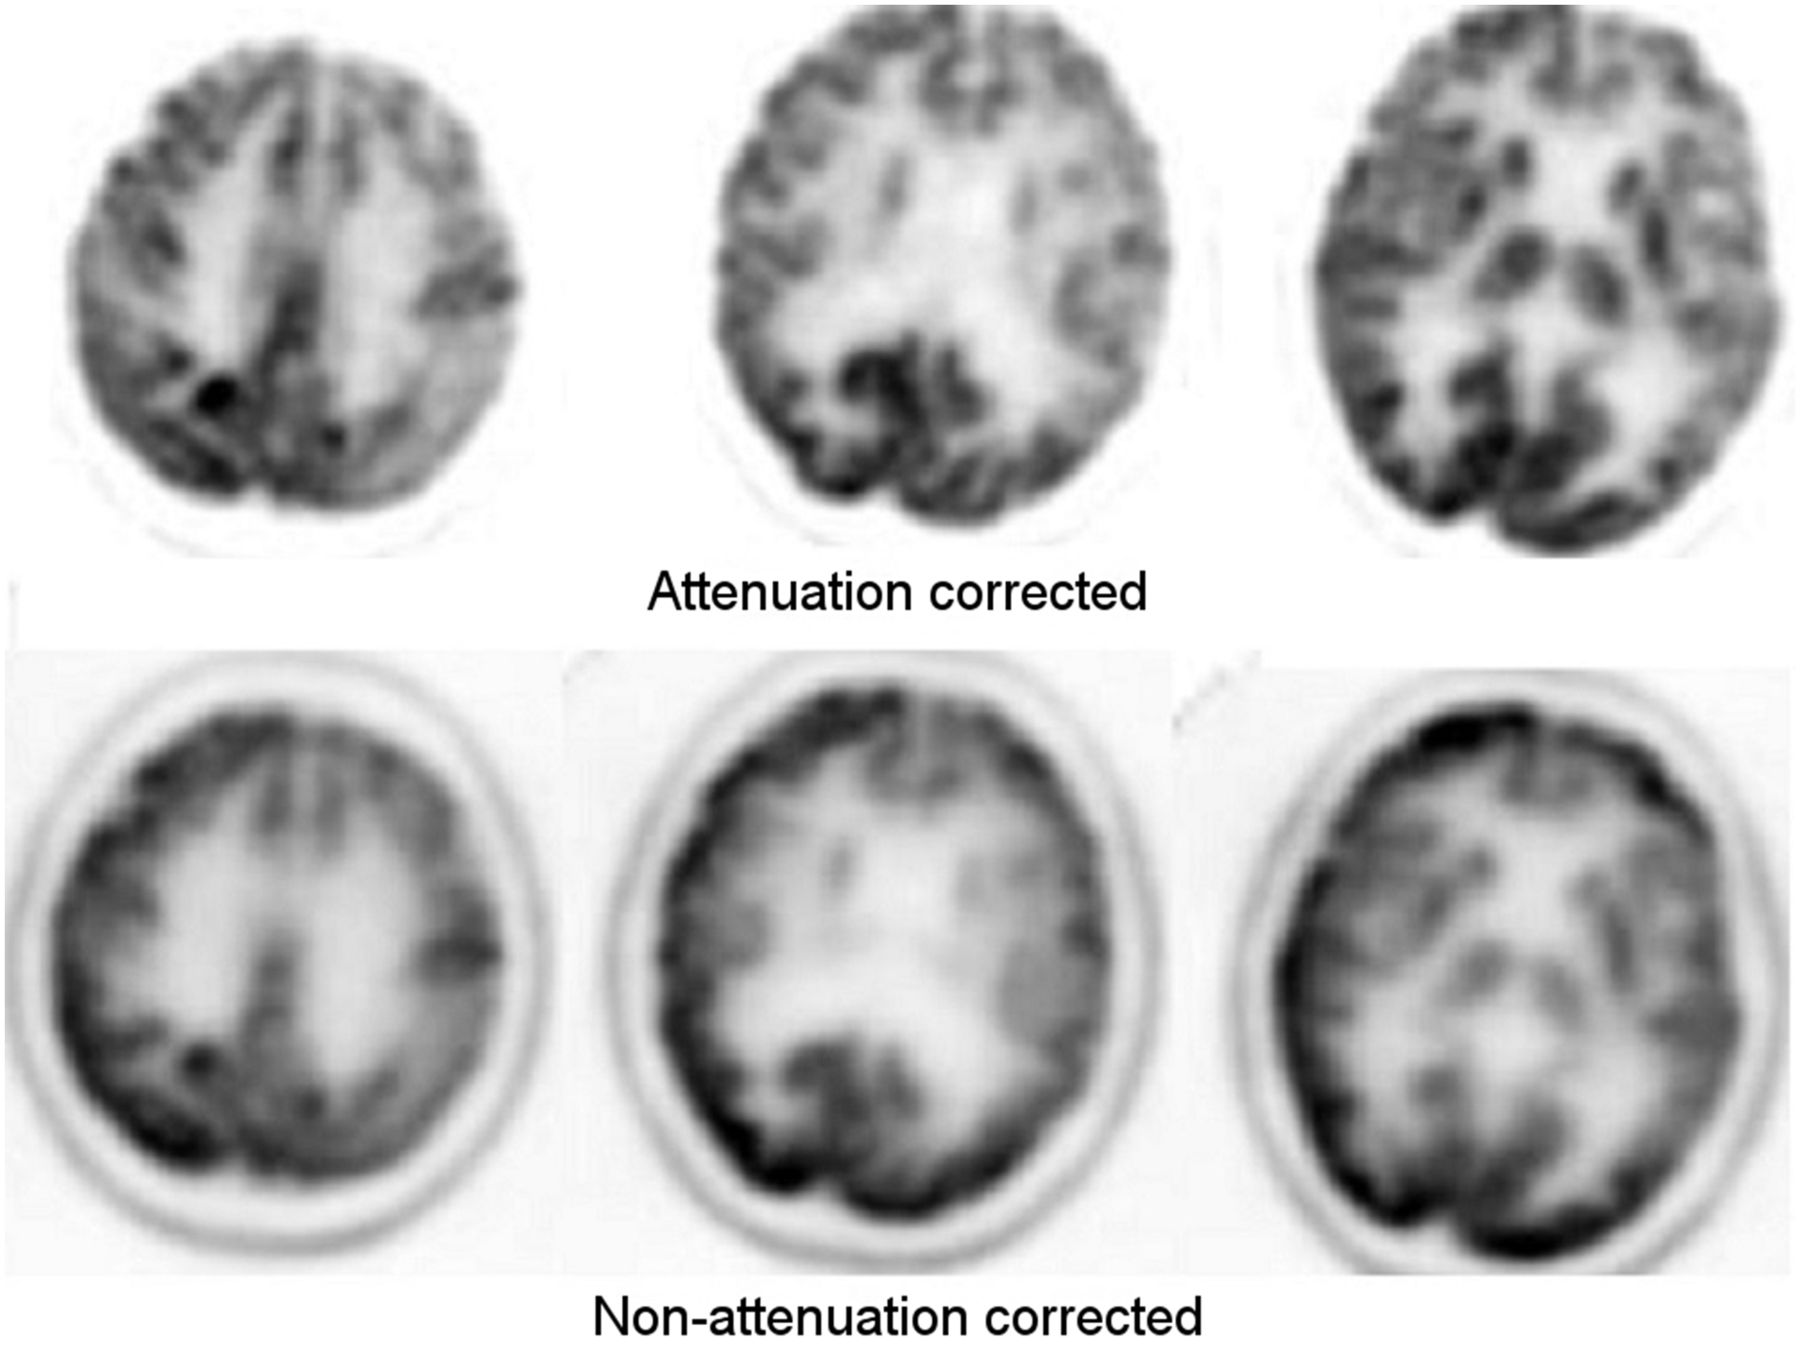
18F-FDG PET images of brain showing reduced metabolism in left frontal and parietal lobes on both attenuation-corrected and non–attenuation-corrected images. Mildly reduced metabolism in right frontal and parietal lobes seen on attenuation-corrected images is not as apparent on non–attenuation-corrected images. Basal ganglia appear less intense on non–attenuation-corrected images because of higher attenuation of photons coming from deep subcortical structures. Color version of this figure is available as supplemental file at http://tech.snmjournals.org.
Reviewing the low-dose CT scans of PET/CT studies may help with identifying infarcts, masses, or cystic lesions, which can also cause reduced 18F-FDG uptake. Radiologic correlation with diagnostic CT or MR images of the brain helps in more accurately interpreting 18F-FDG findings.
Absolute quantification of the cerebral metabolic rate of glucose is also possible and requires dynamic 18F-FDG PET imaging and obtaining arterial blood sampling at multiple time points (30). However, this technique is time-consuming, requires help from expert physicists, and is not practical for routine clinical studies. 18F-FDG uptake as percentage injected dose per gram or cubic centimeter of brain can also be calculated using a formula (31).
Although each subtype of dementia presents a characteristic regional metabolic abnormality, the various subtypes may also resemble one another on 18F-FDG PET images. The other nuclear medicine studies can help to differentiate subtypes of dementia in difficult cases. For example, dopamine transporter scanning can help in differentiating AD from DLBD and other dementias with parkinsonism, and amyloid PET imaging can help in differentiating AD from FTD (32,33). In DLBD and other dementias with parkinsonism, dopamine transporter scanning shows unilateral or bilateral reduced uptake in the corpus striatum. Extrapyramidal symptoms are also observed in FTD, and reduced dopamine transporter binding has also been reported (34). Amyloid PET is positive in AD but usually negative in FTD (35).
CONCLUSION
18F-FDG PET brain imaging is useful in patients with dementia and requires careful assessment of images. Currently, visual analysis of images provides more accurate results than semiquantitative analysis. However, visual analysis is subjective, requires expertise, and has limited value for detecting mild changes in the brain. Current semiquantitative analysis programs have certain limitations, particularly suboptimal localization of brain areas and normalization of activity. Semiquantitative analysis programs can detect mild changes in the lobes of the brain but are limited in small areas or areas close to each other because of suboptimal selection of brain areas. Developing more efficient quantitative analysis programs is important for early and differential diagnosis of dementias.
DISCLOSURE
No potential conflict of interest relevant to this article was reported.
Footnotes
Published online Aug. 3, 2018.
REFERENCES
- Received for publication February 26, 2018.
- Accepted for publication May 7, 2018.


