


Article Figures & Data
Figures
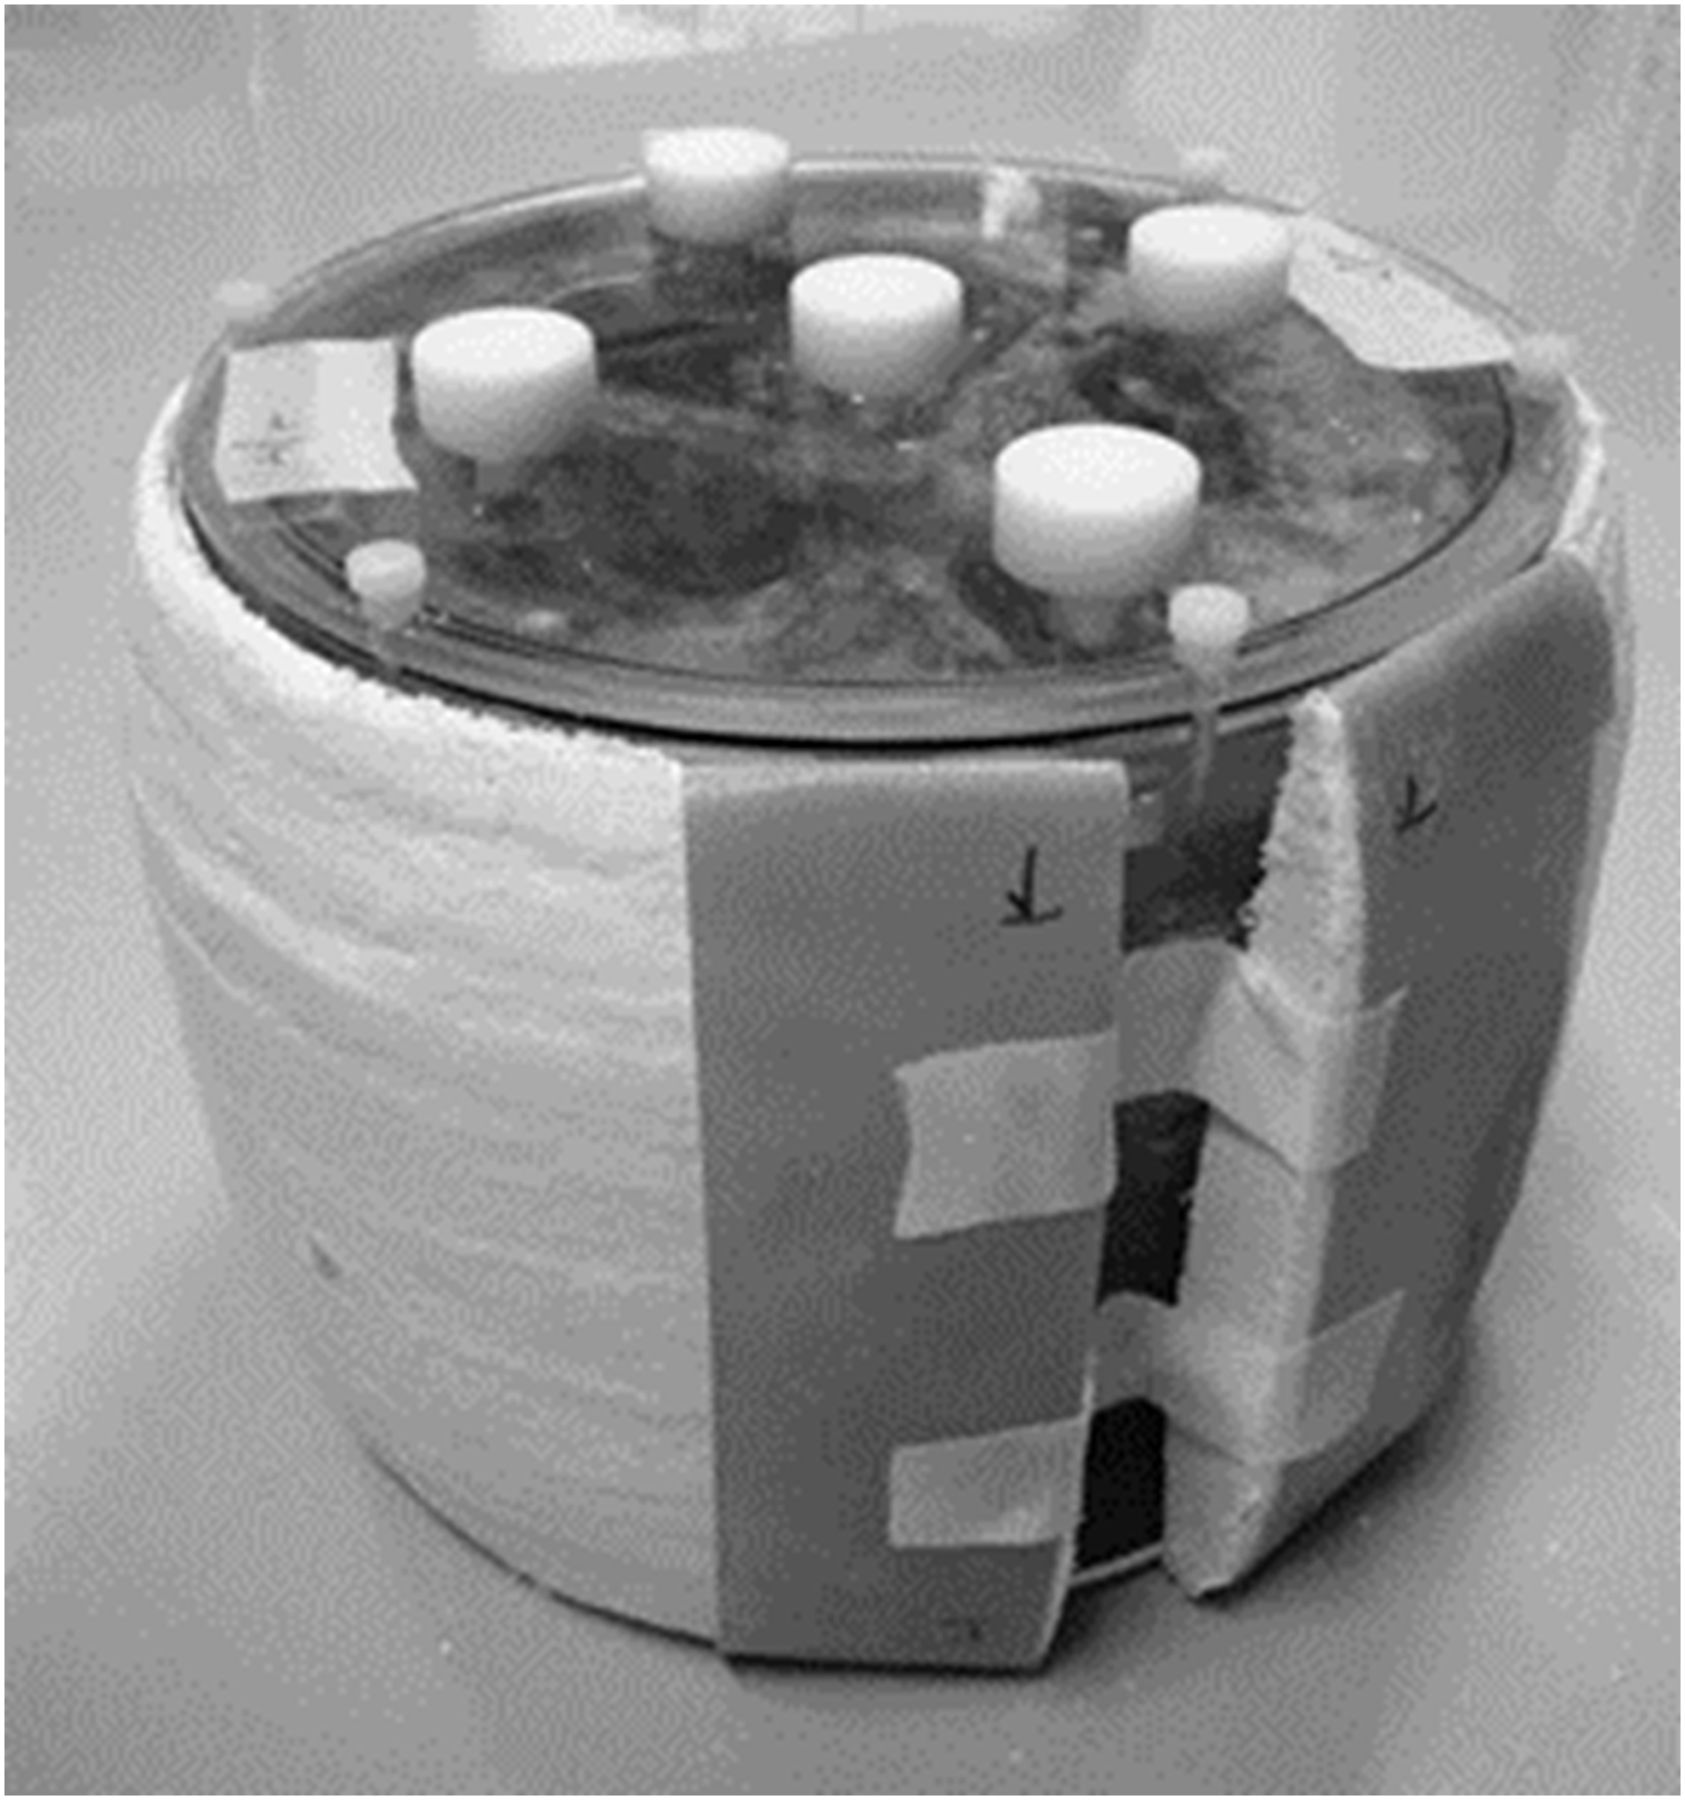
- FIGURE 1.
Hoffman 3-dimensional brain phantom simulated a skull after burr-hole surgery. Phantom was covered with calcium sulfate (thickness, ∼18 cm) to simulate cranium. Three phantoms with abnormal skull structures simulated frontal, occipital, and right temporal bone defects (defect width, ∼2 cm).
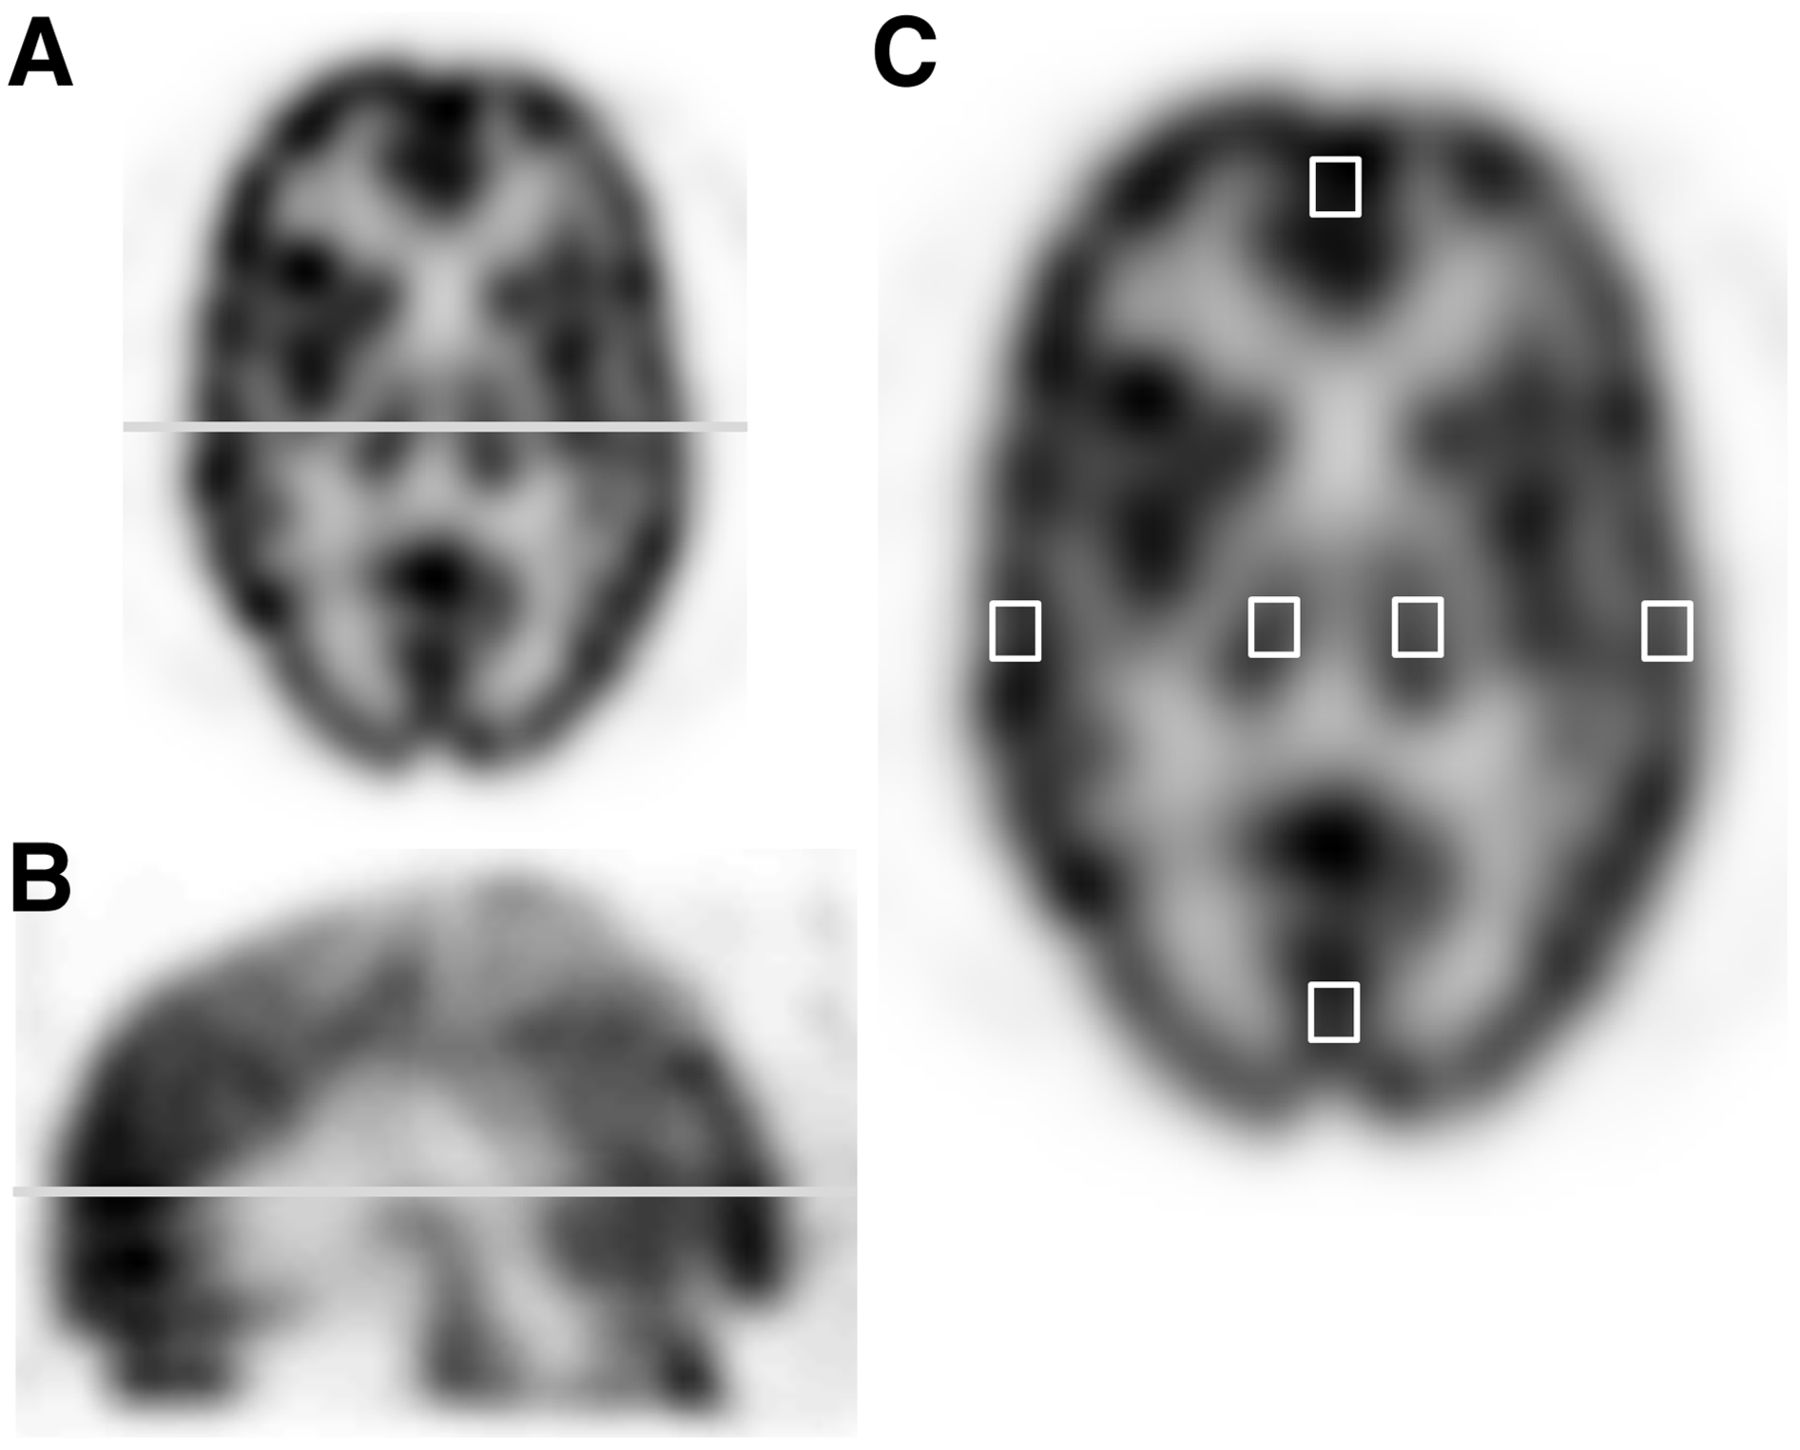
- FIGURE 2.
Illustration of brain image setting profile curve line and region of interest. Count profile curve was set on straight line passing between defect and contralateral normal bone: left and right temporal lobe line including thalamus with transversal image (A) and frontal and occipital lobe line with sagittal image (B). (C) Regions of interest set on thalamus and frontal, occipital, right, and left temporal lobes to calculate count ratio.
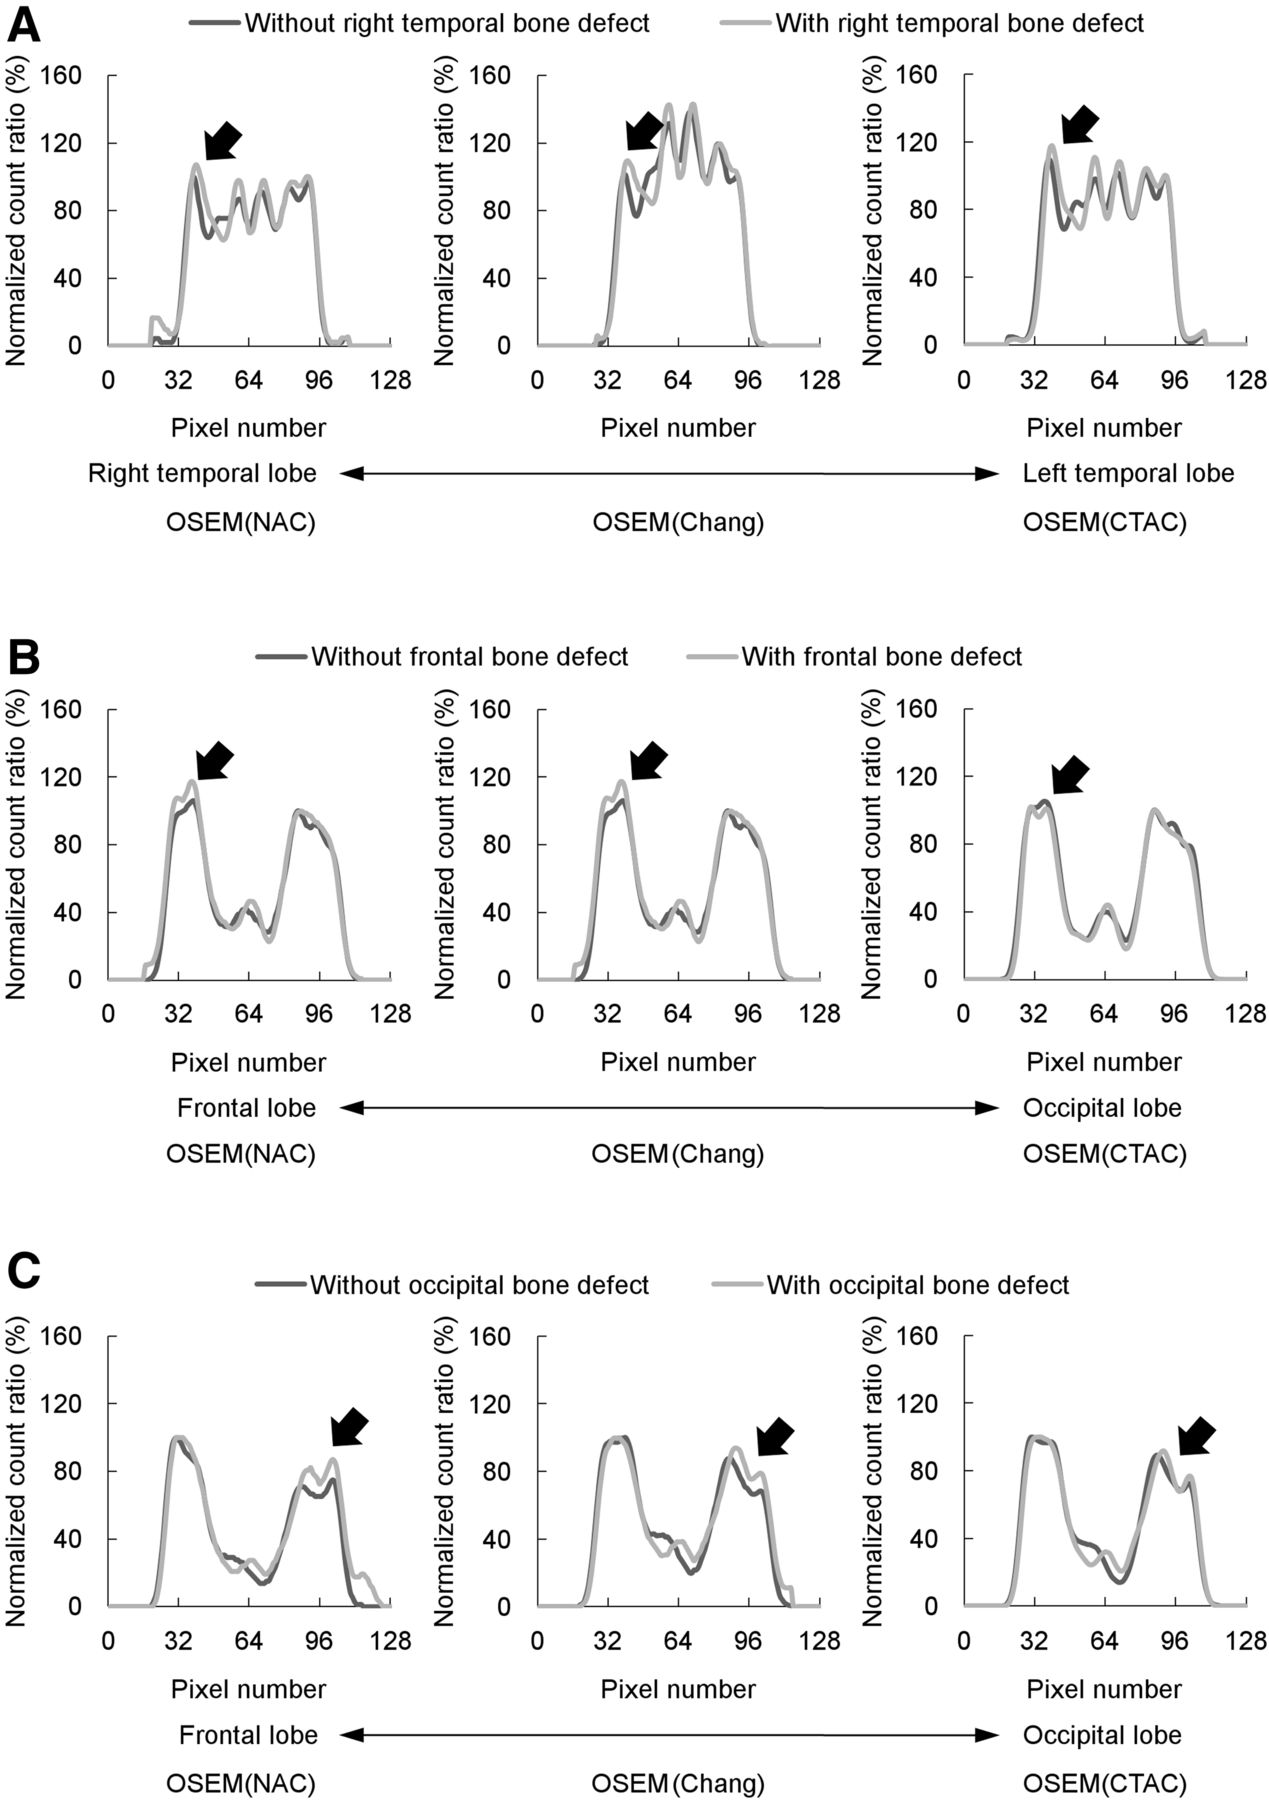
- FIGURE 3.
Comparison of a profile curve with and without a bone defect. These graphics show profile curves of brain lobes with and without bone defects of right temporal (A), frontal (B), and occipital (C) bones. Lower pixel number indicates right temporal (A) and frontal lobes (B and C), whereas higher pixel number indicates left temporal (A) and occipital lobes (B and C). Furthermore, graphics on left, middle, and right show OSEM (NAC), OSEM (Chang), and OSEM (CTAC), respectively. Black arrows show part with and without bone defects.
- FIGURE 4.
Comparison with thalamus–to–temporal lobe ratio with and without bone among 3 methods. Graphics on left, middle, and right show OSEM (NAC), OSEM (Chang), and OSEM (CTAC), respectively.
- FIGURE 5.
Comparison of count ratios of brain lobes with and without a bone defect. Graphics show right–to–left temporal lobe ratio (A), frontal–to–occipital lobe ratio (B), and occipital–to–frontal lobe ratio (C) with and without bone defect. Furthermore, graphics on left, middle, and right show OSEM (NAC), OSEM (Chang), and OSEM (CTAC) corrected values, respectively.
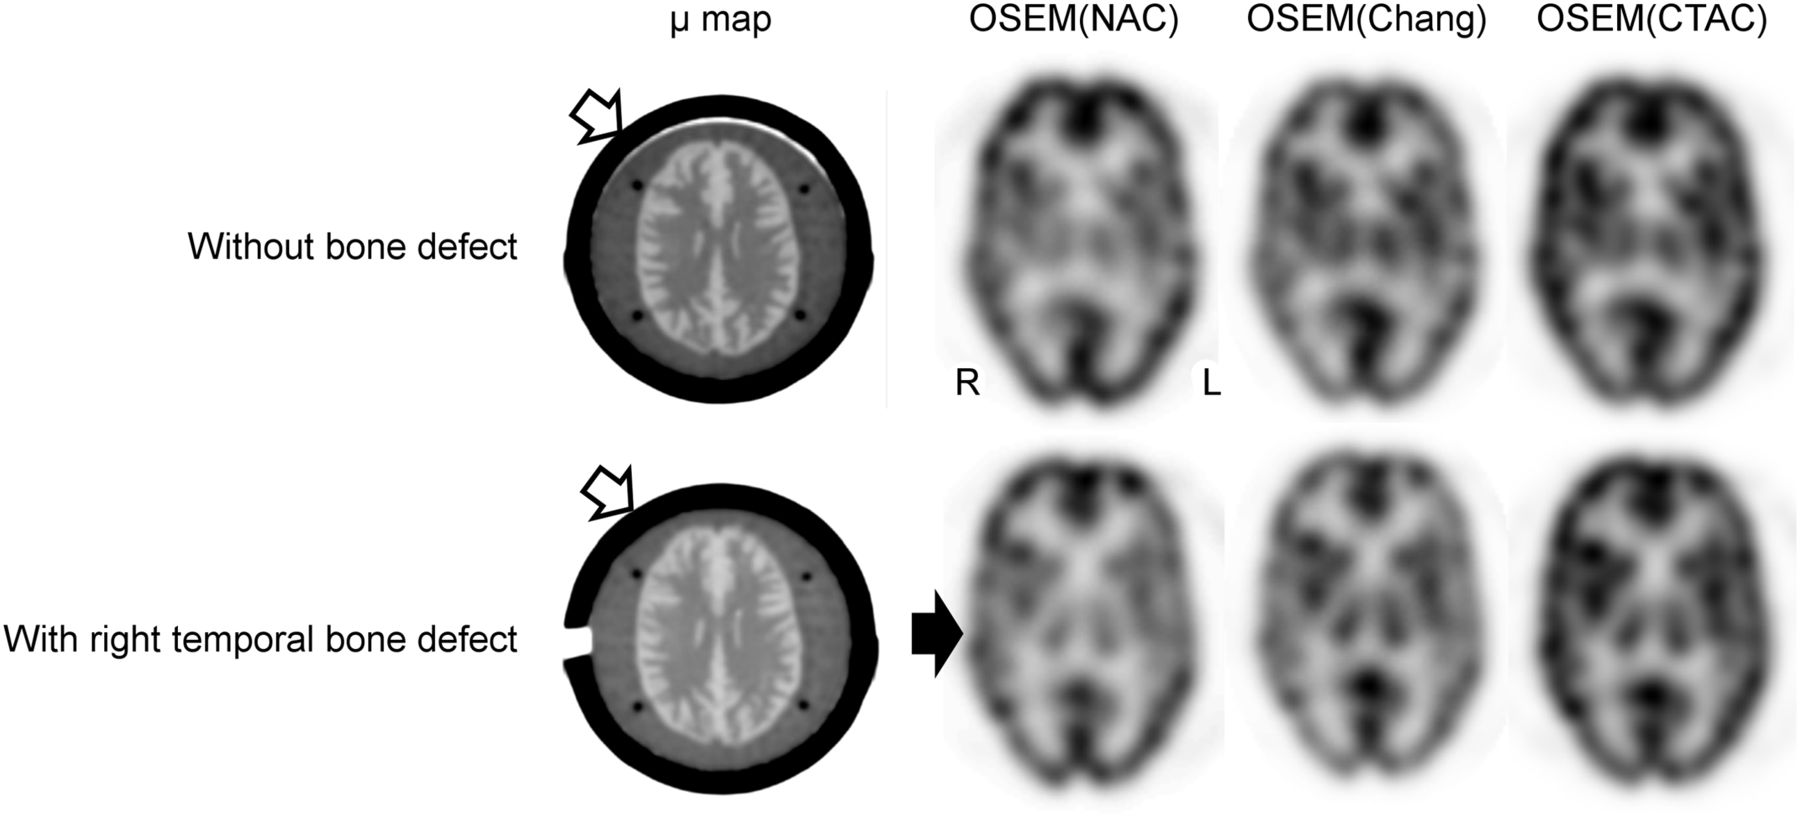
- FIGURE 6.
SPECT images obtained by the 3 methods, and μ-map image with and without a bone defect. Upper and lower images show brain perfusion images without bone defect and with right temporal bone defect. Black and white arrows indicate bone defect area and simulated bone.
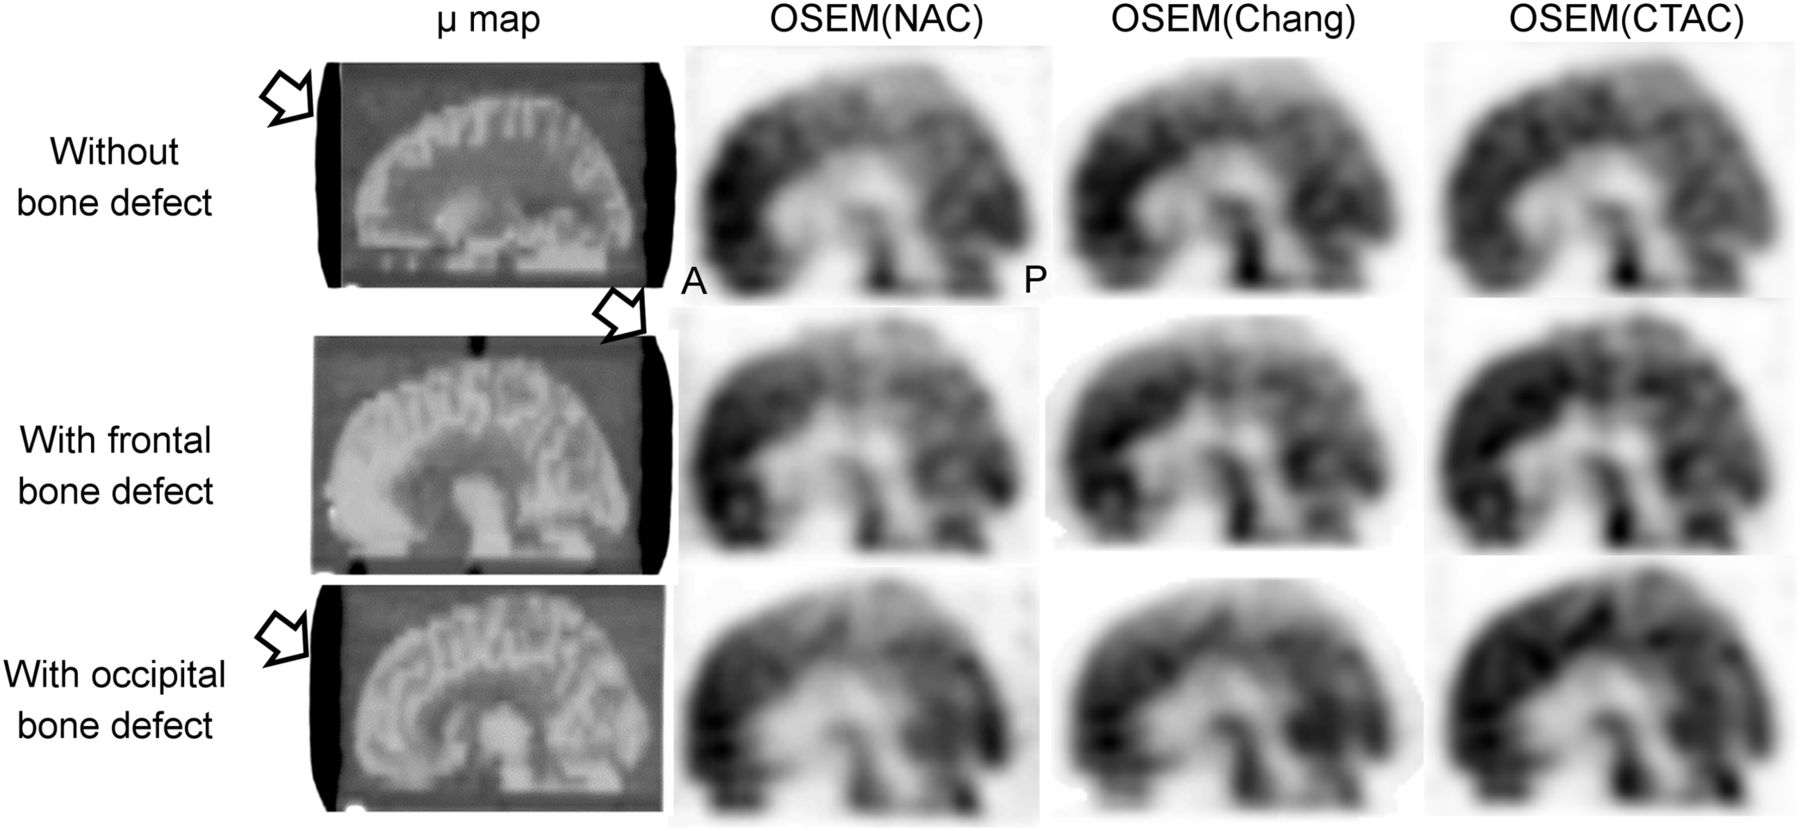
- FIGURE 7.
Sagittal SPECT images obtained by the 3 methods, and μ-map image with and without bone defect. Upper, middle, and lower images show brain perfusion images without bone defect, with frontal bone defect, and with occipital bone defect, respectively. Frontal and occipital bone defects are located in entire area of indicated sagittal slice (white arrow).


Jump to section
Related Articles
Cited By...
- No citing articles found.