


Abstract
Attenuation artifacts reduce our ability to evaluate perfusion of affected myocardial segments. The aim of this study was to evaluate the impact of routine prone-position image evaluation within a stepwise visual interpretation of myocardial perfusion studies. Methods: We have included 279 consecutive patients who were referred for evaluation of myocardial ischemia. All patients underwent routine electrocardiogram-gated supine SPECT imaging and non–electrocardiogram-gated prone-position SPECT imaging. Three nuclear medicine physicians interpreted the images in the following order: polar maps, supine images, raw images, motion-frozen gated images, and prone images, using a scale of 0–4. Segments with perfusion abnormalities were noted. Results: All physicians reported lower proportions of equivocal evaluations after evaluating prone images (18.3% vs. 4.7%, 19% vs. 11.1%, and 12.2% vs. 6.1%, P < 0.0001, P = 0.0077, and P = 0.0125, respectively). At the prone stage, normalcy rates were 89%, 87%, and 91%. Two physicians had significantly increased normalcy rates at the prone stage (72%–89%, P = 0.039, and 66%–87%, P = 0.006). At the prone stage, a decision reversal to normal or probably normal was observed in 40% (29/72), 33% (17/51), and 43% (21/48). In men, apical, mid, and basal inferior walls and in women apical and mid parts of anterior walls were more likely to be attributed to attenuation. The 2 steps that increased normalcy rates for interpreters were the review of raw images and of prone images. Conclusion: Routine prone imaging increases interpretive certainty and interobserver agreement and changes the final evaluation in a substantial number of patients and significantly decreases the number of equivocal evaluations.
By creating relatively photon-deficient areas, attenuation may reduce a physician’s ability to differentiate a true hypoperfusion from attenuation in myocardial perfusion imaging (MPI). There are several methods to overcome the difficulty in evaluation of attenuation abnormalities. The first method is attenuation correction (AC) (1), with approaches in both hardware (using transmission images) (2) and in software (3). AC has been associated with increased accuracy, usually increasing specificity (4,5), but requires attention to details such as misalignment (6,7). More important, AC requires dedicated hardware with significant costs, and still most γ-cameras in use do not have integrated AC capability.
Without dedicated AC hardware, the available methods are evaluating rotating planar images (cine raw), acquiring electrocardiogram (ECG)-gated SPECT (8), and having an alternative image aiming to alter the attenuating pattern. The most common alternate image position is prone, and the acquisition of images in the prone as well as supine positions has been shown to increase the diagnostic accuracy of MPI interpretation (9–11). Prone imaging may also help reduce motion artifacts, with less cardiac drift due to breathing or by means of limiting body motion (12,13). However, in clinical practice prone imaging continues to be underutilized (14). Our aim was to evaluate the impact of routine prone-position image acquisition in a consecutive group of patients, within a visual and stepwise interpretation of MPI, with an emphasis on fraction of equivocal results, interobserver concordance, and normalcy values.
MATERIALS AND METHODS
We examined 308 consecutive patients referred to our department for MPI during the period of March 2010 to November 2010. Our imaging protocol requires routine stress prone imaging, so all patients referred in this period had stress prone data. The institutional review board approved this study, and all subjects signed a written informed consent form.
Twenty-nine patients were removed from the analysis as they included either left bundle branch block during stress or had previous myocardial infarction. There were no patients with significant valvular disease or cardiomyopathy. These were removed because cases of patients with valvular disease or cardiomyopathy frequently cause SPECT findings apart from attenuation artifacts (15–17). Wall motion data were not included in the analysis to limit the scope. Because wall motion data would mostly benefit the patients with fixed defects, the exclusion of myocardial infarction was necessary. Two hundred seventy-nine patients remained in the final analysis.
Imaging Protocols
All patients underwent 2-d stress/rest MPI with 99mTc-methoxyisobutylisonitrile. The protocol required fasting overnight and avoiding β-blockers for 48 h, calcium channel blockers for 24 h, and (for pharmacologic testing) caffeinated foods for 48 h.
Stress Testing
Thirty-three patients (12%) underwent pharmacologic stress testing with intravenous dipyridamole. The remaining 246 patients (88%) underwent treadmill exercise stress testing with the Bruce protocol. When patients achieved 100% of the maximal age-predicted heart rate or reached their maximal exercise capacity but at least 85% of age-predicted heart rate, 660-740 MBq (18–20 mCi) of 99mTc-methoxyisobutylisonitrile were injected. After injection, patients continued exercise for 1.5–2 min. Dipyridamole pharmacologic stress testing was performed with 0.56 mg/kg min−1 infusion in 4 min, followed by radiopharmaceutical injection at the seventh minute.
Nuclear Imaging
Imaging was started at approximately 1 h after radionuclide injection. Images were acquired with a Siemens Symbia E dual-head γ-camera (Siemens Medical Solutions USA) with low-energy, high-resolution collimators. All patients underwent routine ECG-gated supine SPECT (64 projections, 30 s each) along with non–ECG-gated prone SPECT (64 projections, 10 s each) imaging.
Image Evaluation
Three physicians evaluated the images each time in the same order: stress and rest polar maps, supine tomographic slices, maximum-intensity projection (cine review of raw images), motion-frozen gated images, stress prone tomographic slices, and finally clinical data. Segmental scores from QPS software (Cedars-Sinai Medical Center) were available to the interpreters throughout the evaluation. Physicians noted the segments as having abnormal or normal perfusion using their visual evaluation and the American Heart Association 17-segment model. Taking into consideration the intensity and extent of hypoperfusion in each segment and at each step estimating the probability that the apparent defects were due to attenuation or hypoperfusion, they reported a certainty score for the presence of ischemia (0, normal; 4, definitely abnormal; 2, equivocal; and 1 and 3 probable normal and abnormal).
Differences of sets of segments with abnormal perfusion were noted and used to show which segments were attributed to attenuation in the prone step (i.e., difference of sets of segments between the motion-frozen gated and prone step, shown as number of times each segment was attributed to attenuation as a percentage of total number of cases). Physician 1 was the primary physician reporting the studies; physicians 2 and 3 reviewed the images later.
Normalcy
We used Pryor and Shaw risk scoring (18) to create a subgroup with less than 10% probability of significant coronary artery disease and selected 47 of 279 patients to calculate the normalcy rates.
Statistical Analysis
In analyses of normalcy and interobserver agreement, scores of 2, 3, and 4 were considered positive for ischemia, and 0 and 1 were considered negative. The McNemar test was used for comparing evaluation steps. Interobserver agreement analysis was performed using the percentage agreement and κ statistic.
RESULTS
Patient Characteristics
Clinical characteristics of patients are summarized in Table 1.
Demographic Data
Interpretive Certainty and Decision Changes (Fig. 1)
At the step of prone images, equivocal evaluations were reclassified in 94.1% (48/51), 79% (42/53), and 85.3% (29/34) of equivocal cases for physicians 1, 2, and 3, respectively. There were also new equivocal results obtained at the prone step (physician 1, 4.4% [10/228]; physician 2, 8.8% [20/226]; physician 3, 4.9% [12/245]). As a result, all physicians reported a lower number of equivocal results at the prone step than at the previous step of motion-frozen gated images. Changes in fraction of equivocal (i.e., 2) results as a percentage of total interpretations for each physician were 18.3% (51/279) to 4.7% (13/279) (P < 0.0001) for physician 1, 19% (53/279) to 11.1% (31/279) (P = 0.0077) for physician 2, and 12.2% (34/279) to 6.1% (17/279) (P = 0.0125) for physician 3.
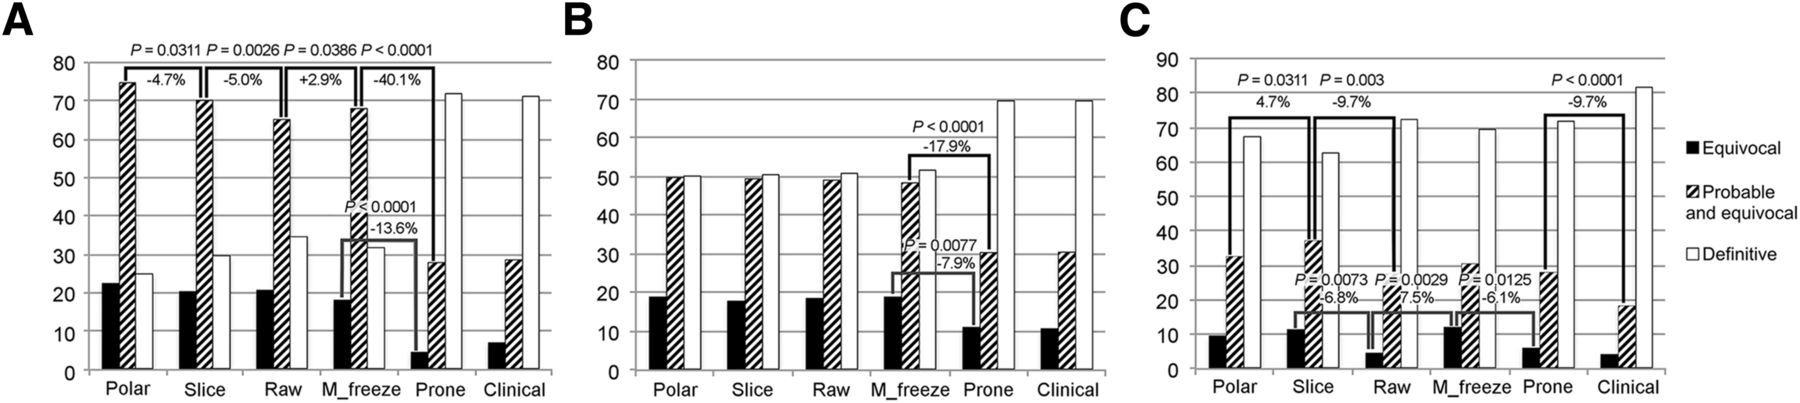
Percentages of equivocal, probable + equivocal, and definite studies in course of evaluation: physician 1 (A), physician 2 (B), and physician 3 (C).
At the step of prone images, nondefinite state (i.e., 1–3) evaluations were reclassified in 61% (116/190) for physician 1, 45.2% (61/135) for physician 2, and 41.2% (35/85) for physician 3. At the same step, new nondefinite results were obtained in 4.4% (4/89), 7.6% (11/144), and 14.4% (28/194) of definite evaluations. Physician 1 and physician 2 had the largest decrease of nondefinite states at the prone step (68.1% [190/279] to 28% [78/279], P < 0.0001 and 48.4% [135/279] to 30.5% [85/279], P < 0.0001, respectively). Physician 3 had a slight decrease of nondefinite evaluations at the prone step (30.4% [85/279] to 28% [78/279], P = not significant).
Physician 3 had significant decreases of nondefinite evaluations only at the raw data and at the clinical data steps (37.3% [104/279] to 27.6% [77/279], P = 0.003, and 28% [78/279] to 18.3% [51/279], P < 0.0001).
At the prone step, the decision reversal to normal (i.e., from 3–4 to 0–1) was observed in 40% (29/72), 33% (17/51), and 43% (21/48) of cases for each physician. When decision changes from only definitely abnormal to normal (i.e., from 4 to 0–1) were analyzed, percentages were 9% (2/23), 13% (2/15), and 30% (9/30).
At the prone stage, the decision change from normal to abnormal (i.e., from 0–1 to 3–4) was observed in 3% (5/156), <1% (1/175), and <1% (3/197) of cases.
Normalcy (Fig. 2)
Normalcy rate changes during the course of evaluation are shown in Figures 2A and 2B. All physicians had increased normalcy rates at the prone stage (physician 1, 72%–89%, P = 0.039, and physician 2, 66%–87%, P = 0.006). The increase for physician 3 was not statistically significant (80%–91%, P = 0.125). Physician 3 had the biggest increase of normalcy at the raw images (79%–94%, P = 0.016). The evaluation of motion-frozen images decreased normalcy for physician 3 (−13%, P = 0.031). Although there have been differences between normalcy rates of physicians during evaluation steps, at the prone stage there was no statistically significant difference (89%, 87%, and 91% for physicians 1, 2, and 3, respectively) (Fig. 2B).
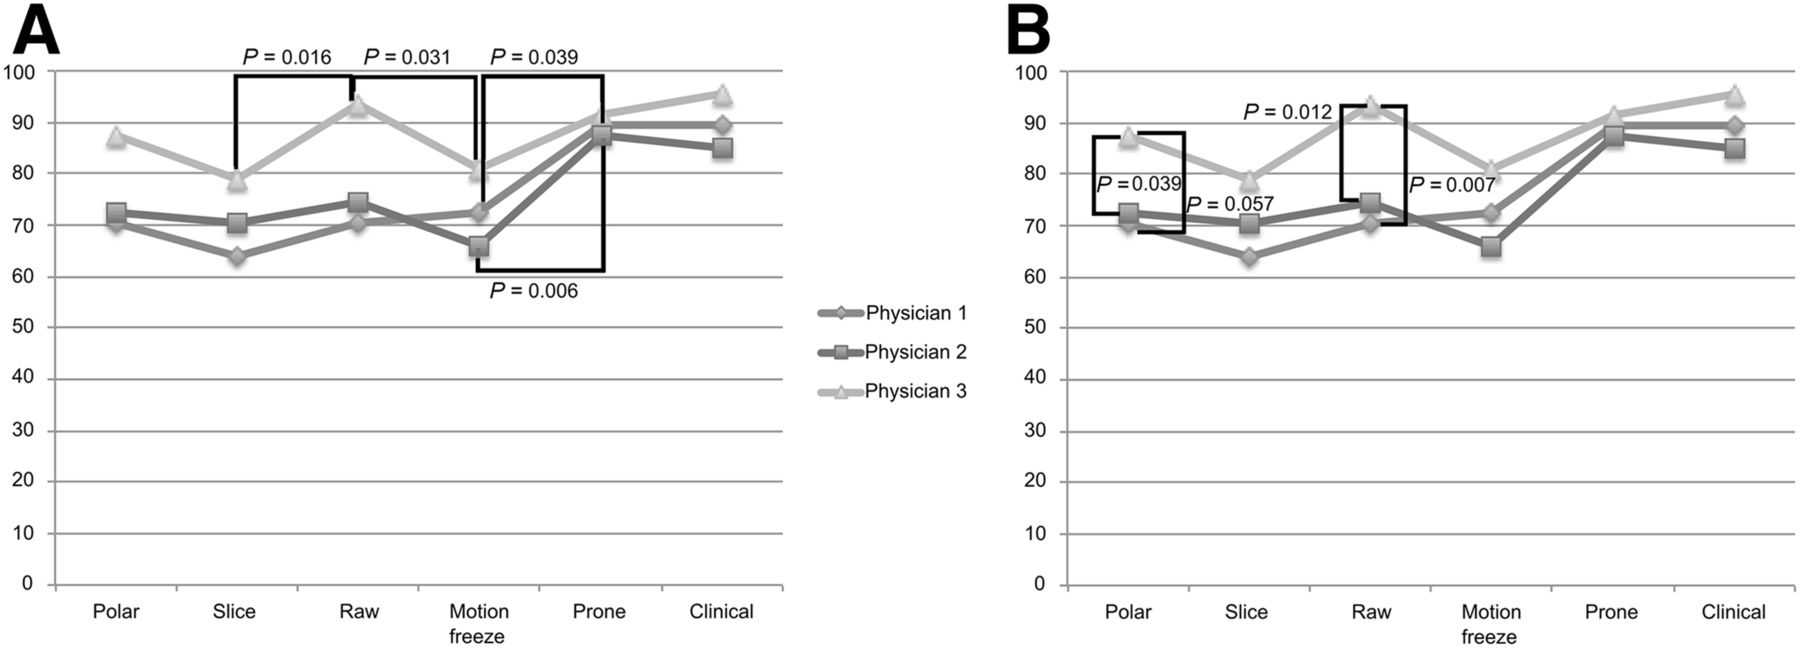
Normalcy rates at each evaluation, showing intraobserver changes (A) and interobserver differences (B).
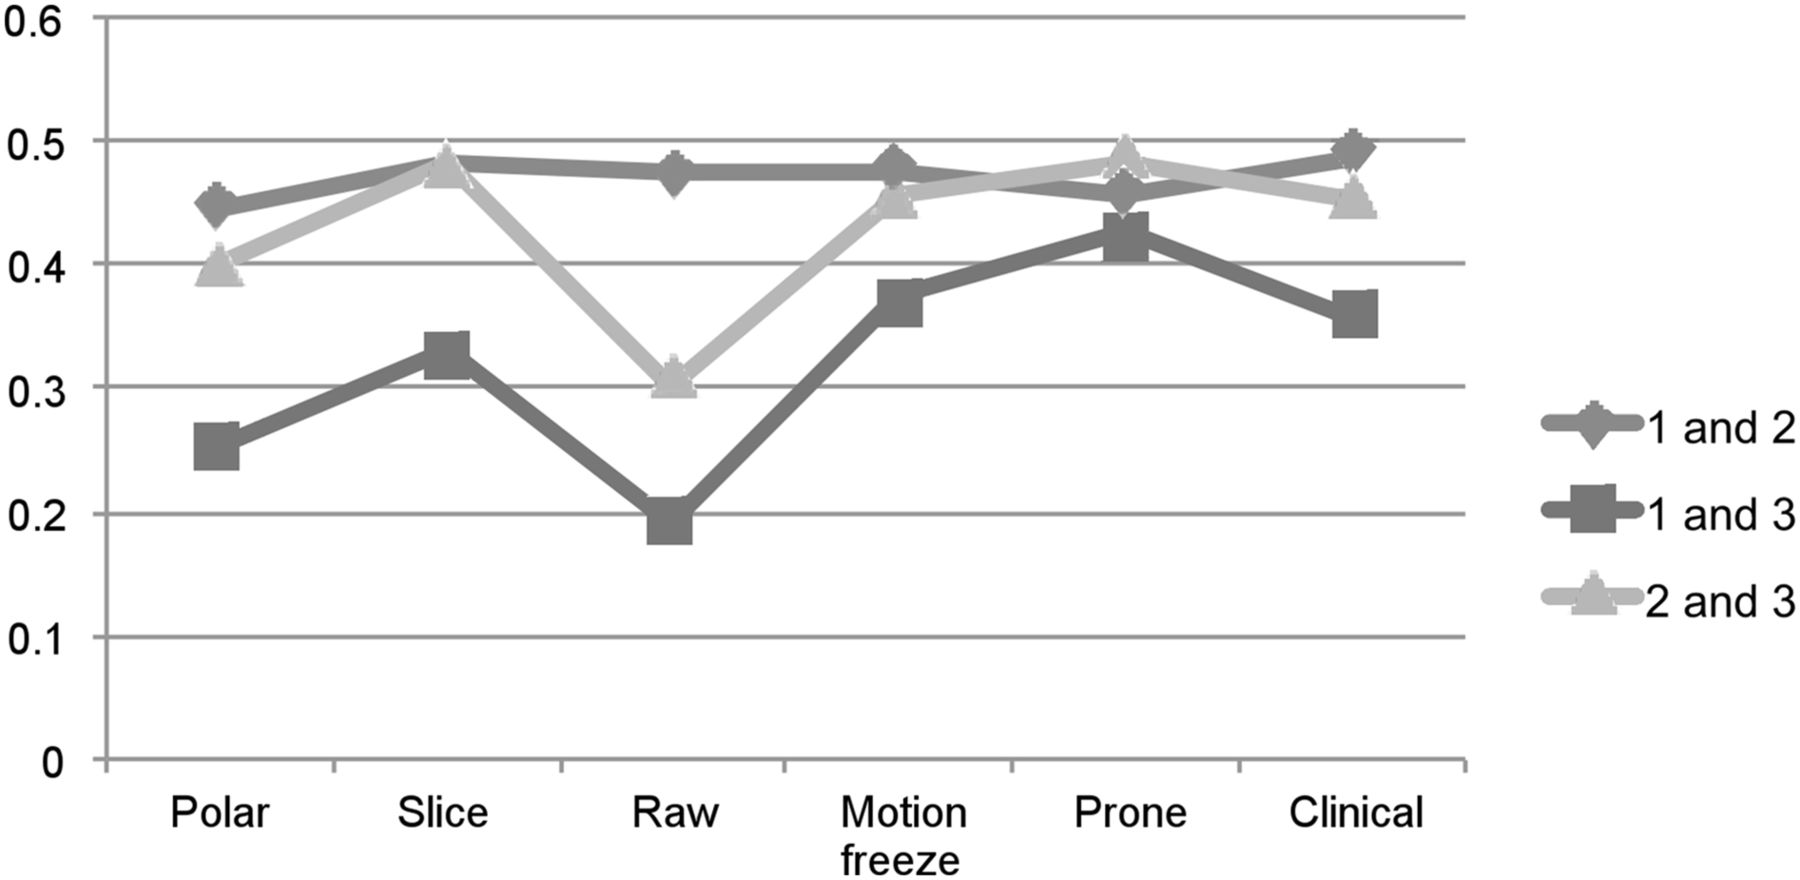
Interobserver Agreement (Fig. 3)
Interobserver agreement κ values are shown in Figure 3. At the tomographic slices evaluation, agreement values were 0.482 (1 and 2), 0.330 (1 and 3), and 0.483 (2 and 3) whereas percentage agreement was 74.2% (1 and 2), 66.7% (1 and 3), and 77.4% (2 and 3). At the prone evaluation, κ values were 0.456 (1 and 2), 0.427 (1 and 3), and 0.483 (2 and 3). At this stage, percentage agreement was 79.9% (1 and 2), 80.6% (1 and 3), and 83.5% (2 and 3).

Interobserver agreement κ values.
Attenuation in 17-Segment Model (Fig. 4)
Shown in Figure 4 are the percentages of cases that each segment was attributed to attenuation at the prone step distributed into a 17-segment map. The apical inferior, mid inferior, and basal inferior wall for men and apical and mid anterior wall for women were more likely to be corrected for attenuation.
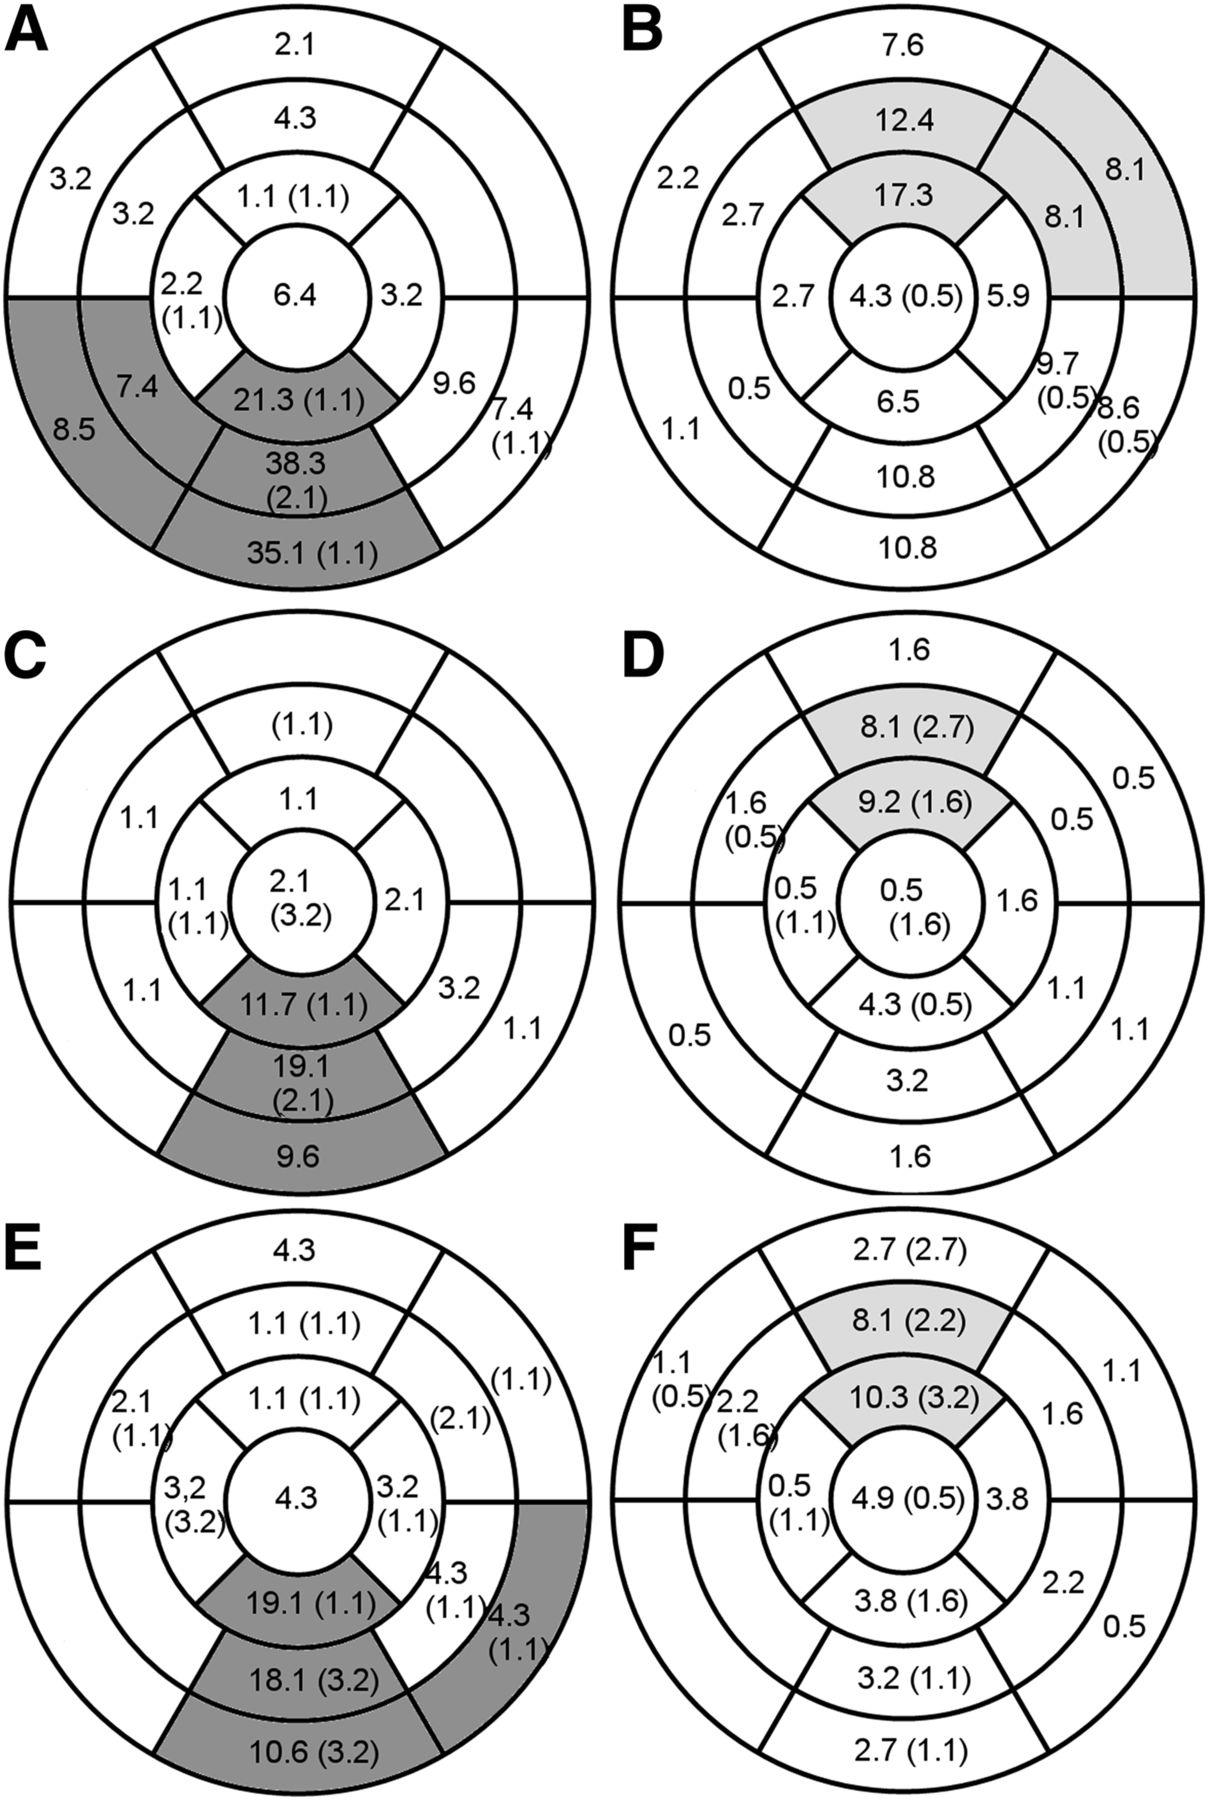
Attributions to attenuation after prone evaluation of each segment as percentage of total number of male and female patients, for each physician (A and B physician 1; C and D physician 2; E and F physician 3, male and female patient, respectively). Numbers in parentheses are new areas evaluated as abnormal after prone evaluation. Segments showing statistically significant difference between sexes are shaded.
DISCUSSION
Interpretive Certainty
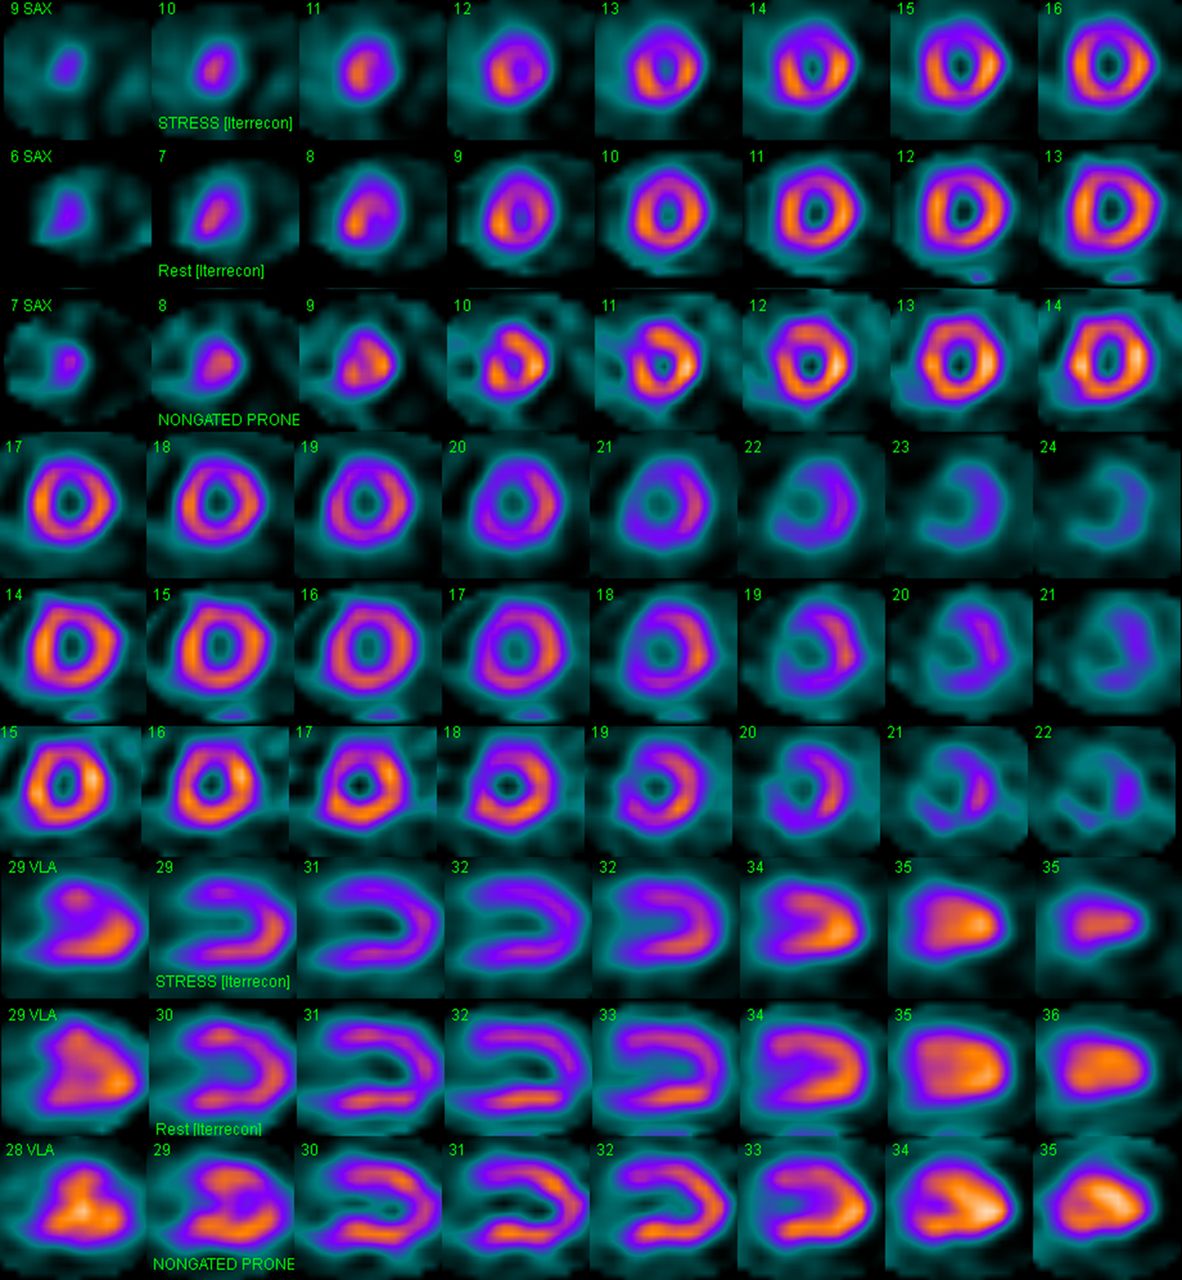
Changing position or disappearance of hypoperfusion may hint to an attenuation rather than true perfusion, increasing the certainty of physicians in reporting (Figs. 5 and 6). After evaluating prone images, Hayes et al. changed the interpretation of 368 of 655 (56%) patients with equivocal or abnormal findings to normal (19). In contrast, Thompson et al. did not find a significant increase in number of definite states (91% vs. 95%) with transmission AC (20). In our study a significant proportion of nondefinite states (i.e., 1–3) (61%, 45%, and 41% for physicians 1, 2, and 3, respectively) were reinterpreted into a definite state (i.e., 0 and 4) with prone data. Physician 3 had almost an equal number of new nondefinite results, and his overall nondefinite proportion minimally decreased (30% vs. 28%). This may be explained by a different normal distribution of counts of prone images and the possibility of new perfusion artifacts (Fig. 5, apical anterior defect in prone images). The proportions of nondefinite states for physicians 1, 2, and 3 at the step of tomographic slices were 70%, 49%, and 37%, respectively. At the prone step, nondefinite values decreased for all physicians and were close to each other and around 30% (28%, 30%, and 28%). These final values are in line with similar results reported in the literature (21). Of note was the difference between interpreters’ percentages of definite versus nondefinite results before prone imaging. Physician 1 had a higher number of nondefinite results that reduced significantly at the prone step (40.1% decrease). Physician 3 had a higher number of definite results at the first steps of the analysis. At the prone step, physicians 1 and 2 changed only 2 of 23 (9%) and 2 of 15 (13%) whereas physician 3 changed 9 of 30 (30%) of definitely abnormal results to normal or probably normal (P = 0.058 between 1 and 3). Physician 1 may have waited for more evidence to reach a definite result, and physician 3 may have tried to be more certain earlier at the expense of having to change decision more often when evidence of attenuation became available in the following steps.

Example case. First 6 rows show stress, rest, and stress prone short-axis images; next 3 rows show stress, rest, and stress prone vertical long-axis images. A 55-y-old woman with atypical angina, with hypertension and family history as risk factors; 109% heart rate achieved at Bruce level 2. SSS, 6; SRS, 0; prone, SSS 3. All 3 interpreters used information in prone image to reverse their decisions from probably abnormal to definitely normal, citing breast attenuation. Apical perfusion defect in prone image is possibly due to changing position of breast and example of discordant finding in supine and prone that helps detect presence attenuation. SRS = summed rest score; SSS = summed stress score.

Example case. First 6 rows show stress, rest, and stress prone short-axis images; next 3 rows show stress, rest, and stress prone vertical long-axis images. A 56-y-old woman with atypical angina, with hypertension and hypercholesterolemia as risk factors; 92% heart rate achieved at Bruce level 3. SSS, 3; SRS, 0; prone SSS, 6. Mid inferior wall hypoperfusion is not seen in prone image, suggesting diaphragmatic attenuation, whereas perfusion defect in apical inferior and hypoperfusion in apical lateral walls persist. Physicians changed their probably abnormal evaluations to probably normal after seeing prone data. Coronary angiography showed no significant lesions.
Cine review of raw tomographic images is advised in nuclear cardiology guidelines as a method of quality control and also a sensitive method for detecting breast and diaphragmatic attenuation (22–24). Literature specifically quantifying advantages of this method—which is the third step of evaluation in our study design—is missing, however. We have found that raw images increased the certainty but to a lesser extent than prone images for 2 physicians (percentage of nondefinite interpretation for physician 1, 70.2% to 65.2%, P = 0.0026, and physician 3, 37.3% to 27.6% P = 0.003, after evaluating cine raw images, Fig. 1). Physician 2 did not show any significant difference in her interpretive certainty at this step. Cine review of raw images was the second-most effective step after the prone step to reduce uncertainty.
Clinical information was shown to improve risk stratification of MPI results and slightly decrease equivocal results (21). In our study, available clinical information at the end of the evaluation steps reduced uncertainty only for physician 3 (28% to 18.3%, P < 0.0001). This decrease in uncertainty was accompanied with a slight increase in normalcy for physician 3 (91% to 96%, P = not significant).
Polar images are used to quantify perfusion and are known to have high correlation with expert visual interpretation of perfusion and reversibility (25). Over polar images, slice data provided inconsistent—and if present minor—benefits in terms of uncertainty (decrease only for physician 1, increasing uncertainty for physician 3). This result is not unexpected because polar maps—if technically correctly generated—capture most of the perfusion information, and polar maps form the information source of many highly accurate artificial neural network diagnostic systems (26,27).
Normalcy
Several studies have shown increasing normalcy rates with prone imaging (13,28,29). With the addition of prone images, Arsanjani et al. reported increasing interobserver agreement along with increasing specificity (30). In our results, the biggest increase in normalcy was during the evaluation of prone images. Furthermore, at the prone stage, there were no significant differences between normalcy rates of physicians, and there was a trend of normalcy values of physicians getting closer.
Generation of motion-frozen gated images was shown to provide increased resolution and contrast (31). Although it may be hypothesized that evaluating these images increases sensitivity, it was shown that if normal limits are derived from a set of motion-frozen gated images, these images increase specificity rather than sensitivity when automated quantification is the criterion (32). In our study, we used visual evaluation of these images, which may explain the slight loss of normalcy for 2 physicians at this step. To the best of our knowledge, literature comparing motion-frozen gated tomographic images with summed tomographic images, using visual evaluation, is missing. So our finding may be of importance when viewing these images in that they may inherently have different normal distributions due to increased resolution, and interpreters should be careful not to confuse them with real defects and should preferably use matching normal databases.
Cine review of raw images provides visual clues to attenuating structures. All physicians had increasing normalcy at the cine review of raw images step, although difference was significant for only 1 physician. This step was 1 of the only 2 steps—along with the prone step—for which all interpreters’ normalcy rates increased (although not all changes were statistically significant).
We observed interobserver agreement values in the moderate range, which are similar to those reported in other studies (33). In our study, the highest concordance was obtained at the prone stage.
Segmental Distribution
In a female population with additional prone images, Slomka et al. corrected for false-positive defects in the anterior wall in 43%, followed by the lateral wall in 28% and inferior wall in 13% (10). Nishina et al. found that most of the segments that differed between supine and prone normal databases were located in the anterior wall of women and inferior wall of men (34). In our study, we found a majority of findings attributed to attenuation in the anterior and inferior walls: apical, mid, and basal inferior walls of men and apical and mid anterior walls of women, for all physicians (Fig. 4). There were, however, cases in which other walls, especially the inferior wall, attributed for attenuation for female subjects.
Our study has several limitations. First, we decided on the order of interpretation to be able to extract the information content of each step building on the previous one, starting with the polar map as a summary (35), tomographic images as standard data, cine raw images to identify attenuation, motion-frozen gated images to evaluate effects of possibly increased resolution (31), prone images to identify attenuation, and finally clinical data. This order of evaluation is most likely different in other laboratories. Second, a prognostic power of the results was not investigated, though preserved prognostic value of a normal interpretation after prone images was reported (19).
CONCLUSION
The routine addition of prone imaging increases interpretive certainty and normalcy, decreases interobserver variability, and changes the final decision in a substantial number of MPI studies.
DISCLOSURE
No potential conflict of interest relevant to this article was reported.
Footnotes
Published online Nov. 19, 2015.
REFERENCES
- Received for publication August 24, 2015.
- Accepted for publication October 14, 2015.


