


Article Figures & Data
Figures
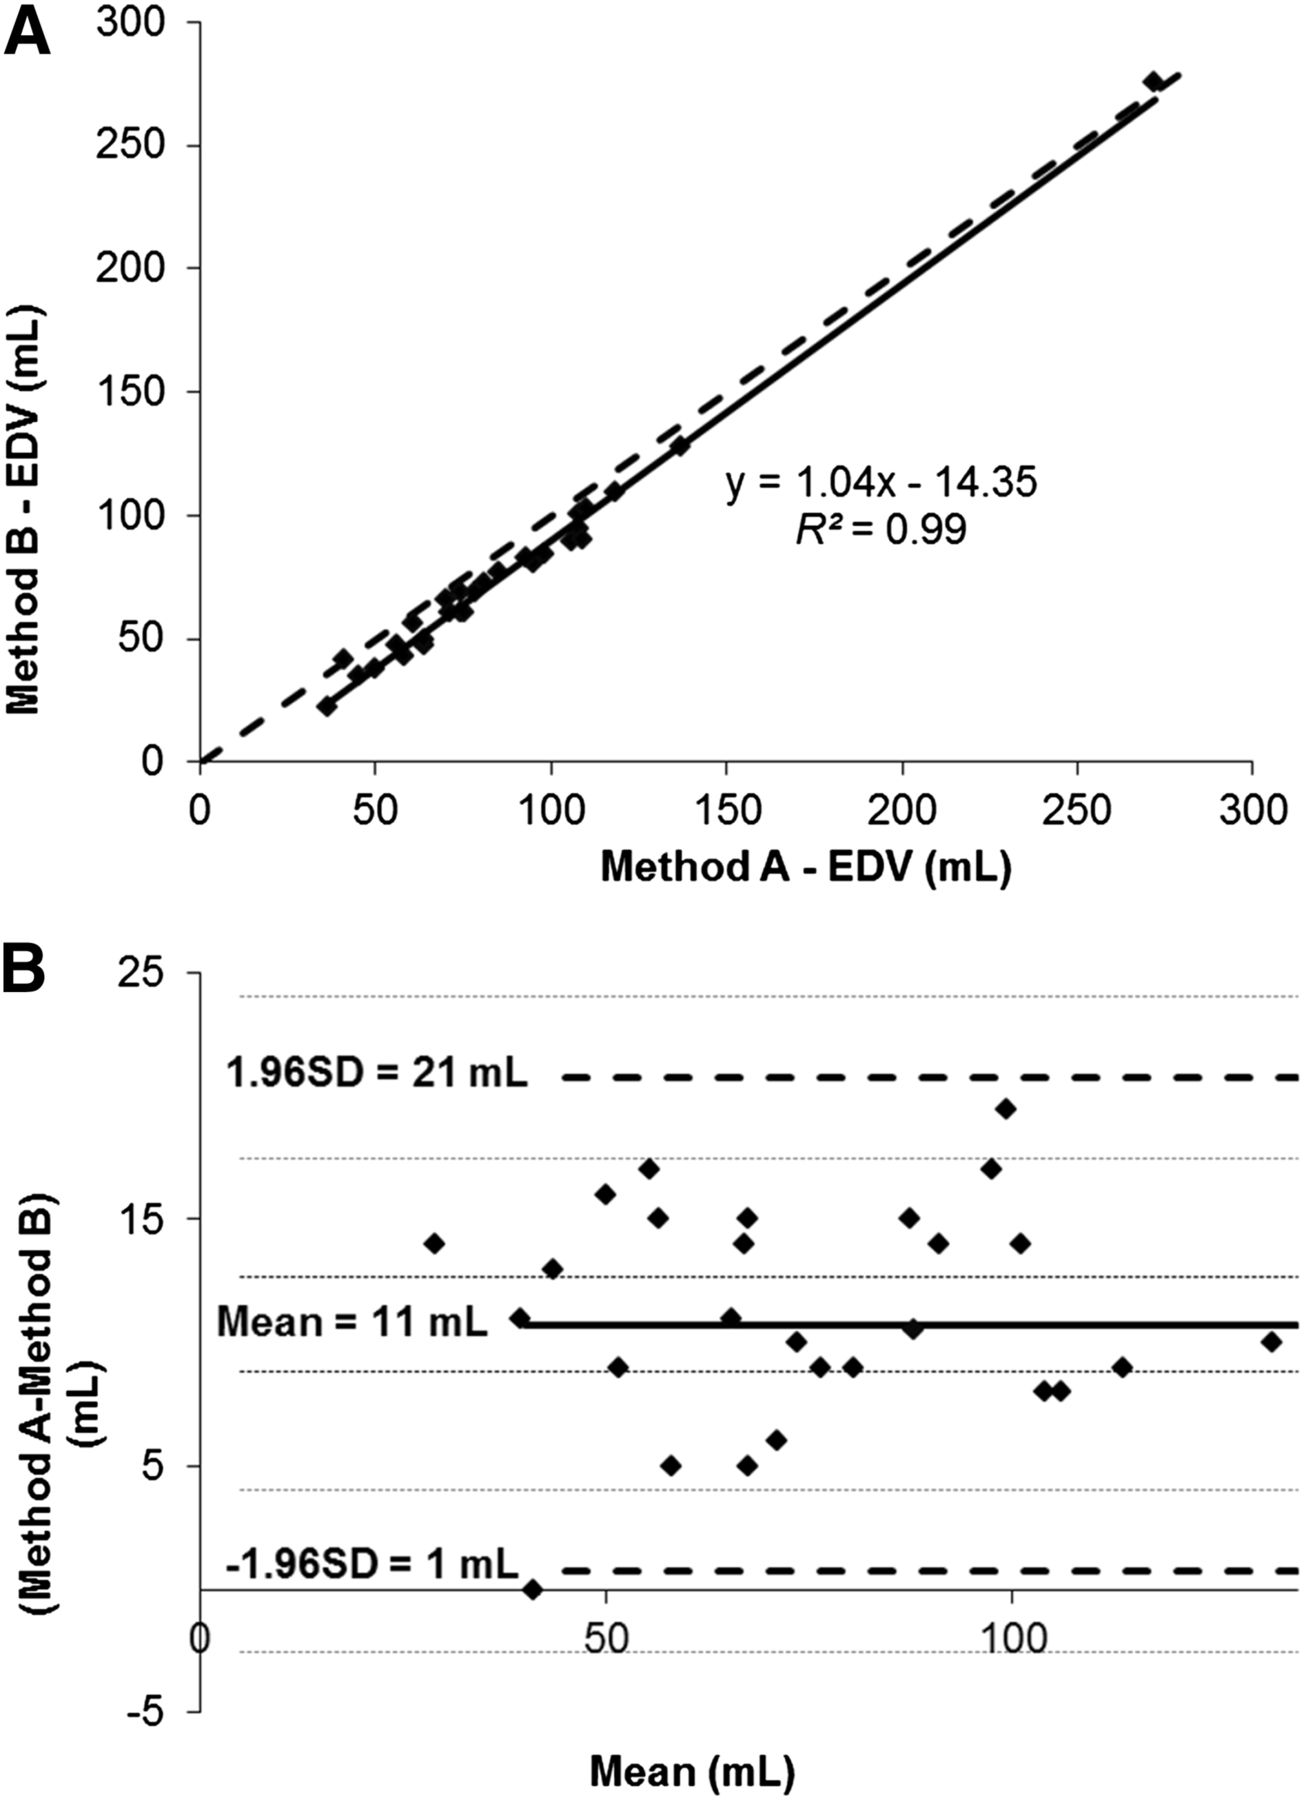
- FIGURE 1.
Method A vs. B for EDV. (A) Scatterplot. Linear regression was calculated and is shown as full curve, and line of equality is illustrated by dotted curve. (B) Bland–Altman plot. One point in Bland–Altman plot is omitted due to scaling of x-axis. Bold curve = mean of differences; dotted curve = ±1.96 SDs; small dotted curves = CIs of mean and CIs of limit of agreement.
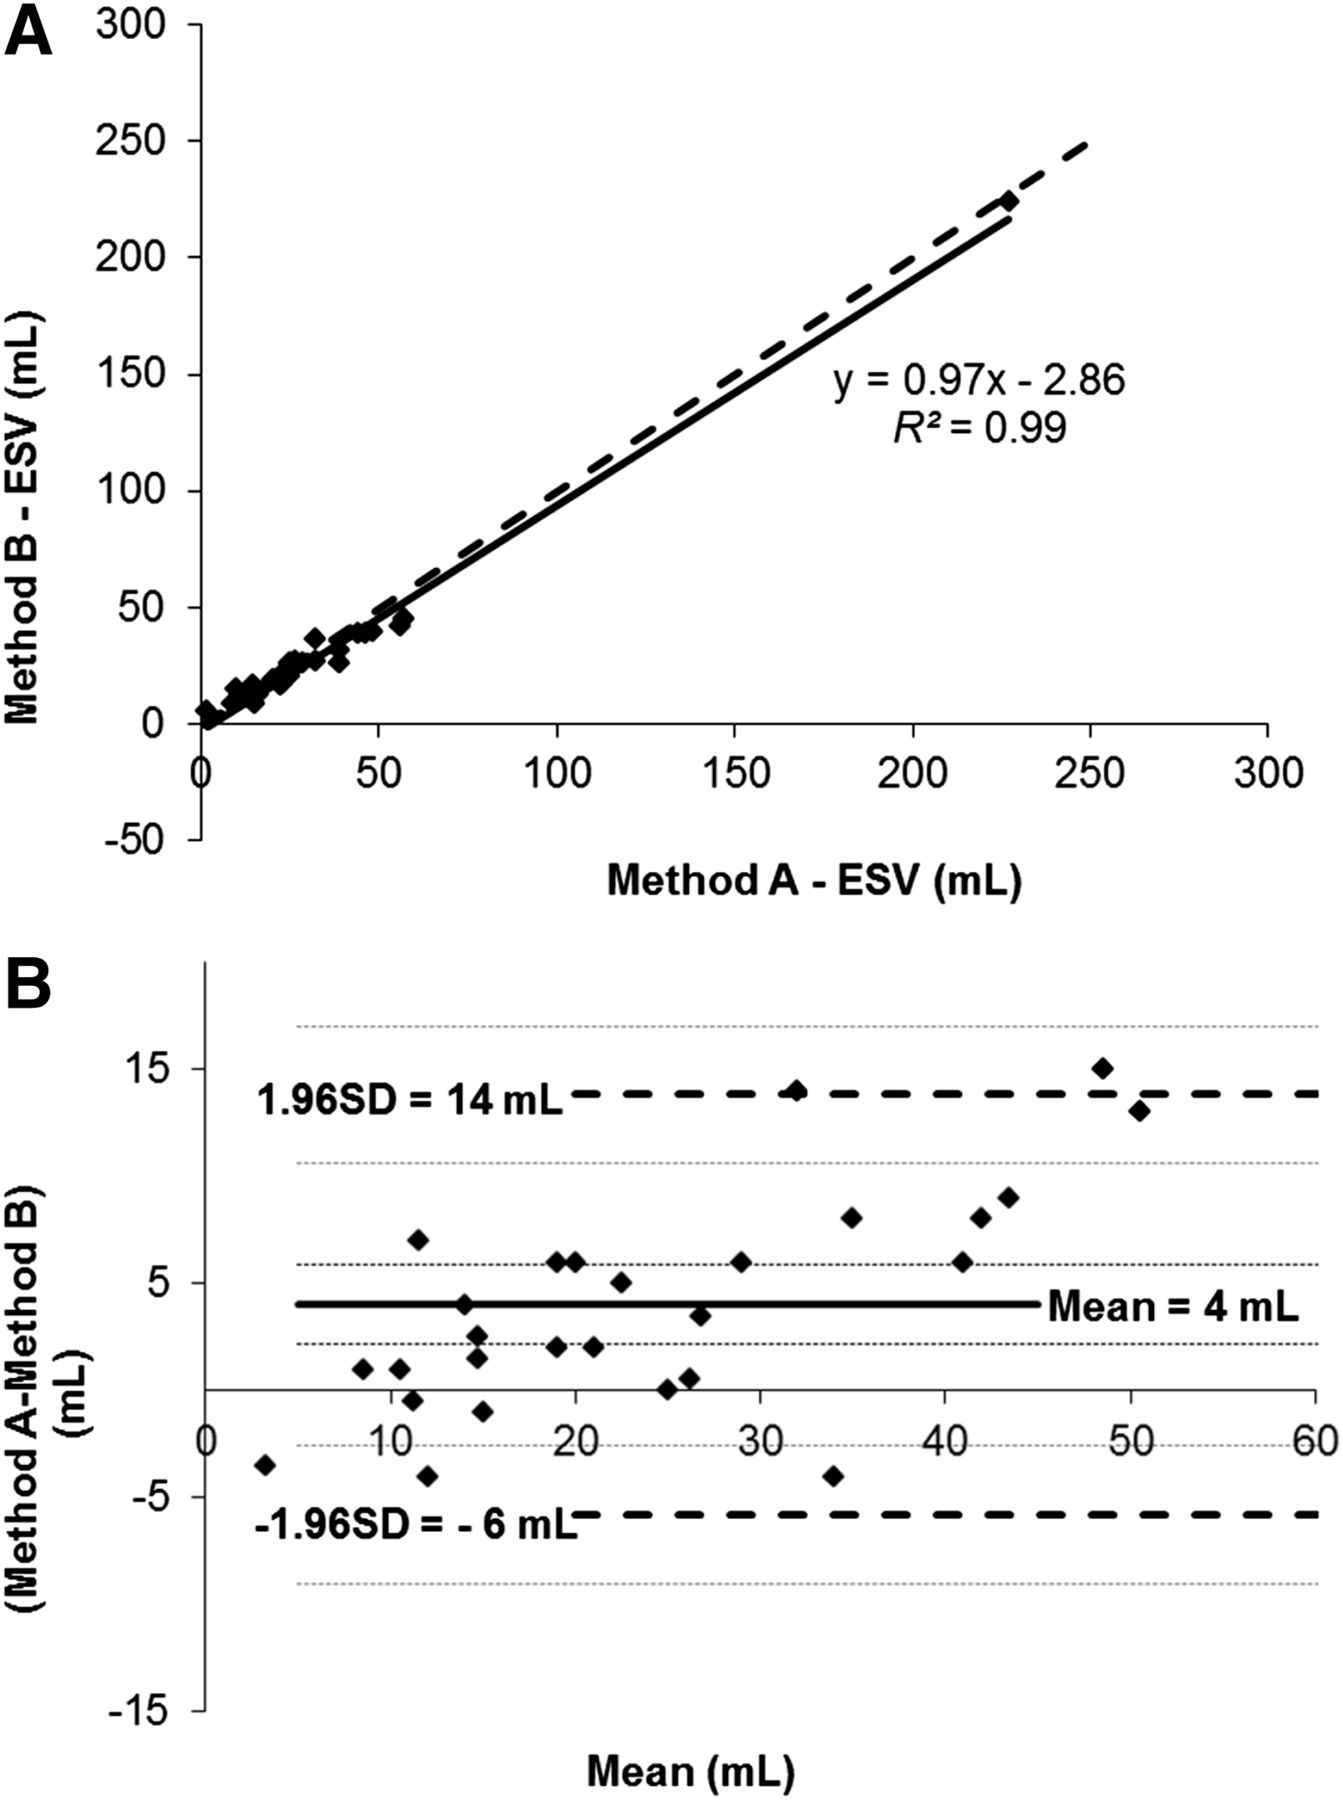
- FIGURE 2.
Method A vs. B for ESV. (A) Scatterplot. Linear regression was calculated and is shown as full curve, and line of equality is illustrated by dotted curve. (B) Bland–Altman plot. One point in Bland–Altman plot is omitted due to scaling of x-axis. Bold curve = mean of differences; dotted curve = ±1.96 SDs; small dotted curves = CIs of mean and CIs of limit of agreement.
- FIGURE 3.
Method A vs. B for LVEF. (A) Scatterplot. Linear regression was calculated and is shown as full curve, and line of equality is illustrated by dotted curve. (B) Bland–Altman plot. Bold curve = mean of differences; dotted curve = ±1.96 SDs; small dotted curves = CIs of mean and CIs of limit of agreement; gray area = predefined medical limits of 10% points.
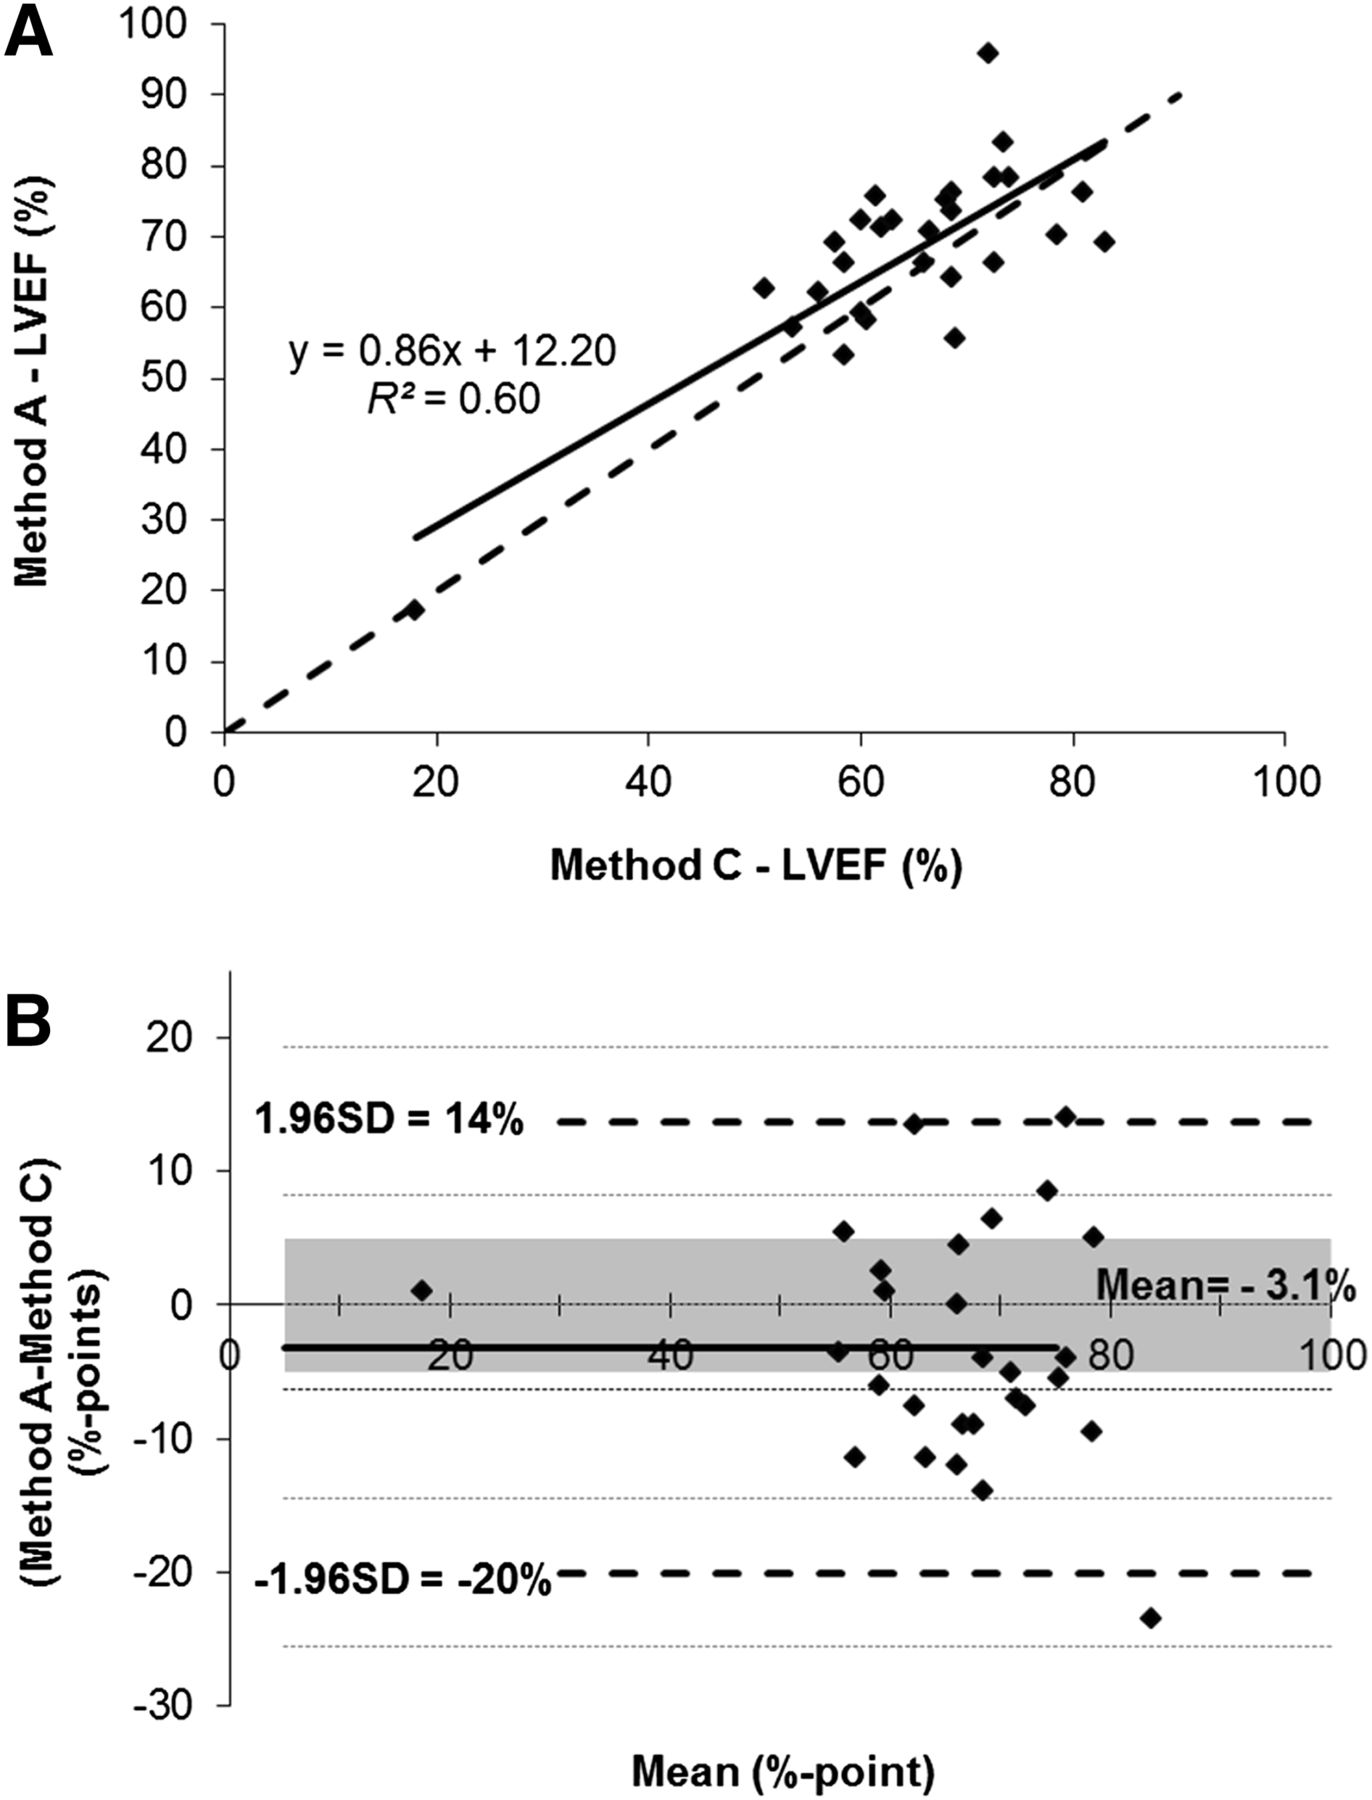
- FIGURE 4.
Method A vs. C for LVEF. (A) Scatterplot. Linear regression was calculated and is shown as full curve, and line of equality is illustrated by dotted curve. (B) Bland–Altman plot. Bold curve = mean of differences; dotted curve = ±1.96 SDs; small dotted curves = CIs of mean and CIs of limit of agreement; gray area = predefined medical limits of 10% points.
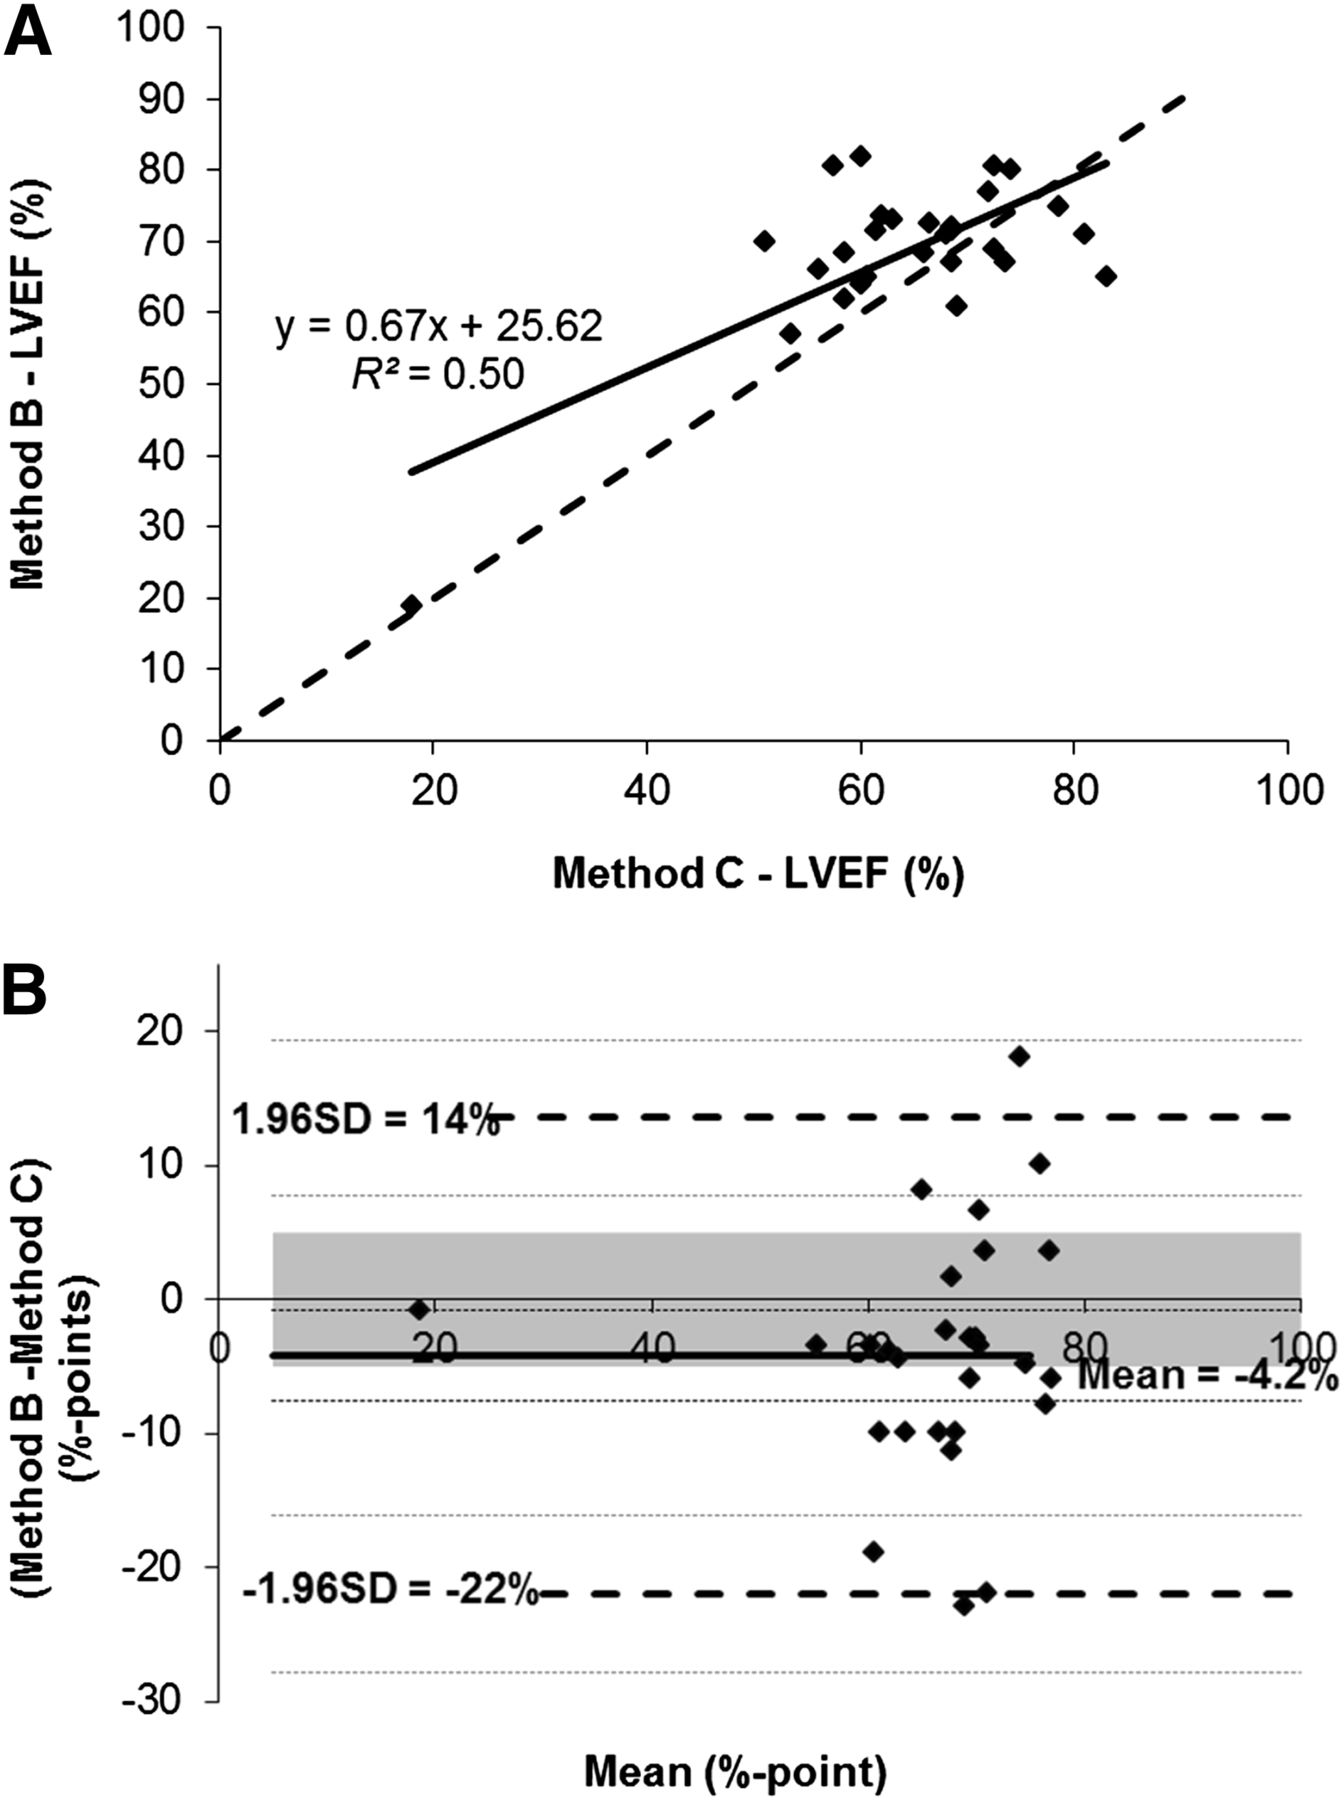
- FIGURE 5.
Method B vs. C for LVEF. (A) Scatterplot. Linear regression was calculated and is shown as full curve, and line of equality is illustrated by dotted curve. (B) Bland–Altman plot. Bold curve = mean of differences; dotted curve = ±1.96 SDs; small dotted curves = CIs of mean and CIs of limit of agreement; gray area = predefined medical limits of 10% points.
- FIGURE 6.
Screen capture of tap setup in 4DMSPECT. Determination of position of left ventricular (LV) center and apical and basal limits. (A) Results for method A. (B) Results for method B. Quality of images in method B is in this case reduced. Gaussian filtering in method A and B is equal.
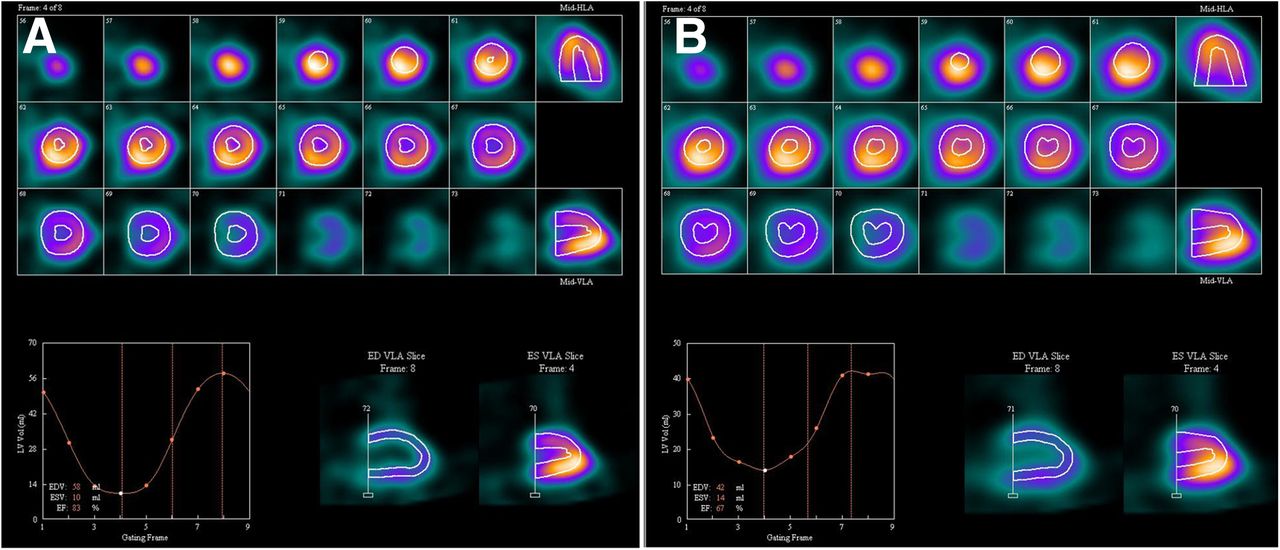
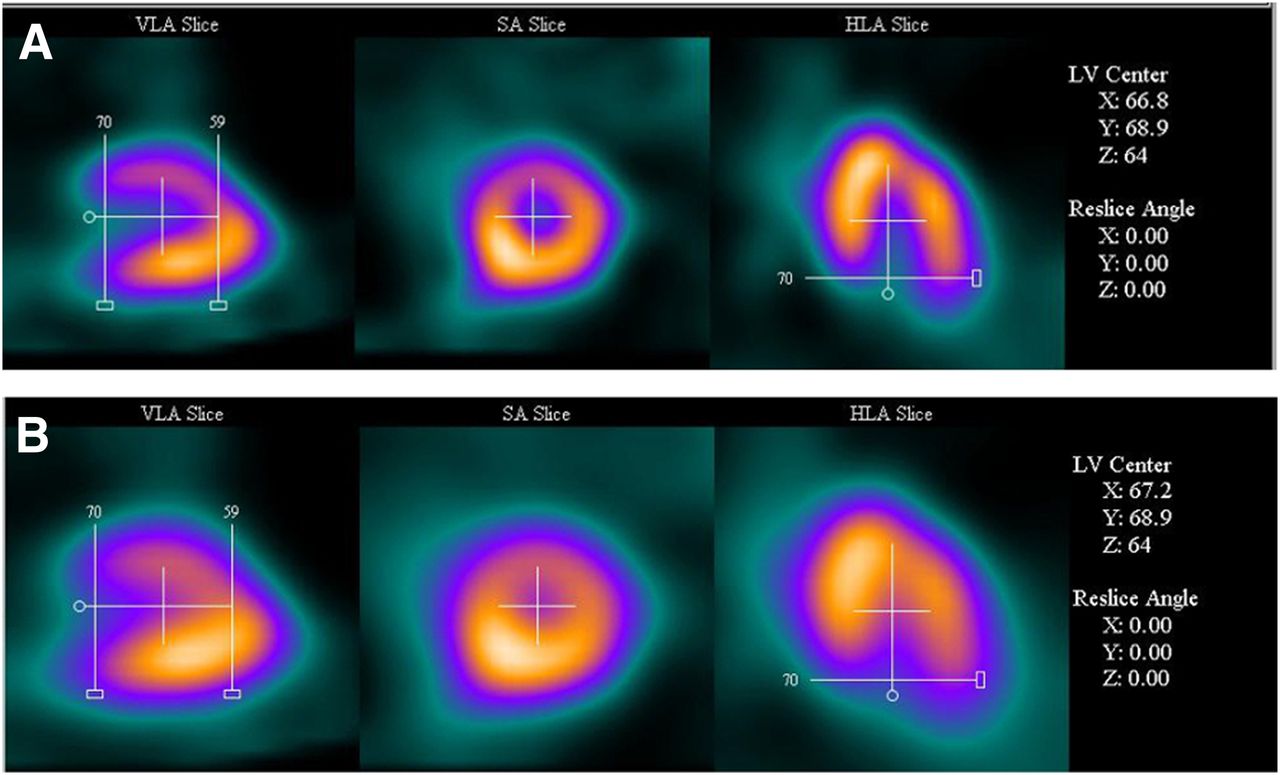
- FIGURE 7.
Screen capture of IQ-gSPECT data loaded into 4DMSPECT. Frame 4 of 8 is shown. (A) Results displayed for method A, EDV = 58 mL, ESV = 10 mL, and LVEF = 83%. (B) Results displayed for method B, EDV = 42 mL, ESV = 14 mL, and LVEF = 67%. LVEF for method C = 73%.


Tables
Method Setting A B C Radiopharmacy 99mTc-sestamibi 99mTc-sestamibi 99mTc-UltraTag (Mallinckrodt Inc.) Dose (±2 SDs) 650 ± 50 MBq 650 ± 50 MBq 740 ± 45 MBq Collimator SMARTZOOM SMARTZOOM LEHR Bins per cardiac cycle 8 8 16 Acquisition time 5 min 5 min 20 min Matrix 128 × 128 128 × 128 64 × 64 Pixel size 4.8 mm 4.8 mm 5.4 mm Zoom 1 1 1.78 Camera position 2 detectors, 208°, 17 views 2 detectors, 208°, 17 views Single-head 45° left anterior oblique/best septal separation between ventricles by adjustment Processing software 4DMSPECT 4DMSPECT Siemens esoft (MIApps) Reconstruction algorithm Iterative Flash3D (15i2s) Iterative Flash3D (12i1s) — Filtering Gaussian 10 mm Gaussian 10 mm Low-pass filtering - TABLE 2
Average Value, SD, and Range for LVEF, EDV, and ESV for All Patients and for Each of the Methods Applied
Method Parameter A B C EDV (mL) Mean ± SD 87.0 ± 44.2 76.3 ± 46.3 — Range 36–276 22–223 — ESV (mL) Mean ± SD 33.3 ± 40.7 29.3 ± 40.0 — Range 1.5–227 5–223 — LVEF (%) Mean ± SD 67.5 ± 13.4 68.6 ± 11.4 64.4 ± 12.1 Range 18–83 19–82 18–83 EDV and ESV cannot be estimated in MUGA study.
Parameter Method A vs. B, D(n) D(n,α) Method A vs. C, D(n) D(n,α) Method B vs. C, D(n) D(n,α) LVEF, Kolmogorov–Smirnov test 0.05 < 0.24 0.09 < 0.24 0.10 < 0.24 EDV, Kolmogorov–Smirnov test 0.06 < 0.24 — — ESV, Kolmogorov–Smirnov test 0.08 < 0.24 — — If data are normally distributed, then critical value D(n,α) will be larger than D(n). D(n,α) is found in Kolmogorov–Smirnov table, for n = 28 and α = 0.05 D(n,α) = 0.24. D(n) is calculated for each method comparison and is in all cases lower than D(n,α). All data are normally distributed.
- TABLE 4
Results of Statistical Analysis for EDV and ESV for Comparison Between Method A and B
Method Analysis A vs. B, EDV (mL) A vs. B, ESV (mL) Bland–Altman Mean ± 2 SDs 10.8 ± 22 4.0 ± 20 CI of mean ±1.9 ±1.9 CI of limits ±3.3 ±3.2 Linear regression (y = ax +b ) a 1.04 0.97 b −14 −2.8 R2 0.98 0.99 r 0.99 0.99 - TABLE 5
Results of Statistical Analysis for LVEF for Each Comparison Between Methods A, B, and C
Methods Analysis A vs. B (% points) A vs. C (% points) B vs. C (% points) Bland–Altman Mean ± 2 SDs −1.1 ± 15.0 −3.1 ± 17.2 −4.2 ± 18.2 CI of mean ±2.8 ±3.3 ±3.4 CI of limits ±4.9 ±5.6 ±5.9 Linear regression (y = ax + b) a 0.71 0.86 0.67 b 20.6 12.2 25.6 R2 0.69 0.60 0.50 r 0.83 0.77 0.70


