


Article Figures & Data
Figures
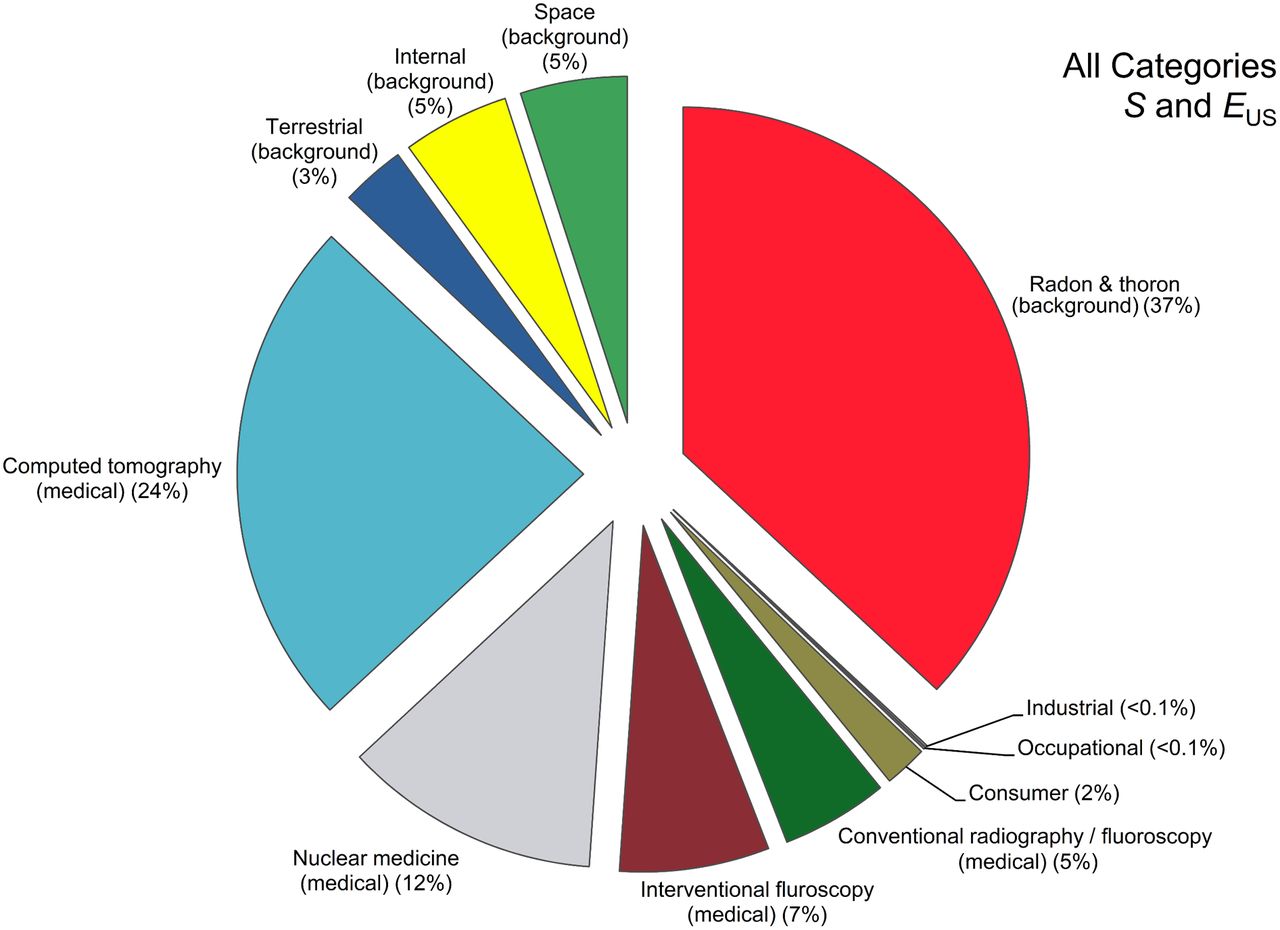
- FIGURE 1.
Chart showing effective dose to U.S. population in 2006 from all categories. S = person-Sv; EUS = effective dose per individual in United States. (Reprinted with permission of (1).)
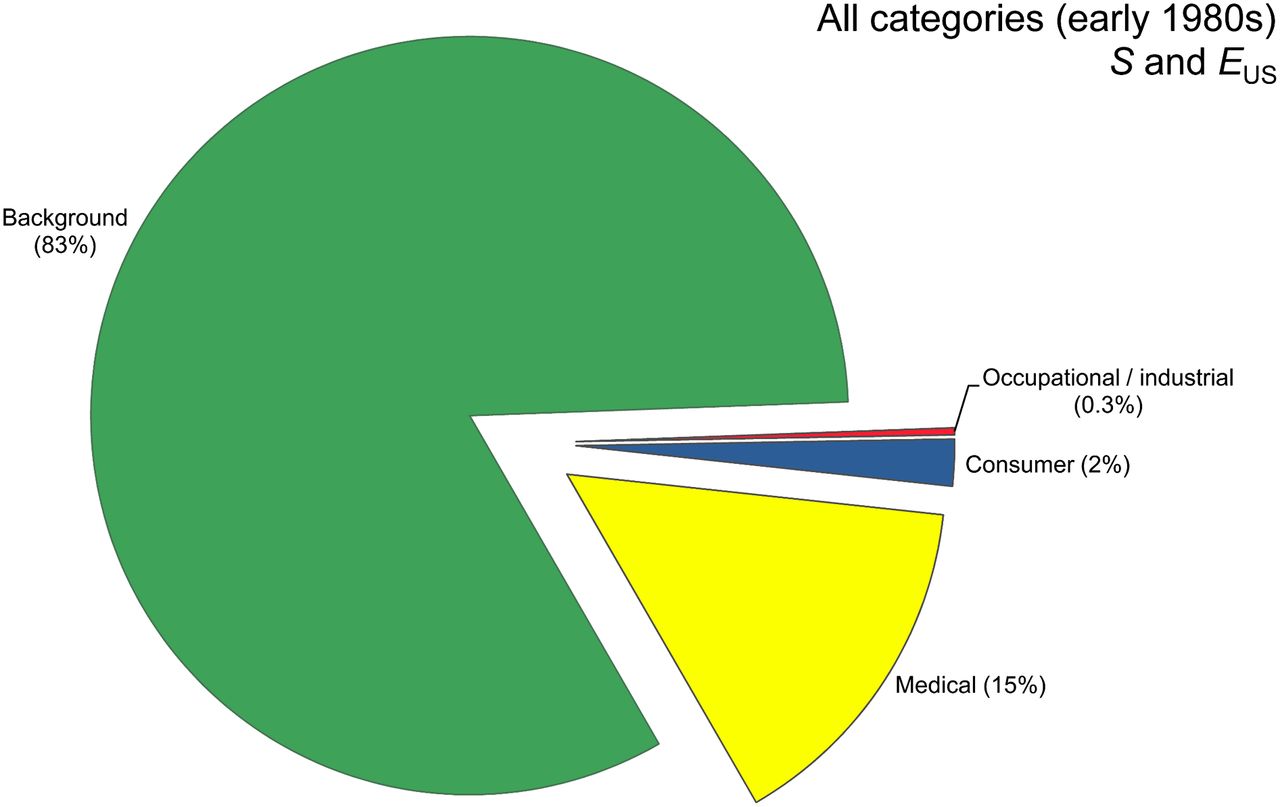
- FIGURE 2.
Chart showing exposure of U.S. population in early 1980s. When compared with these data, data from 2006 showed marked increase in medical exposure from 15% to 48%. S = person-Sv; EUS = effective dose per individual in United States. (Reprinted with permission of (1).)
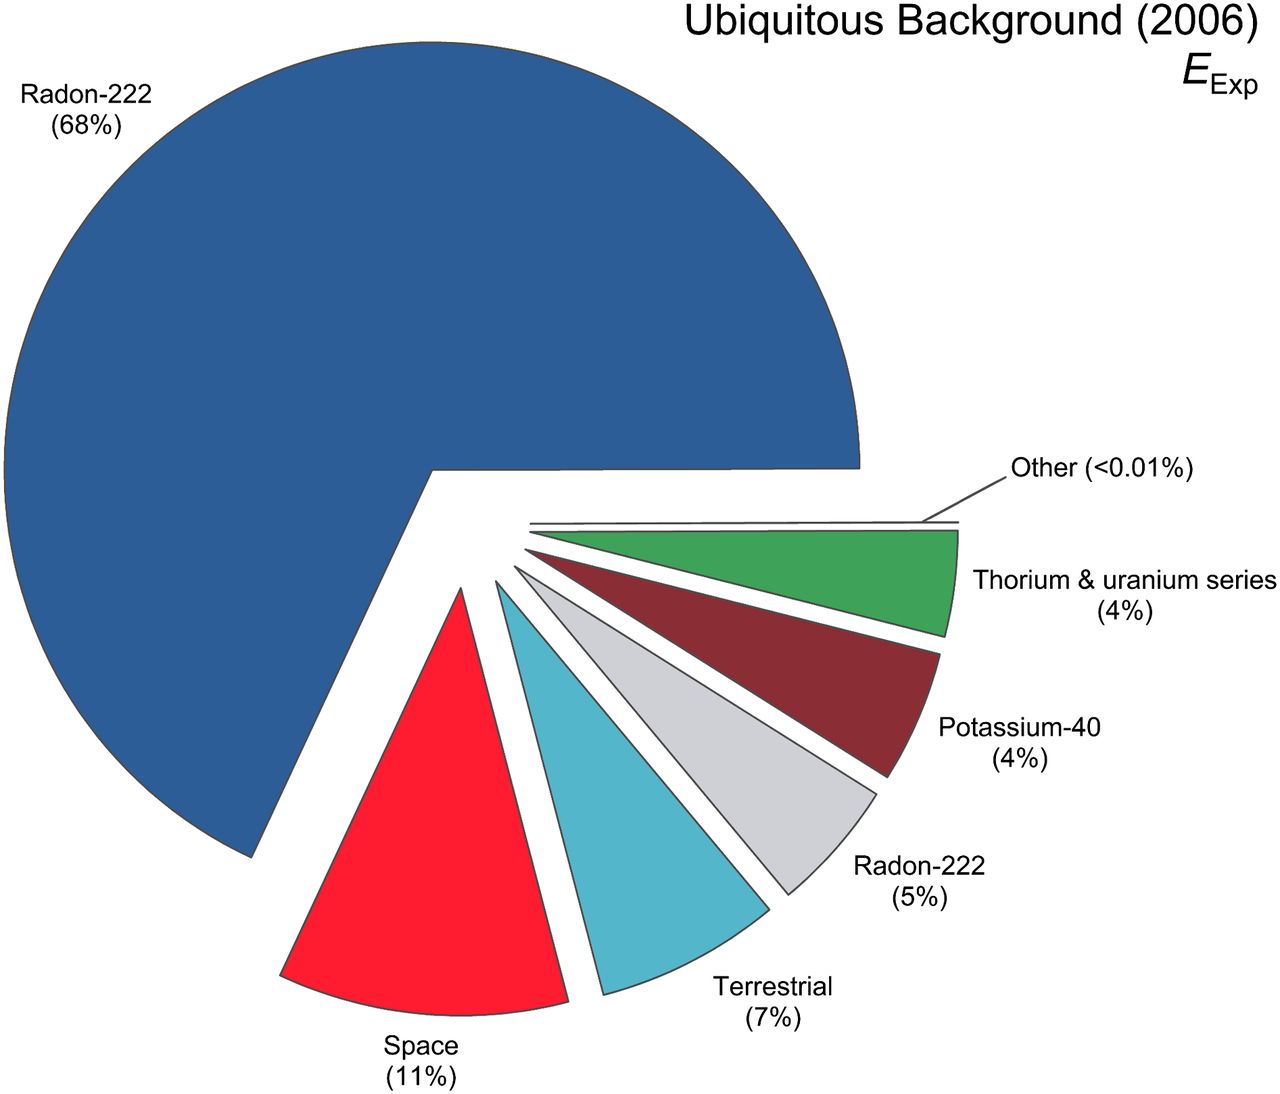
- FIGURE 3.
Overall contribution from different sources of background radiation to U.S. population. EExp = average effective dose for the exposed group for 2006. (Reprinted with permission of (1).)
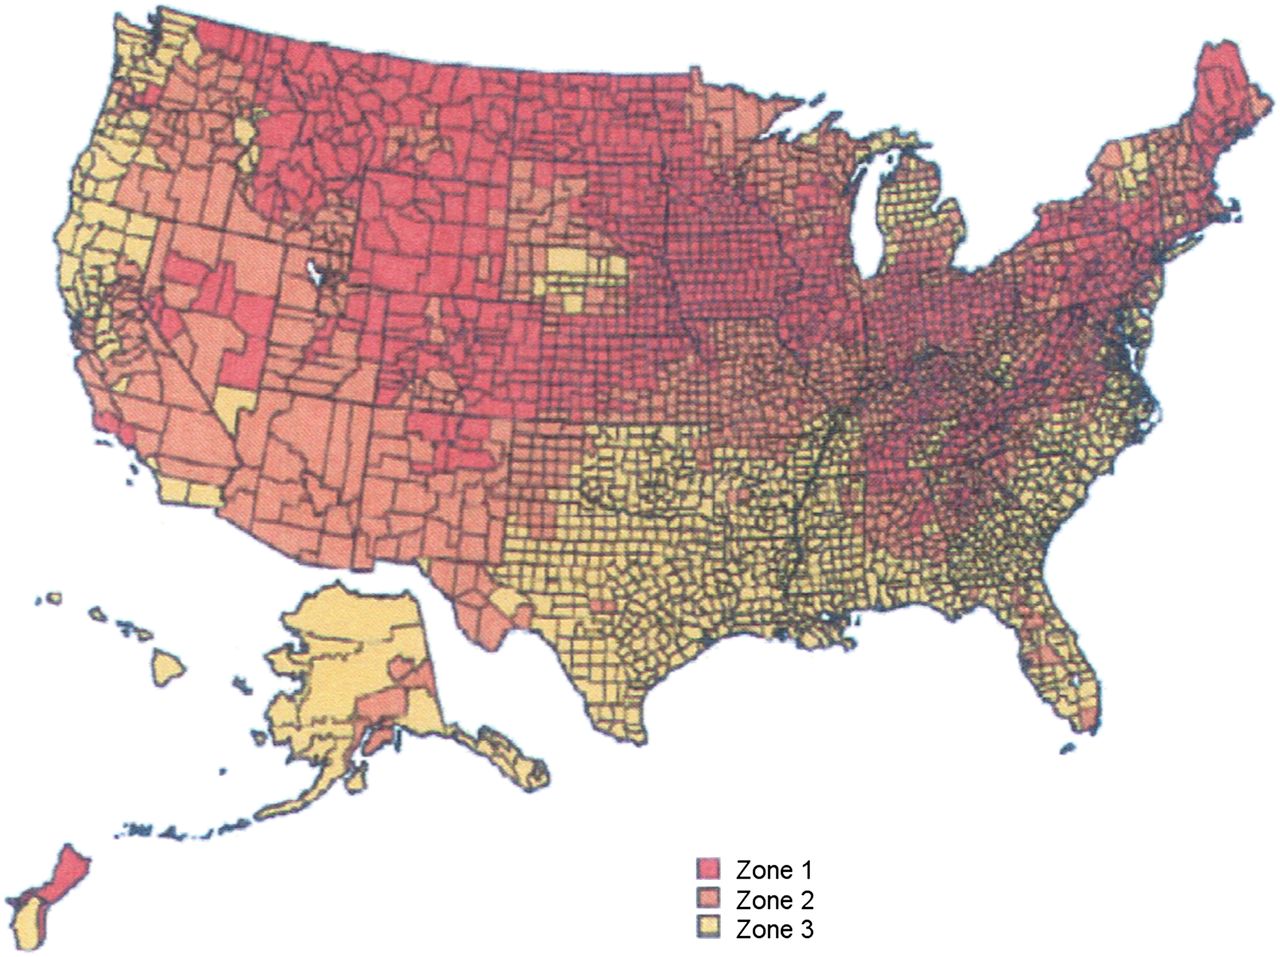
- FIGURE 4.
Relative radon amounts by county in United States. Red counties are >148 Bq m−3; orange counties are 74–148 Bq m−3; yellow counties are <74 Bq m−3. (Reprinted with permission of (1).)
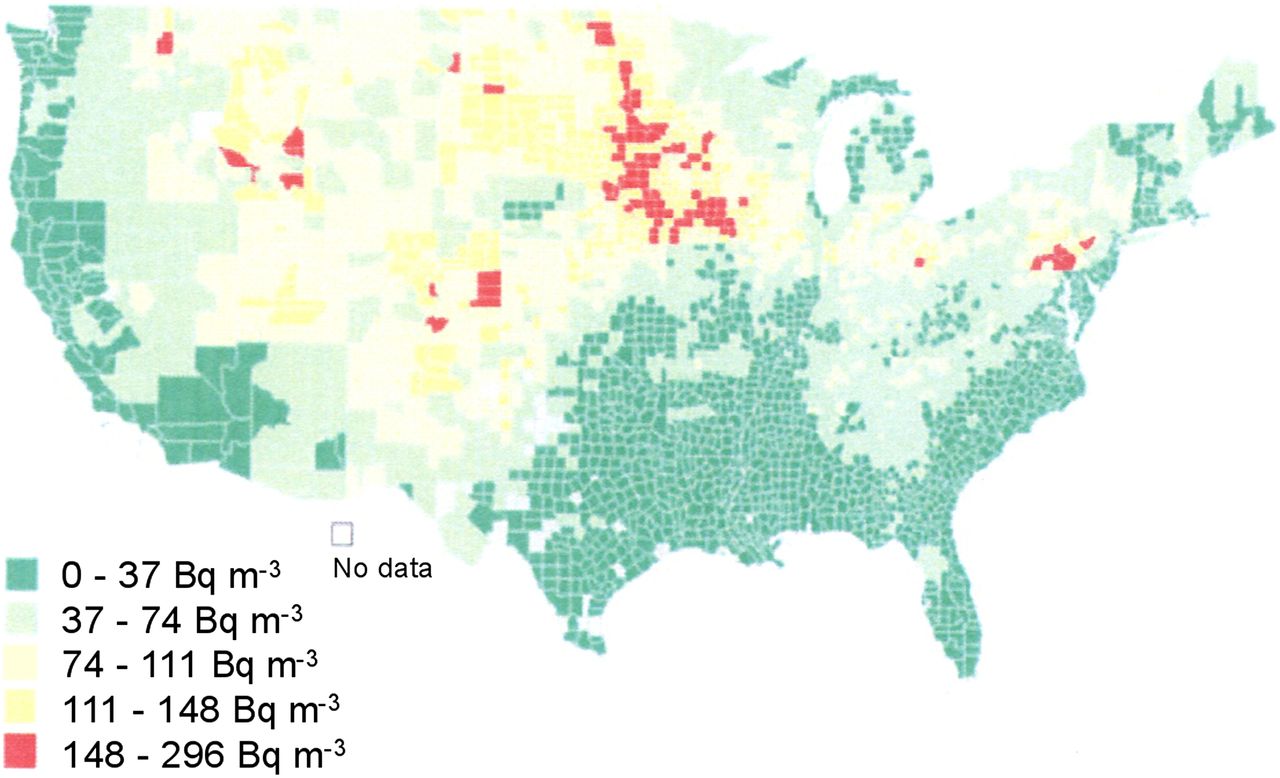
- FIGURE 5.
Radon concentrations predicted by Lawrence Berkley National Laboratory. Actual amounts per household depend on many factors, including ventilation. (Reprinted with permission of (1).)
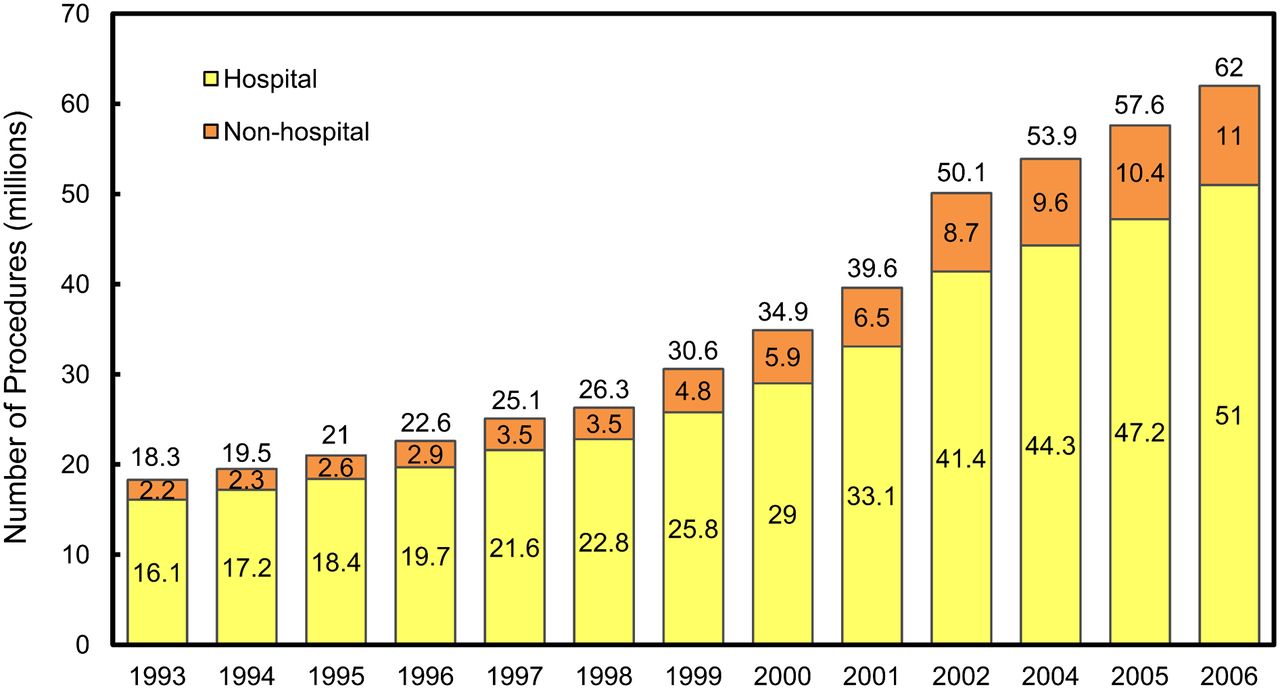
- FIGURE 6.
Number of CT procedures per year in United States from 1993 to 2006. (Reprinted with permission of (1).)
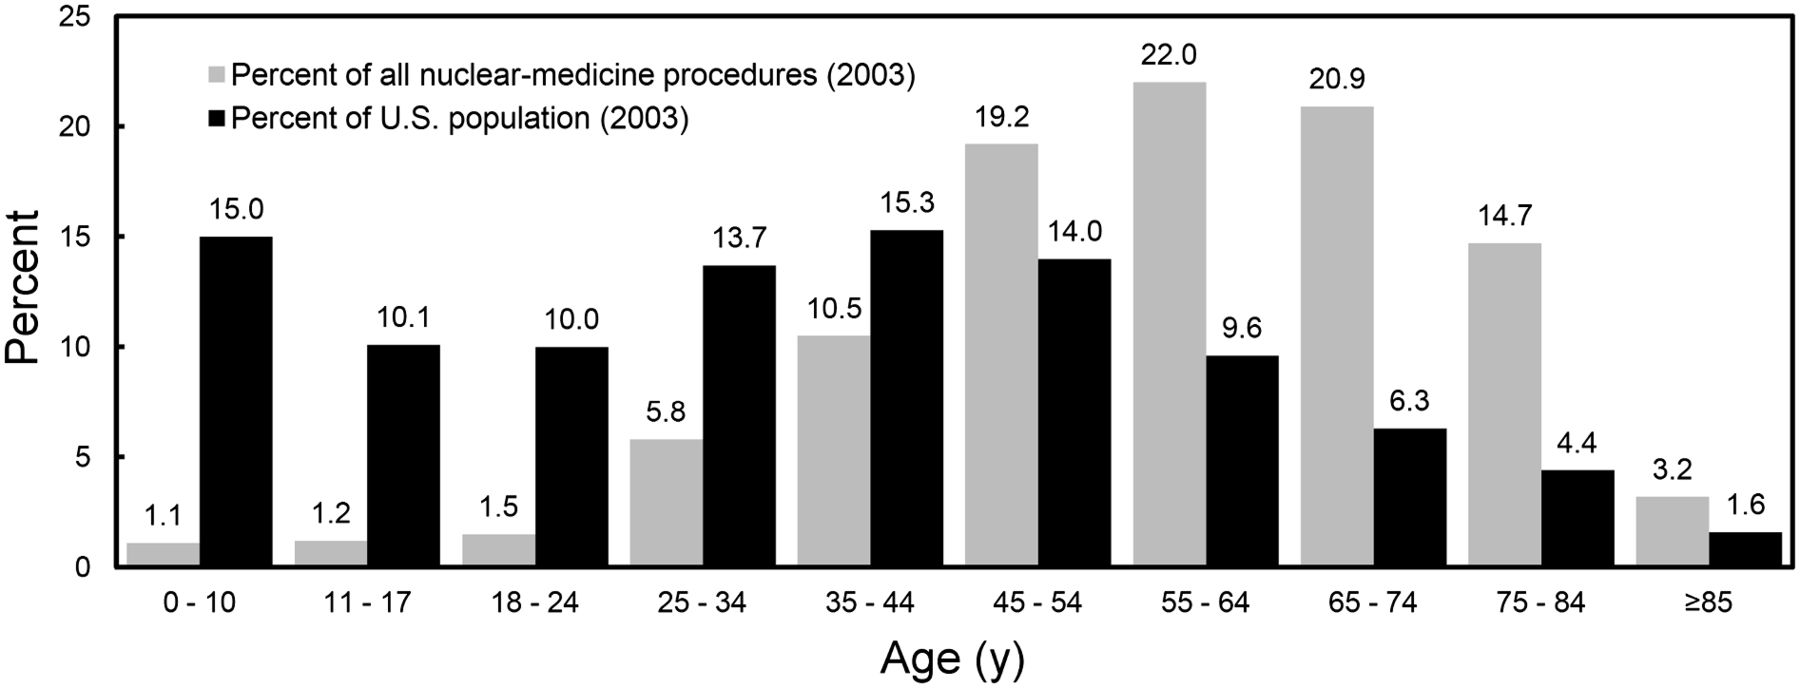
- FIGURE 7.
Age stratification of nuclear medicine examinations in 2003 snapshot showing that most patients were in 40- to 74-y age range. (Reprinted with permission of (1).)
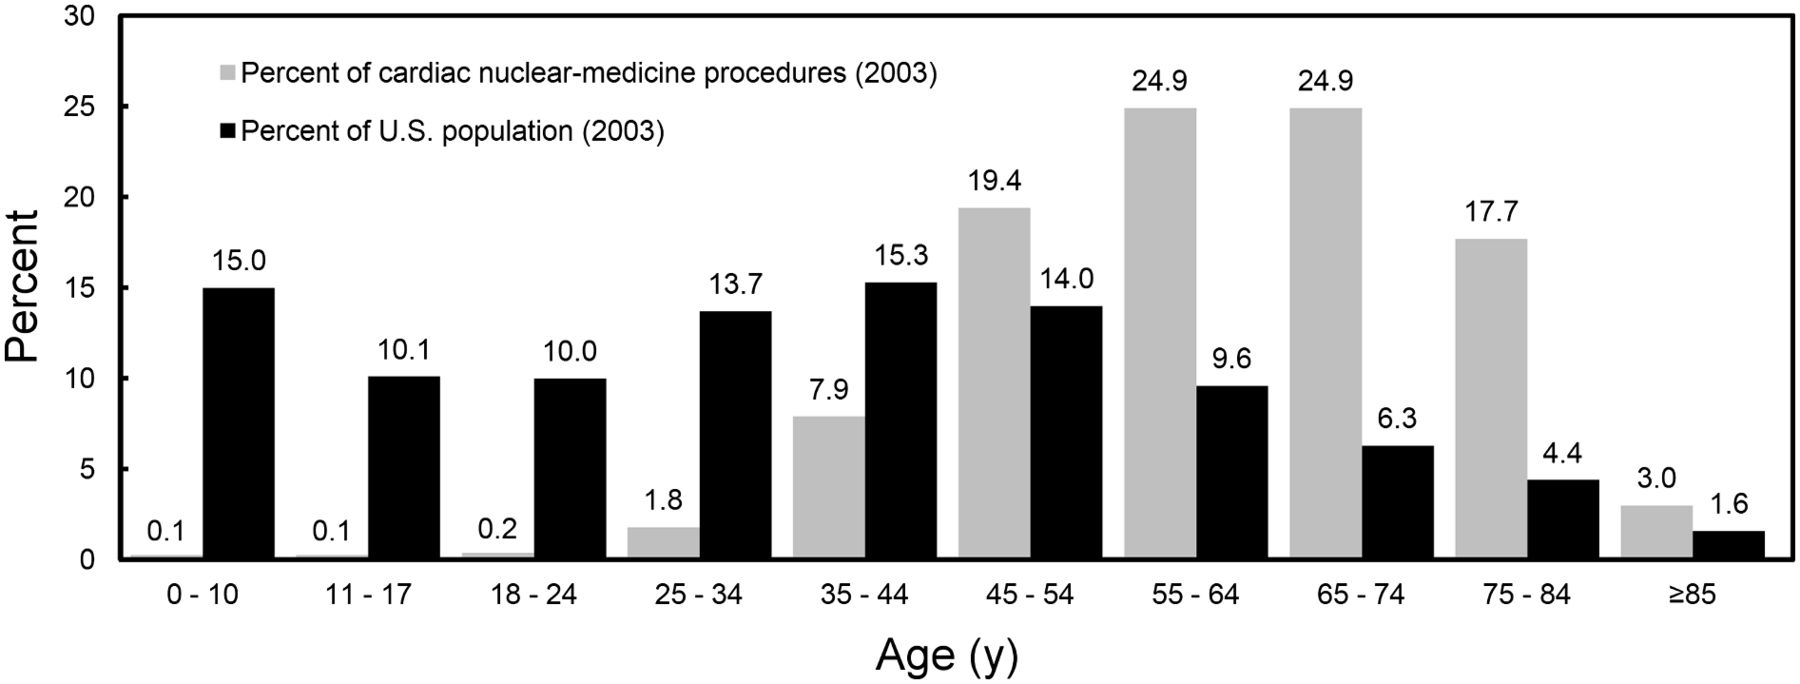
- FIGURE 8.
Age stratification of nuclear medicine cardiac examinations in 2003 snapshot showing that most patients were in 40- to 74-y age range. (Reprinted with permission of (1).)
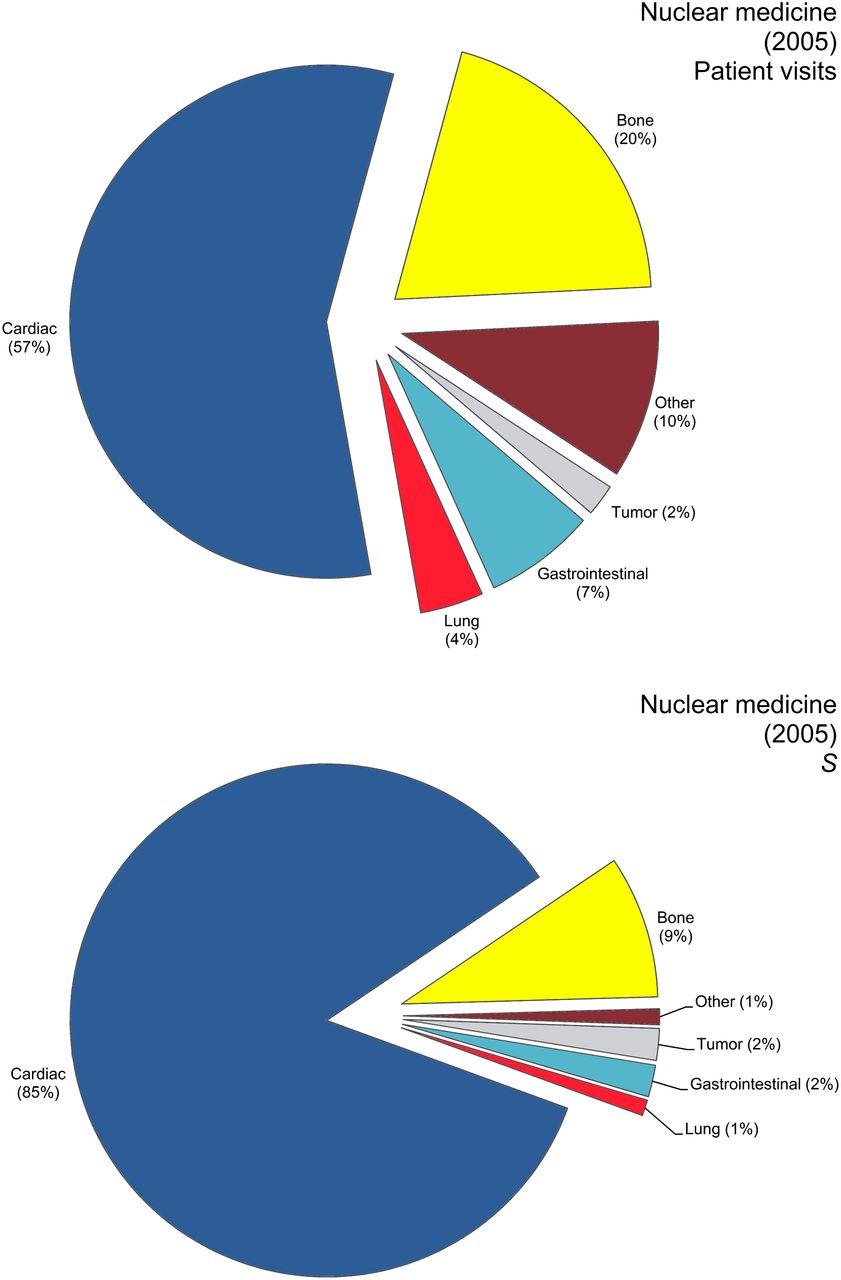
- FIGURE 9.
Charts of number of nuclear medicine patient visits and procedures in 2005 showing that most were for nuclear cardiology. S = person-Sv. (Reprinted with permission of (1).)
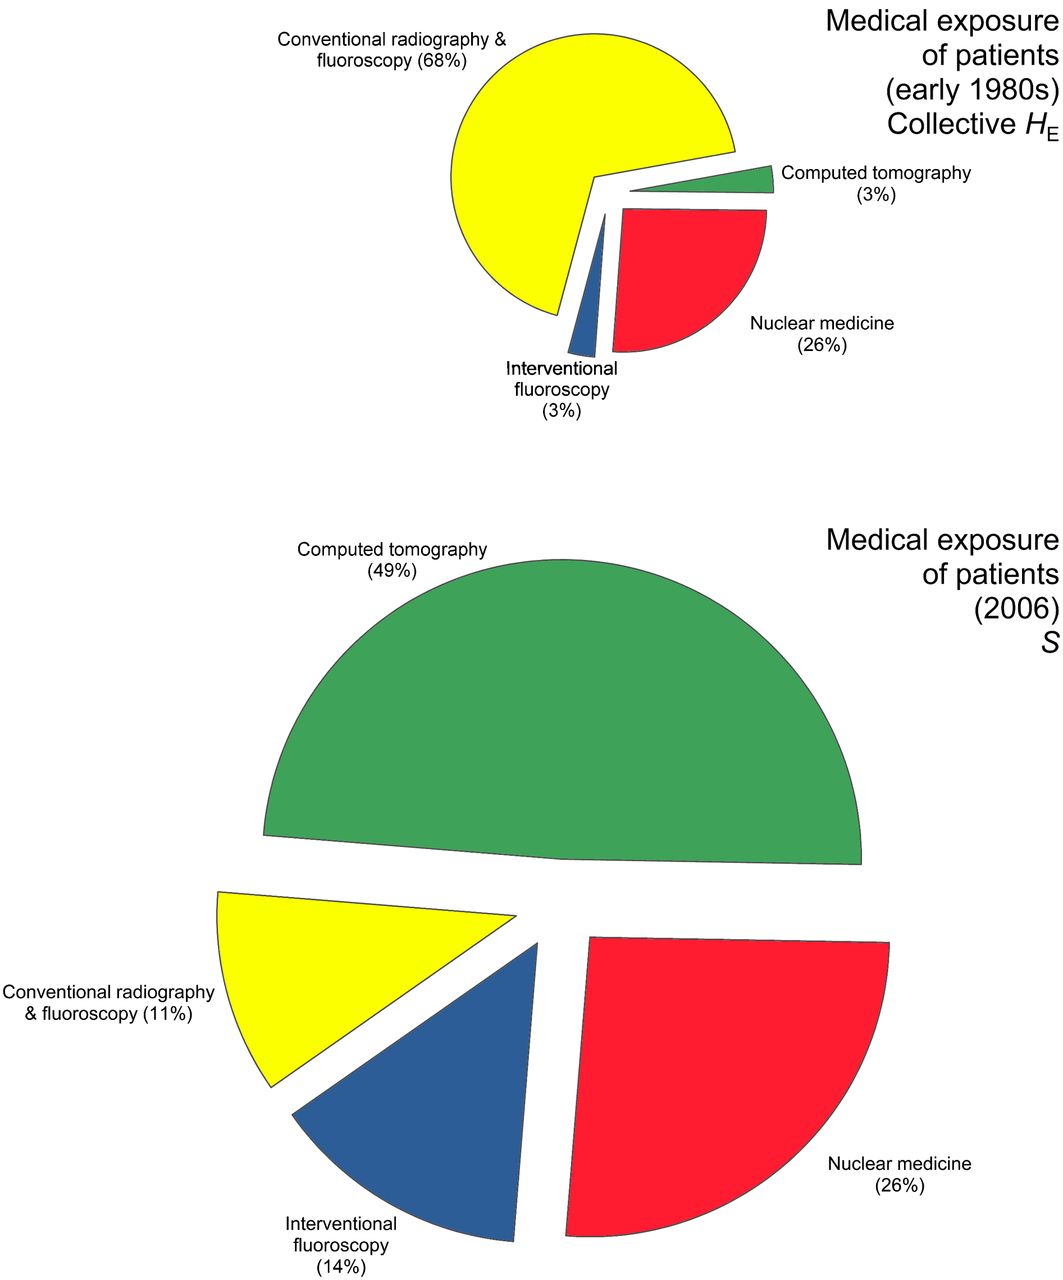
- FIGURE 10.
Comparison of medical procedures between early 1980s and 2006 showing marked increase in CT procedures from 3% to 49%. HE = effective dose equivalent; S = person-Sv. (Reprinted with permission of (1).)
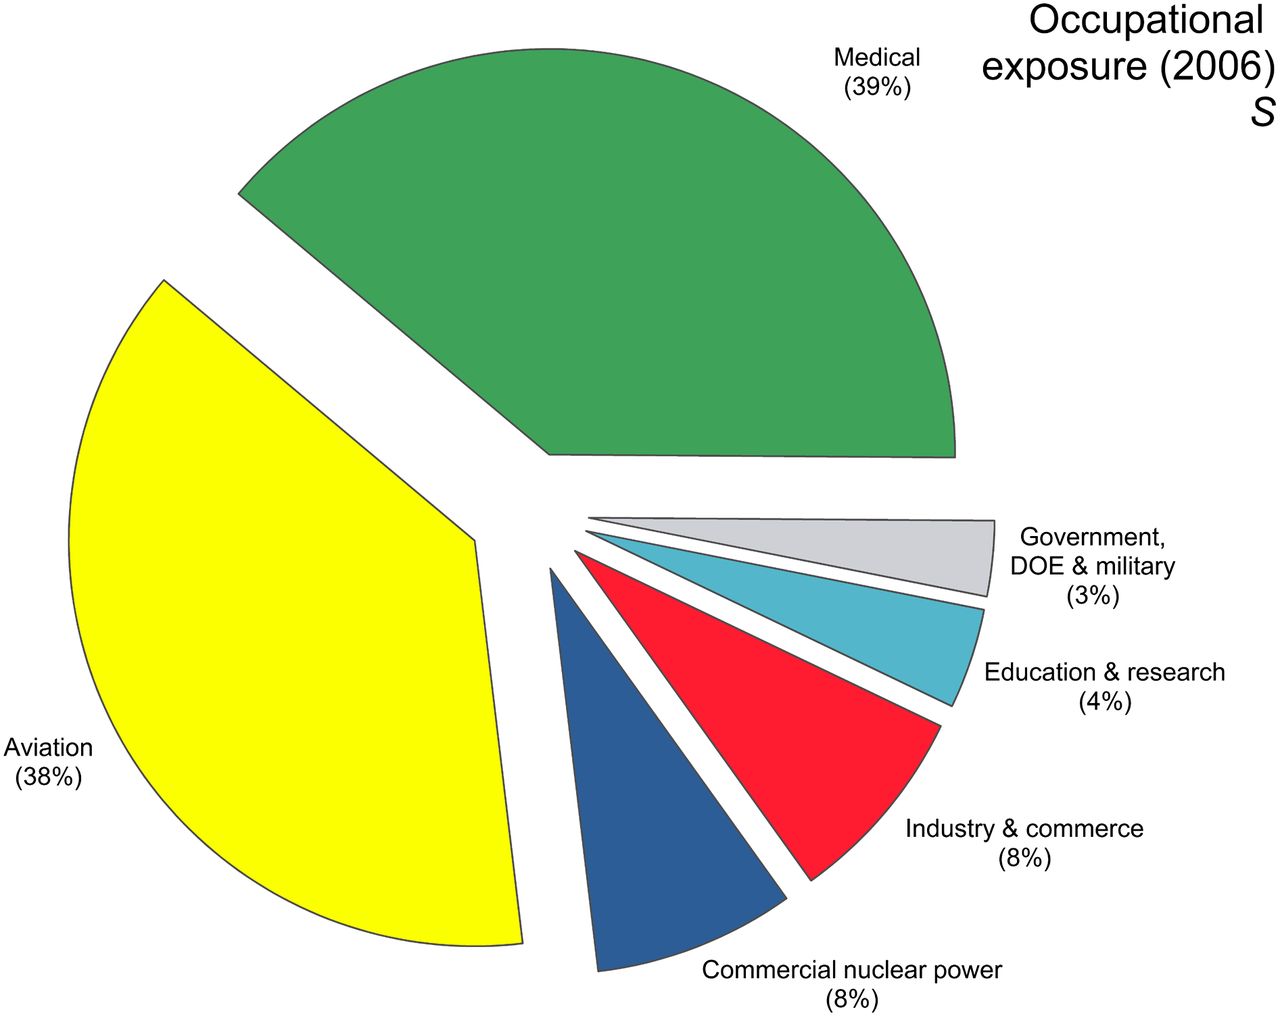
- FIGURE 11.
Chart showing contribution of medical exposure (39%) to occupationally exposed individuals. DOE = Department of Energy; S = person-Sv. (Reprinted with permission of (1).)


Tables
- TABLE 1
Basis for Person-Sv (S) and Effective Dose per Individual in United States (EUS) in 2006, with Medical Exposure Being 3 mSv
Exposure category S EUS (mSv) EExp (mSv) Ubiquitous background 933,000 3.11 3.11 Internal, inhalation (radon and thoron) 684,000 2.28 2.28 External, space 99,000 0.33 0.33 Internal, ingestion 87,000 0.29 0.29 External, terrestrial 63,000 0.21 0.21 Medical 899,000 3.00 —* CT 440,000 1.47 —* Nuclear medicine 231,000 0.77 —* Interventional fluoroscopy 128,000 0.43 —* Conventional radiography and fluoroscopy 100,000 0.33 —* Consumer 39,000 0.13 0.001–0.3† Industrial, security, medical, educational, and research 1,000 0.003 0.001–0.01† Occupational 1,400 0.005 1.1 Medical 550 0.8 Aviation 530 3.1 Commercial nuclear power 110 1.9 Industry and commerce 110 0.8 Education and research 60 0.7 Government, DOE, military 40 0.6 Total 1,870,000‡ 6.2‡ ↵* Not determined for medical category because only number of procedures is known, not number of patients exposed.
↵† Range of values for various subcategories in this category.
↵‡ Rounded values.
EExp= average effective dose for the exposed group for 2006; DOE = Department of Energy.
Table 8.1 of NCRP report 160 (1) provides more detail. Adapted with permission of (1).
- TABLE 2
Estimated CT Dose Contribution per Scan Type with Estimated Effective Dose to Patients
CT category Range for effective dose (per scan) (mSv) Effective dose (per scan) used in calculation (mSv) Head 0.9–4 2* Chest 4–18 7* Abdomen and pelvis 3–25 10† Extremity 0.1–1 0.1‡ Virtual colonography 5–15 10* Whole-body screening 5–15 10§ Calcium scoring 1–12 2‖ Angiography: head 1–10 5§ Angiography: heart 5–32 20¶# Other scans 1–10 5§ ↵* Mettler et al. (13) reported these data.
↵† American Association of Physicists in Medicine (14) reported range of 8–14 mSv. Brix et al. (15) reported 9.7 mSv for multislice CT and 10.3 mSv for single-slice CT. Selection of 10 mSv reflects current clinical practice.
↵‡ Value is lower end of range of effective doses. In absence of single citation listing actual values, selected value was based on calculated effective doses from scan techniques used in routine extremity-CT protocols.
↵§ Midpoint of range of effective doses was selected.
↵‖ American Association of Physicists in Medicine (14) reported range of 1–3 mSv; midpoint of that range was selected.
↵¶ Hurwitz et al. (16) and Javadi et al. (17) reported results from 2 large academic centers.
↵# Hausleiter et al. (18) reported that median value of 12 mSv was more representative of current practice.
Adapted with permission of (1).
- TABLE 3
Summary of Collective Effective Dose Estimates for Nuclear Medicine Procedures in 2005 Showing That Most Scans Were for Nuclear Cardiology
Category Collective effective dose (person-Sv) Percentage of total Cardiac 187,915 85.2 Bone 20,517 9.3 Tumor 3,925 1.8 Gastrointestinal 3,534 1.6 Lung 2,012 0.9 Infection 1,329 0.6 Renal 643 0.3 Thyroid 397 0.2 Brain 259 0.1 Total 220,533 (220,500) 100 Adapted with permission of (1).
- TABLE 4
Collective U.S. Exposure (Dose) from Selected Modalities and Comparison Between Early 1980s and 2006
1980/1982* (NCRP, 1989a) 2006† (NCRP report 160) Ratio (2006)/(1980/1982)‡ Procedure EUS (mSv) Collective HE (personSv)§ EUS (mSv) S (person-Sv) EUS Collective dose CT 0.016 3,660 1.47 440,000 92 120 Conventional radiography and fluoroscopy 0.36 83,700 0.33 100,000 0.9 1.2 Interventional fluoroscopy‖ 0.018 4,200 0.43 128,000 24 31 Nuclear medicine‖ 0.14 32,100 0.77 231,000 5.5 7.2 Total 0.53 123,700 3.00 899,000 5.7 7.3 ↵* Conventional radiography and fluoroscopy, CT, and interventional-fluoroscopic data apply to 1980 (U.S. population, 226.5 million); nuclear-medicine data apply to 1982 (U.S. population, 231.6 million).
↵† U.S. population, 300 million.
↵‡ U.S. population, 1.32 million in 1980 and 1.30 million in 1982.
↵§ Values differ slightly from those reported in NCRP (19) and Tables 8.2 and 8.3 of NCRP report 160 (1).
↵‖ Noted as “other” in NCRP (20).
Adapted with permission of (1).


Jump to section
- Article
- Abstract
- CHANGE IN IONIZING RADIATION EXPOSURE TO U.S. POPULATION SINCE 1980S
- PRIMARY BACKGROUND SOURCE OF IONIZING RADIATION IN UNITED STATES
- PRIMARY SOURCE OF MEDICAL EXPOSURE TO IONIZING RADIATION IN UNITED STATES
- TRENDS IN NUCLEAR MEDICINE PROCEDURES AND PATIENT EXPOSURE
- SUMMARY OF FINDINGS OF REPORT 160
- CONCLUSION
- DISCLOSURE
- Footnotes
- REFERENCES
- Figures & Data
- Info & Metrics
Related Articles
Cited By...
- Patient Shielding in Radiography
- Development of Simple Methods to Reduce the Exposure of the Public to Radiation from Patients Who Have Undergone 18F-FDG PET/CT
- Anthropomorphic left ventricular mesh phantom: a framework to investigate the accuracy of SQUEEZ using Coherent Point Drift for the detection of regional wall motion abnormalities
- Work history and radioprotection practices in relation to cancer incidence and mortality in US radiologic technologists performing nuclear medicine procedures
- Shielding in Medical Imaging and Radiation Therapy
- Randomized Controlled Trial of Radiation Protection With a Patient Lead Shield and a Novel, Nonlead Surgical Cap for Operators Performing Coronary Angiography or Intervention