


Abstract
This article reviews available radionuclide-based techniques for glomerular filtration rate (GFR) measurement, focusing on clinical indications for GFR measurement, ideal GFR radiopharmaceutical tracer properties, and the 2 most common tracers in clinical use. Methods for full, 1-compartment, and single-sample renal clearance characterization are discussed. GFR normalization and the role of GFR measurement in chemotherapy dosing are also considered.
- GFR measurement
- glomerular filtration rate
- radiopharmaceutical tracer
- GFR normalization
- technical review
Glomerular filtration rate (GFR) is used clinically as a measure of kidney function (1). GFR represents the plasma volume presented to the nephrons per unit time during urine formation. It is usually measured in milliliters per minute.
Radionuclide-based techniques allow for the rapid and reliable measurement of GFR from plasma samples taken after intravenous administration of a bolus of radionuclide-labeled tracer (2). The tracer diffuses across the capillary endothelium and between intravascular and extravascular spaces and mixes throughout the extracellular fluid volume (ECV). GFR can be measured through the quantification of plasma and standard-volume sample activity using a quality-controlled γ-counter. These techniques hold the central assumption that the tracer is cleared solely by glomerular filtration.
The British Nuclear Medicine Society (BNMS) and International Scientific Committee of Radionuclides in Nephrourology (ISCORN) have recommended guidelines for GFR measurement using radionuclide techniques in adults and children (3,4). The European Association of Nuclear Medicine (EANM) has recommended pediatric guidelines (5).
Although this article focuses on isotopic measurement of GFR, there are a range of other methods for GFR determination, details of which can be found elsewhere (6). The method chosen is a clinical decision based on accuracy, convenience for the patient, and the most appropriate measurement of renal function required for the clinical question being asked.
PRACTICALITIES OF GFR MEASUREMENT
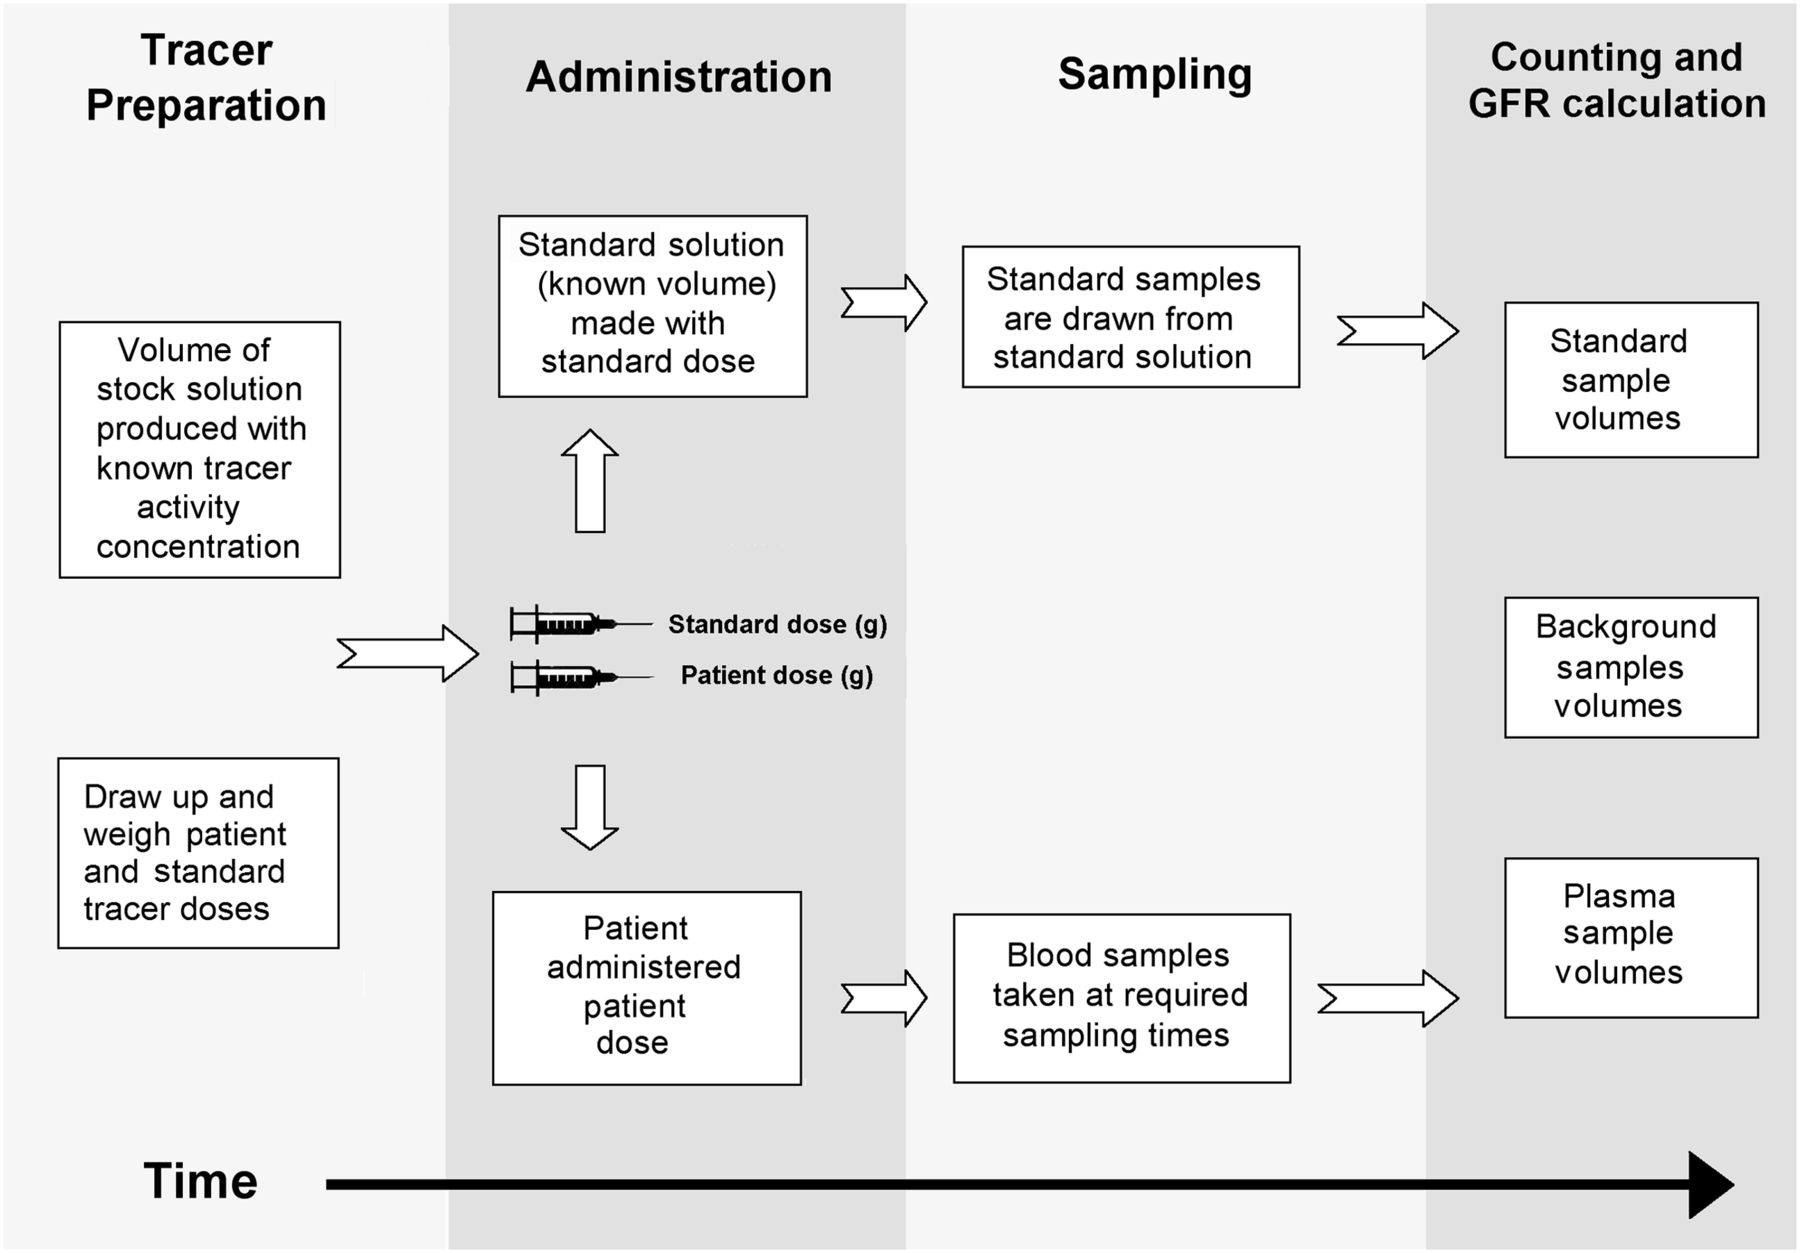
There are 4 broad stages in the GFR measurement process using radiopharmaceutical tracers: tracer preparation, administration, sampling, and counting (Fig. 1).

The 4 stages of radionuclide-based GFR studies.
Tracer Preparation
First, a stock solution of the tracer is prepared or diluted according to the manufacturer’s recommendations. The tracer is subjected to radiopharmaceutical quality control. The patient dose and the standard dose are drawn into syringes from this solution. The administered doses can be measured in terms of volume, activity, or weight, as all are from the stock solution with a common activity concentration. The quantity of tracer in the doses, the time of measurement, the weight of the patient, and the standard doses are recorded before administration. From this point onward, this article will refer only to weight for dose measurement. Several investigations can be performed using the same standard if all the patient doses are drawn from the same stock solution. The weight of the tracer is recorded for residual-dose correction purposes. The dose for administration can be scaled to patient weight or body surface area (BSA) as per usual practices in nuclear medicine (e.g., pediatric administration).
Administration
The dose is intravenously administered and the time recorded. Effort is taken to reduce any timing errors by synchronizing all watches used in the study to a common reference time. Ideally, the same clock is used throughout the study.
Care is taken to avoid extravasation (the inadvertent administration of tracer into tissue neighboring the site of venous administration), which would invalidate the study. The route of administration (e.g., by a central line) is flushed to reduce any residual activity. This is commonly done with saline. The weights of the empty syringes from the patient and standard doses are recorded for residual-dose correction purposes. If any syringe is flushed to minimize residual dose, dose cannot be corrected by weight for any residual and only the dose weight drawn into the syringe can be calculated by subtraction of the empty from the full syringe weights. It may technically be possible to correct for residual dose by using activity from pre- and postadministration/flushing calibrator readings, but uncertainty in the reading will be high because of the relatively small activity present.
Sampling
Venous blood is taken according to the required sampling schedule. The samples should ideally be taken from the limb contralateral to the administration site to reduce the risk of contamination. Suggested sample volumes are 10 mL for adults and 7 mL for children (3).
GFR measurements are avoided in patients with a preexisting plasma radiopharmaceutical tracer concentration from diagnostic studies or radionuclide therapies. The activity concentration clearance of the preexisting tracer is unknown, and accurate count subtraction cannot be performed between the preexisting and administered GFR tracer counts. Ideally, the GFR test is performed before other studies to allow for accurate counting of the plasma activity. If 51Cr-ethylenediamine tetraacetic acid (EDTA) is used in the GFR study, the plasma samples can be stored before counting for several days to let preexisting short-lived radionuclides decay.
The standard volume is prepared using the standard dose drawn from the stock solution. The standard is a known volume of water containing a known activity concentration of tracer. It is important that the volume be uniformly mixed before sampling. A standard volume of 1,000 mL is typically used, but any volume of standard can be used once it is accurately produced and manipulated.
Counting and GFR Calculation
The administered weights of the standard and patient doses, used in the calculation, are corrected for residual dose. The whole-blood samples are centrifuged to isolate the plasma. Plasma volumes are prepared in counting vials (∼1 mL). The standard samples are also prepared (∼1 mL). Any volume of sample can be used for counting (once appropriate volume corrections are applied); however, the calculation is simplified if standard and plasma samples of equal volumes are counted, because no volume correction is required to compensate for variation in sample size.
It has been recommended that each sample be counted for more than 10,000 counts to give a percentage SE of less than 1% (3). The samples should ideally be counted below any activity that induces detector dead time. Dead time is the time between subsequent detections that is required for the detector to recover to an optimal state for γ-ray detection. Dead time can be expressed as a percentage of the total counting time. Most modern γ-counters incorporate effective correction for dead times of as much as 50%. The detection efficiency decreases because of the inability of the γ-counter to effectively measure a sample’s true counting rate at high radioactive activities. Issues could arise with high plasma sample activities in patients who have undergone radionuclide-based diagnostic or therapeutic procedures. Diluting the sample, allowing it to decay, or using small aliquots avoids dead-time errors. Corrections are applied for all aliquots or dilutions involving the standard and plasma samples.
The plasma sample, standard, and background samples are counted in a γ-counter using the relevant radionuclide-specific acquisition protocol. The background samples should ideally be empty counting vials containing the same volume of water as in the plasma samples for consistency in weight and scatter attenuation. It is recommended that the mean of multiple individually counted samples be used for all patient and standard samples, if possible. Substantial deviation in counts between identical standard samples could represent errors in sample preparation or uniform mixing in the standard volume. Decay correction is applied relative to the time between counting of the patient samples and counting of the standard samples. All samples are background-corrected before use in calculations.
Greater detail on the radionuclide-based measurement of GFR can be found elsewhere (3–5).
CLINICAL CONSIDERATIONS
Some common clinical indications for a GFR study (3–5) include evaluation and monitoring of renal function in cases of chronic kidney disease, evaluation and monitoring of renal function throughout courses of nephrotoxic drugs, calculation of doses of bone marrow–toxic chemotherapeutic agents that are excreted through glomerular filtration, evaluation of renal function in potential live donors, evaluation and monitoring of single-kidney renal function and pre- and postoperative follow-up, evaluation of renal function in patients to predict or assess the need for dialysis, and evaluation of single-kidney function in combination with relative renal function measurements from static or dynamic radionuclide imaging. Contraindications to GFR studies are known to exist (3). A subset of patients with known additional fluid compartments (e.g., from edema, fluid collections, and solid-tumor volumes) invalidates the 1-compartment and single-sample GFR methods by significantly delaying mixing of the tracer throughout its distribution volume, resulting in an overestimation of GFR. Another contraindication is hyperhydration therapy with intravenous fluids.
GFR measurement provides a valuable clinical methodology to quantify renal function. Reference ranges are commonly based on BSA-normalized GFR. The reference range for GFR in adulthood is approximately 105 mL/min per 1.73 m2 of BSA and is known to decline with age (7). GFR in children steadily increases up to this GFR range over approximately the first 2 y after birth.
GFR measurements are invalid when less than approximately 30 mL/min/1.73 m2 or when the patient is younger than about 3 mo old because the kidneys are undergoing a process of structural and functional maturation (8). Cautious interpretation of GFR results is required for children younger than 2 y because the kidneys are undergoing further maturation.
RADIONUCILIDE-BASED TRACERS
Ideal Tracer Properties
An ideal tracer in GFR measurement undergoes only glomerular filtration and thus has identical plasma and urinary clearance. Ideal radiopharmaceutical tracer properties (3–5) include a low molecular weight and small molecular size to allow free filtering through the glomerular membrane, no entry into the intracellular space, no display of protein binding, no cellular metabolism, no interference with renal function, no extrarenal excretion or clearance to other organs, no tubular secretion or absorption, and no nephrotoxicity.
Inulin has the properties of an ideal tracer but is rarely used clinically (9). It is the gold standard for measuring GFR but is technically difficult to use, is expensive and time-consuming, requires multiple urine samples, and is problematic in patients with urologic disease and in children.
If a tracer undergoes any processes other than glomerular filtration, it is not ideal and plasma clearance is not equal to GFR. Examples of processes that nonideal tracers may undergo include radionuclide dissociation, metabolic degradation, plasma protein binding, tubular reabsorption, and secretion. These processes, by causing retention or clearance of the tracer, result in an inaccurate GFR measurement. These processes are independent of GFR and interfere with GFR measurement. In clinical practice, tracers with near-ideal properties are used to overcome the difficulty and impracticality of using an ideal tracer.
Although no commercially available tracer exhibits ideal properties, some come close. Two of the most frequently used tracers for GFR measurement are 51Cr-EDTA (10) and 99mTc-diethylenetriaminepentaacetic acid (DTPA) (11). Both have been reported to be reliable for GFR measurements greater than 30 mL/min (3). Small systematic differences have been observed in comparisons of the clearance of 51Cr-EDTA and 99mTc-DTPA (12). Suggested maximum administered and effective doses (5,13) are shown in Table 1.
Maximum Suggested Adult and Pediatric Administered and Effective Doses Relating to Undergoing GFR Measurement Study with 51Cr-EDTA and 99mTc-DTPA
51Cr-Labeled EDTA
51Cr-EDTA is recommended by the EANM (5) and BNMS (3). It is considered a standard radiopharmaceutical for GFR measurement in Europe but is not commercially available in the United States. 51Cr has a relatively long half-life of 27.7 d, allowing more time between the drawing and counting of the samples. Disadvantages with 51Cr-EDTA include its expense and the associated storage of 51Cr waste. Another potential problem is the reported tubular reabsorption of 51Cr-EDTA (14). A practical advantage for 51Cr-EDTA studies is that any plasma samples with an existing 99mTc concentration can be left to decay until no 99mTc remains before processing.
99mTc-Labeled DTPA
99mTc-DTPA has become a standard GFR tracer in Europe and the United States and has been recommended by the BNMS, ISCORN, and EANM (3–5). It has an advantage in that it can be produced with a 99Mo/99mTc generator already in use for diagnostic work, thus reducing expense. It has a disadvantage in that processing is required within approximately 24 h of taking the plasma samples because of sample decay (99mTc has a 6-h half-life).
Radiopharmaceutical Quality Control
The extent of radionuclide dissociation (before and after administration), protein binding, and tubular reabsorption may not be predictable, leading to potential imprecision and bias (14) and inaccurate calculation of GFR.
Quality control measurements are performed for all radiopharmaceutical tracers to minimize or quantify imprecision and bias (15). Because 99Mo/99mTc generators and chelating kits are not internationally standardized, GFR comparisons among different geographic regions are difficult (14).
CLEARANCE CHARACTERIZATION
GFR Introduction
Plasma clearance has widely been pragmatically considered to be biexponential, although this does not exactly represent the underlying tracer kinetics (16,17). The biexponential model views the process as consisting of 2 distinct compartments. It assumes fixed flow rates between constituent compartments as shown in Figure 2, where the notation kij is used to represent flow between successive compartments. The biexponential form is as follows:

Two- and 3-compartment models with respective rate constants, kij. K10 is taken to be GFR clearance. Two-compartment model views compartment 1 as intravascular volume and compartment 2 as extravascular volume. Compartment 3 is considered to be present in patients with known third fluid compartments.
Figure 3A shows an example 9-sample clearance for a given dose of 99mTc-DTPA with a fitted biexponential curve. The unit of counts per minute or total counts is commonly used in GFR measurement calculations.
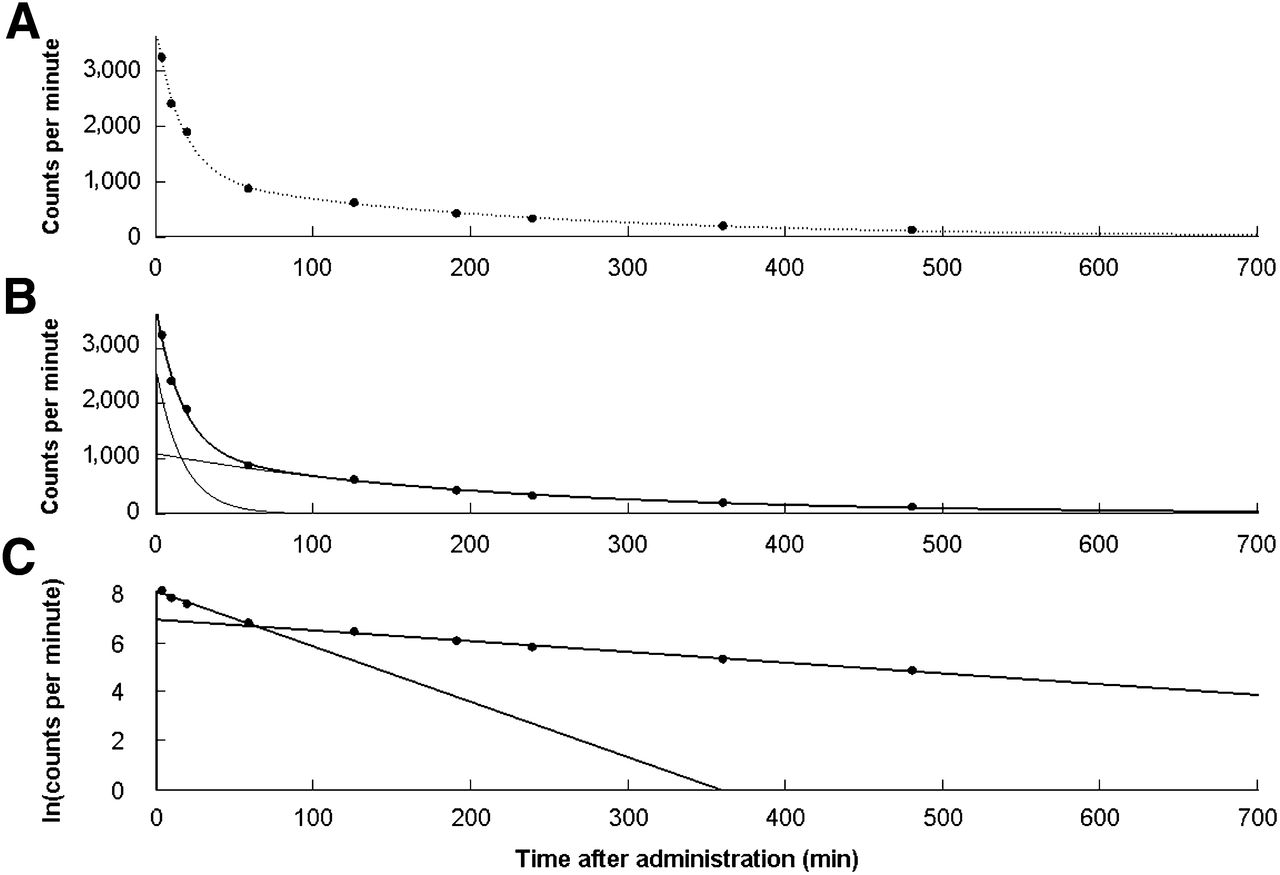
Example of 9-sample (5, 10, 20, 60, 120, 180, 240, 360, and 480 min) plasma clearance for a given dose of 99mTc-DTPA. (A) Plot of plasma sample counting rate vs. time (black dots) with fitted biexponential curve. (B) Part A with individual early and late exponential curves. (C) Linear fits for natural logarithm of early and late exponentials.
A temporarily high phase of clearance can be seen as an initial steep slope in Figure 3A. This early phase or exponential is considered to represent diffusion of the tracer between the intra- and extravascular fluid volumes. During this phase, there is a temporary high concentration of tracer in the intravascular fluid volume and hence higher clearance. The tracer has not yet fully mixed in the ECV.
Figure 3B shows the compartmental clearance curves, determined from the biexponential fit to the data in Figure 3A, for the intra- and extravascular fluid volumes assumed by the 2-compartment model. Each curve contributes to the total area under the curve (AUC).
After mixing has occurred between the 2 compartments, the slope of the clearance reflects solely renal clearance. This is known as the late phase or terminal exponential.
GFR can be calculated with the following fundamental definition (3–5):
Third-Compartment Patients
Patients with additional fluid compartments due to certain pathologic conditions can be considered to have compartment 3 in Figure 2. This additional compartment can invalidate some GFR studies because it affects the kinetics of plasma clearance from the intravascular volume. This factor would technically make the plasma clearance a multiexponential (>2 compartments) process, invalidating any model that assumes biexponential clearance.
One-Compartment Characterization
One-compartment characterization is the clinical workhorse for GFR measurement. Only the late exponential is characterized, and published corrections can be used to compensate for the missing early-compartment AUC. The method has the advantage of requiring only 2–4 samples in order to calculate the GFR; characterization of the full clearance, which would require more samples, is not needed.
One-compartment–based GFR measurement relies on the determination of GFR, using Equation 2, with coefficients A and B in Equation 1 being set to zero. Between 2 and 4 samples are recommended (2–5 h after administration) to calculate the AUC. This method is referred to as the slope-intercept method.
The intercept of the late exponential is interpreted as the instantaneous concentration of the tracer at the time of injection; instantaneous mixing is assumed because the early exponential is ignored. The intercept of the late exponential in Figure 3C can be calculated by linear regression.
A virtual volume is considered in the 1-compartment model to represent a theoretic volume of distribution for the tracer. This can be considered to be the volume of distribution. Presenting the plasma sample counts as a percentage of the standard counts allows the determination of this late-compartment AUC through the following relationship, where the intercept is in natural units:
Taking the standard volume to be 1 L simplifies the determination of the ECV in liters:
The half-clearance time, T0.5, is commonly reported with the slope-intercept–measured GFR. This is the required time for the late exponential curve to fall to half the intercept value. It is defined as follows:
Early-Compartment Correction
GFR is systematically overestimated because of the absent AUC from the early compartment. The overestimation is negligible for low renal function but increases nonlinearly with higher function. This overestimation can be corrected using various published corrections. The quadratic Bröchner-Mortensen and linear Chantler corrections (2 separate Chantler corrections exist) have been recommended (4). The Bröchner-Mortensen has been preferred (3). The corrections are as follows:
Bröchner-Mortensen Correction.
In adults (16),
Chantler Correction.
In adults and children (18),
BNMS Correction (3).
The BNMS recommends the averaged form of Bröchner-Mortensen correction for both adults and children. It is as follows:
Reliability and Reproducibility of 1-Compartment Characterization.
The degree of reliability and reproducibility of multiple GFR measurements calculated by 1-compartment methods is of importance to the clinical decision being made by the study referrer. Various compounding physiologic and technical factors affect study reliability and reproducibility.
There is a distinction between the 2 commonly considered coefficient of variation–based measures of statistical dispersion in GFR measurements. The first represents the population SD, in which variability between repeated measurements in the same subject is suggested to be larger than the measurement errors (3).
The second coefficient of variation represents the repeatability of the measurements. Some work (19) has studied the reliability of GFR measurements in a healthy group of patients (no third spaces) by examining the coefficient of variation of scaled GFR measurements. The coefficient of variation of GFR/BSA was shown to be between 10% and 25% for the participating centers. A coefficient of variation of approximately 10% provides an ideal benchmark for reliability in GFR measurements.
Single-Sample Characterization
Single-sample GFR measurement has been recommended for routine use (4,5). Various methods exist for measurement in adult and pediatric patients (20,21).
Single-sample characterization methods of GFR calculation are based on empiric relationships relating an apparent tracer volume (Vt) with various GFR regression equations. The apparent tracer volume of distribution is the administered dose divided by the plasma concentration at the sampling time. No AUC corrections, unlike for 1-compartment characterization, are required.
Some have recommended that for quality control, single-sample characterization be used for 1-compartment GFR measurement samples (22). Two recommended single-sample methods are shown below.
Watson-Modified Method of Christensen and Groth.
The Watson-modified method of Christensen and Groth (23,24) has been recommended by ISCORN (4) for GFR measurement for a sample drawn between 180 and 300 min after administration. This method relies on a modified version of a previously published equation for single-sample measurement of clearance. Clearance for a plasma sample drawn between 180 and 300 min after administration can be represented in quadratic form:
Method of Ham and Piepsz.
The EANM has recommended (5) the Ham and Piepsz pediatric single-sample method (25). This requires a sample taken between 110 and 130 min after administration. The empirically determined relationship between clearance and the apparent tracer volume is as follows:
A correction is provided to account for variations in the time of sampling around 120 min (110- to 130-min window). The correction is as follows:
Full Clearance Characterization
Full characterization of clearance requires a schedule of sampling that fully characterizes the clearance curve. These schedules generally have an increased frequency of sampling after administration to adequately characterize the early-compartment clearance as shown in Figure 3B. Different sampling schedules have been suggested (BNMS biexponential fit (3): 5, 10, 15, 30, 45, 60, 90, 120, 180, and 240 min after administration; ISCORN (4): 5, 10, 15, 20, 30, 40, 60, and 90 min). Optimized biexponential 5- and 7-sample schedules have also been published (26). The GFR is determined by calculating the AUC of the full clearance curve for an administered dose using Equation 2. Assorted mathematic methods can be used clinically to calculate the AUC with varying levels of accuracy (27).
Although full clearance characterization is the most accurate method for GFR measurement, such characterization is rarely performed because of the onerous requirements on patients and clinical resources.
The single-sample and 1-compartment methods are invalidated in a subset of patients with third compartments (28,29), which are known to introduce errors into the GFR measurement as demonstrated in Figure 2. Full clearance characterization is unaffected by such conditions but has the obvious disadvantage of requiring more samples to be taken for the study. Full clearance has been recommended for this subset of patients (3).
GFR NORMALIZATION
The final GFR results can be considered the raw or preliminary GFR. GFRNON was defined earlier as the raw 1-compartment GFR before application of the AUC correction. The definition of GFRNON is now being expanded to include raw GFR resulting from the single-sample and full-characterization methods.
GFRNON is commonly normalized to remove interpatient variation attributable to differences in renal mass. Normalized GFR plays an important role in defining reference ranges with age across patient physical demographics.
GFR normalized to BSA is widely used clinically, but its physiologic relevance has been questioned (30), compared with ECV, which has a better dimensional relationship (volume-based) to GFR (31). Although ECV is rarely used, it has been shown to be superior to BSA, especially in pediatric patients (32,33), but has low uptake in clinical use.
The BSA and ECV normalizations are, respectively, performed as follows:
Formulas have been published for ECV (32) and BSA formula calculation. There is also a method (19) that does not require direct estimation of ECV from a formula involving height and weight. This method uses a 1-compartment characterization correction on the half-clearance time that converts it directly to ECV-scaled GFR (GFR/ECV).
Two popular BSA estimation methods are the DuBois BSA formula for adults (34):
For 1-compartment characterization, it is important to perform BSA normalization before applying the quadratic Bröchner-Mortensen correction for the missing early-compartment correction (10). The Bröchner-Mortensen correction is known to have the effect of overestimating GFR for patients with a GFR of above 80 mL/min/1.73 m2, particularly for patients with a BSA below 1 m2, such as in children.
Reporting of an additional GFR value known as absolute GFR has been recommended for 1-compartment GFR measurements (3). This additional value is the GFR value (mL/min) obtained after reversing the normalization following correction for the missing early compartment. It is the absolute or true raw GFR, which cannot be directly calculated using 1-compartment characterization.
GFR AND CHEMOTHERAPY
Chemotherapeutic agents, such as carboplatin, are eliminated from the body mainly via glomerular filtration. GFR correlates strongly with renal clearance of carboplatin (36). Consequently, it is essential to individualize chemotherapy dosages during courses of treatment to the patient’s underlying renal function to optimize treatment. Submaximal chemotherapy dosages can be avoided for patients with high carboplatin clearance and can also prevent overdosing of patients with reduced clearance.
Significant drops in GFR can occur during the course of treatment because of the nephrotoxic nature of the therapies, and these drops can be chronic or acute. Chemotherapy doses are hence based on the patient’s GFR results. The GFR-based Calvert formula (37), which is commonly used clinically for chemotherapy dosing, is as follows:
Equation 19 shows the direct relationship between GFR and carboplatin dose. Errors in the GFR measurement directly transfer to the chemotherapy dose, highlighting the importance of accurate GFR studies.
Accurate GFR measurement is important for monitoring renal function throughout courses of nephrotoxic drugs and is vitally important in patients with known additional fluid compartments, because 1-compartment and single-sample characterization can produce erroneous GFR measurements. These additional compartments, which invalidate GFR measurements, may themselves be the targets of the chemotherapy. Careful consideration is required for this subgroup of patients.
CONCLUSION
Radionuclide-based GFR measurement—a valuable tool to quantify renal function—can fill a role in the reliable and accurate measurement of function when its quantification is equivocal. GFR measurement has a role in monitoring renal function in live renal donors, in patients with renal disease progression, and throughout courses of treatment with nephrotoxic drugs. Careful tracer production, administration, sampling, and calculation methodologies are imperative to accurate GFR measurements as recommended by published guidelines.
DISCLOSURE
No potential conflict of interest relevant to this article was reported.
Acknowledgments
We thank Amy Bellwood for assistance with the illustrations.
Footnotes
↵* NOTE: FOR CE CREDIT, YOU CAN ACCESS THIS ACTIVITY THROUGH THE SNMMI WEB SITE (http://www.snmmi.org/ce_online) THROUGH JUNE 2015.
Published online May 8, 2013.
REFERENCES
- Received for publication February 5, 2013.
- Accepted for publication April 22, 2013.


Jump to section
Related Articles
Cited By...
- STUDY TO ASSESS ASSOCIATION OF C-REACTIVE PROTEIN WITH NEPHROPATHY IN PEOPLE LIVING WITH TYPE 2 DIABETES MELLITUS
- Validation of Glomerular Filtration Rate Measurement with Blood Sampling from the Injection Site
- Validation of a routine two-sample iohexol plasma clearance assessment of GFR and an evaluation of common endogenous markers in a rat model of CKD
- Comparison of Performance of Improved Serum Estimators of Glomerular Filtration Rate (GFR) to 99mTc-DTPA GFR Methods in Patients with Hepatic Cirrhosis
- Radionuclides in Nephrourology, Part 1: Radiopharmaceuticals, Quality Control, and Quantitative Indices