
Main menu

  • Home
  • Content
    • Current
      • JNMT Supplement
    • Ahead of print
    • Past Issues
    • Continuing Education
    • JNMT Podcast
    • SNMMI Annual Meeting Abstracts
  • Subscriptions
    • Subscribers
    • Rates
    • Journal Claims
    • Institutional and Non-member
  • Authors
    • Submit to JNMT
    • Information for Authors
    • Assignment of Copyright
    • AQARA Requirements
  • Info
    • Reviewers
    • Permissions
    • Advertisers
    • Corporate & Special Sales
  • About
    • About Us
    • Editorial Board
    • Contact Information
  • More
    • Alerts
    • Feedback
    • Help
    • SNMMI Journals
  • SNMMI
    • JNMT
    • JNM
    • SNMMI Journals
    • SNMMI

User menu

  • Subscribe
  • My alerts
  • Log in
  • My Cart

Search

  • Advanced search
Journal of Nuclear Medicine Technology
  • SNMMI
    • JNMT
    • JNM
    • SNMMI Journals
    • SNMMI
  • Subscribe
  • My alerts
  • Log in
  • My Cart
Journal of Nuclear Medicine Technology

Advanced Search

  • Home
  • Content
    • Current
    • Ahead of print
    • Past Issues
    • Continuing Education
    • JNMT Podcast
    • SNMMI Annual Meeting Abstracts
  • Subscriptions
    • Subscribers
    • Rates
    • Journal Claims
    • Institutional and Non-member
  • Authors
    • Submit to JNMT
    • Information for Authors
    • Assignment of Copyright
    • AQARA Requirements
  • Info
    • Reviewers
    • Permissions
    • Advertisers
    • Corporate & Special Sales
  • About
    • About Us
    • Editorial Board
    • Contact Information
  • More
    • Alerts
    • Feedback
    • Help
    • SNMMI Journals
  • Watch or Listen to JNMT Podcast
  • Visit SNMMI on Facebook
  • Join SNMMI on LinkedIn
  • Follow SNMMI on Twitter
  • Subscribe to JNMT RSS feeds
Research ArticleIMAGING

Effect of Prefiltering Cutoff Frequency and Scatter and Attenuation Corrections During Normal Database Creation for Statistical Imaging Analysis of the Brain

Hideo Onishi, Yuki Matsutake, Norikazu Matsutomo, Yuji Kai and Hizuru Amijima
Journal of Nuclear Medicine Technology September 2011, 39 (3) 231-236; DOI: https://doi.org/10.2967/jnmt.110.079871
Hideo Onishi
  • Find this author on Google Scholar
  • Find this author on PubMed
  • Search for this author on this site
Yuki Matsutake
  • Find this author on Google Scholar
  • Find this author on PubMed
  • Search for this author on this site
Norikazu Matsutomo
  • Find this author on Google Scholar
  • Find this author on PubMed
  • Search for this author on this site
Yuji Kai
  • Find this author on Google Scholar
  • Find this author on PubMed
  • Search for this author on this site
Hizuru Amijima
  • Find this author on Google Scholar
  • Find this author on PubMed
  • Search for this author on this site
  • Article
  • Figures & Data
  • Info & Metrics
  • PDF
Loading

Article Figures & Data

Figures

  • Tables
  • FIGURE 1.
    • Download figure
    • Open in new tab
    • Download powerpoint
    FIGURE 1.

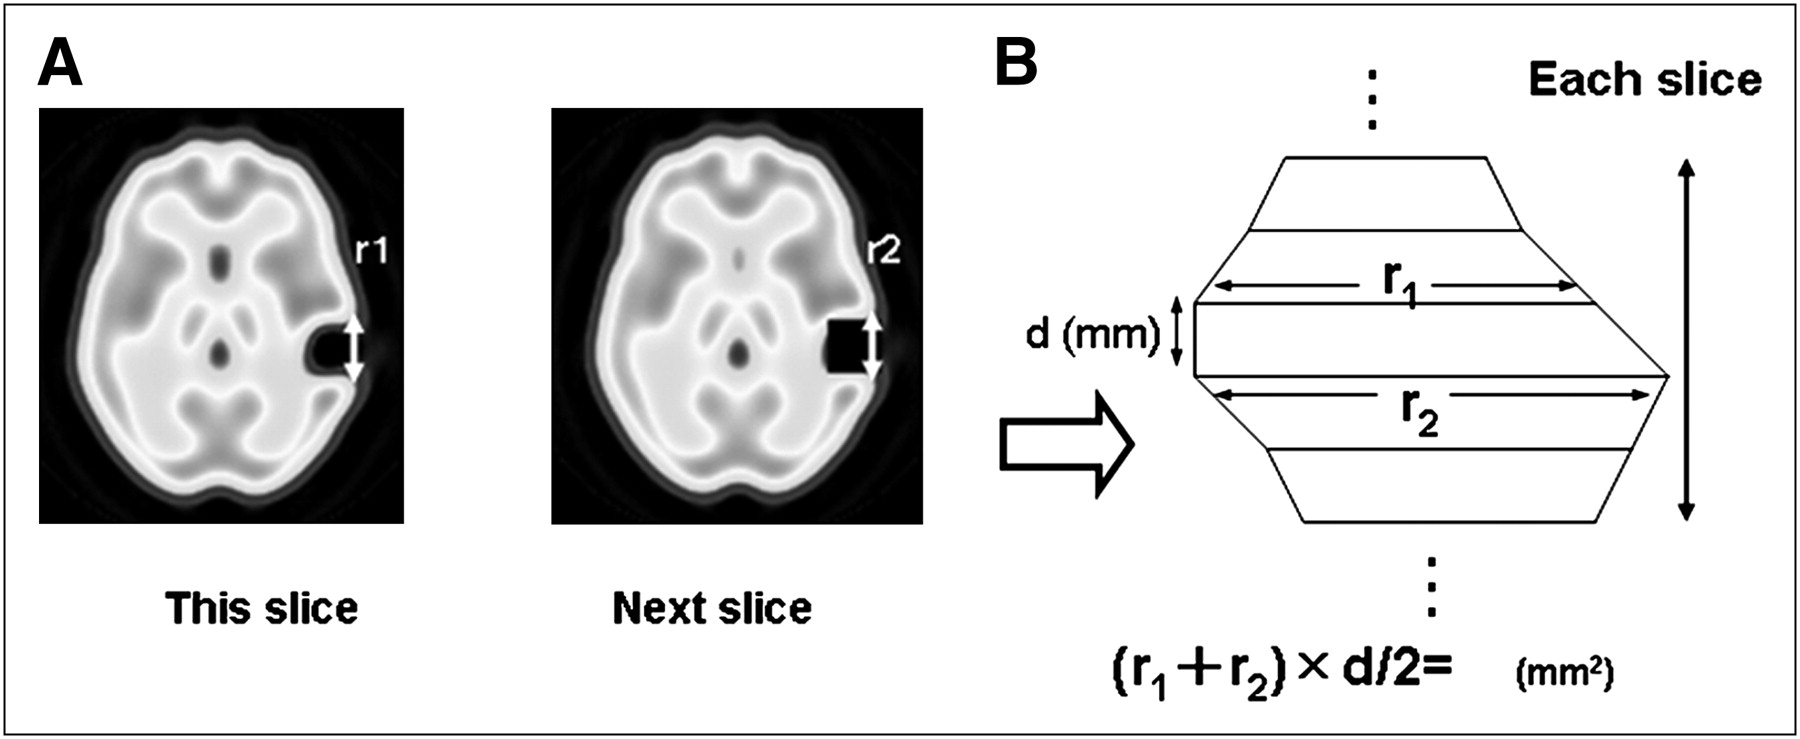
    Method of determining area of hypoperfused region extracted from patient data to brain surface from area of trapezoidal shape. We calculated distance (r1; mm) of hypoperfused lesion and distance (r2; mm) of next slice using slice thickness (d) in 3 slice images. (A) Distance r1 (mm) measured on surface of nonperfused region in each SPECT slice after anatomic standardization (voxel size, 2.25 mm). (B) Area determined using distances r1 and r2 extracted to brain surface and trapezoidal formula for trapezoidal approximation.

  • FIGURE 2.
    • Download figure
    • Open in new tab
    • Download powerpoint
    FIGURE 2.

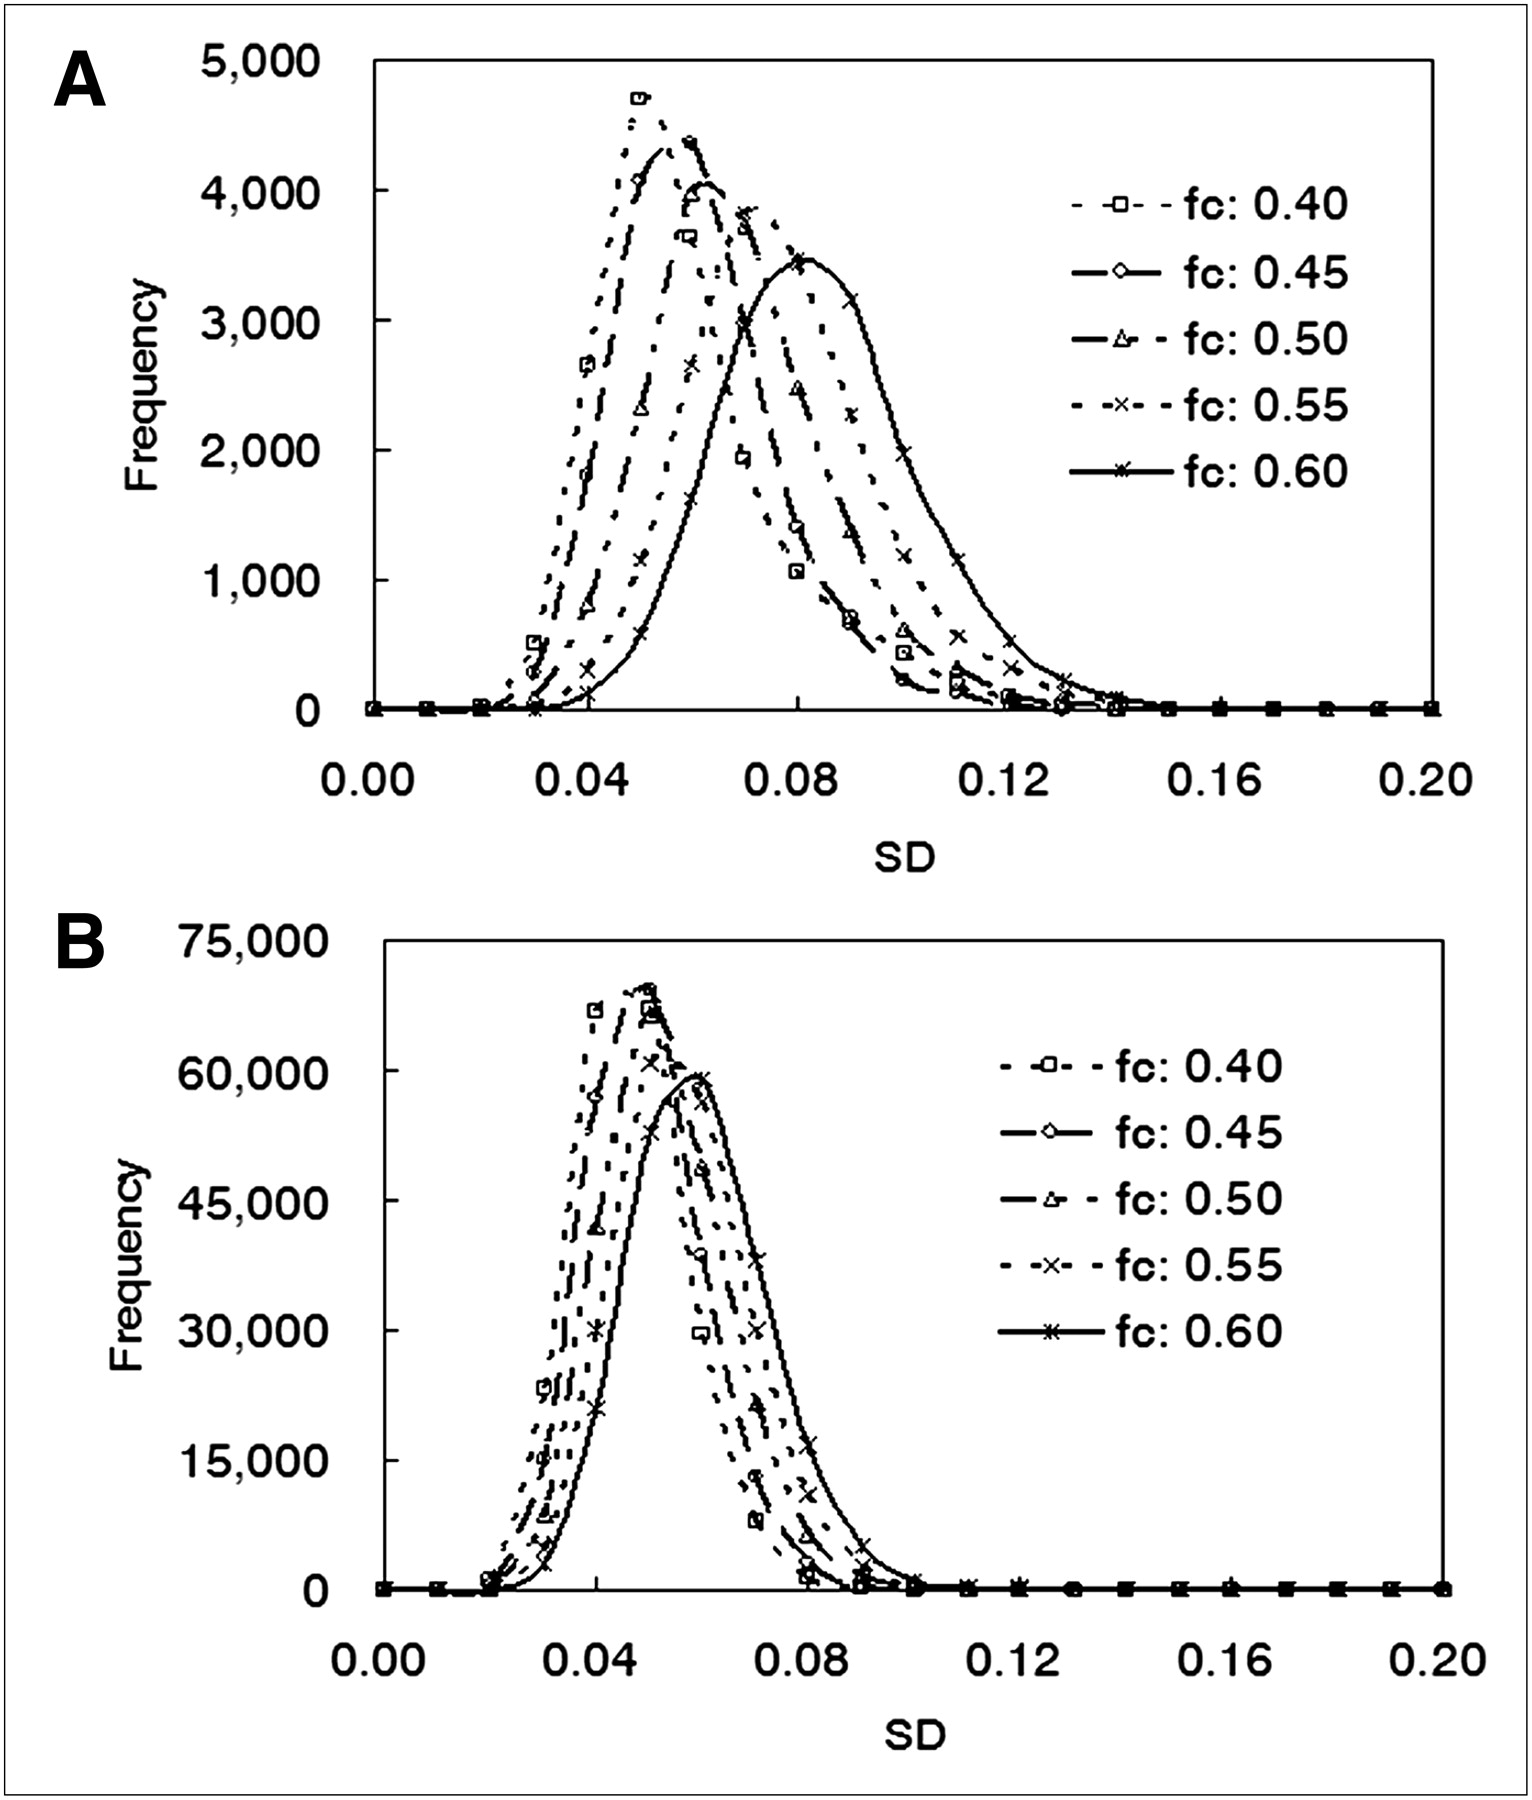
    3D-SSP (A) and eZIS (B) histograms of SD in normal database obtained at each fc of Butterworth filter. Histogram distribution of SD was generated from SD of each pixel of brain using data from all participants. Each (3D-SSP, eZIS) histogram for SD scores of normal database was obtained at different fc of Butterworth filter. Horizontal axis is SD score; vertical axis is frequency.

  • FIGURE 3.
    • Download figure
    • Open in new tab
    • Download powerpoint
    FIGURE 3.

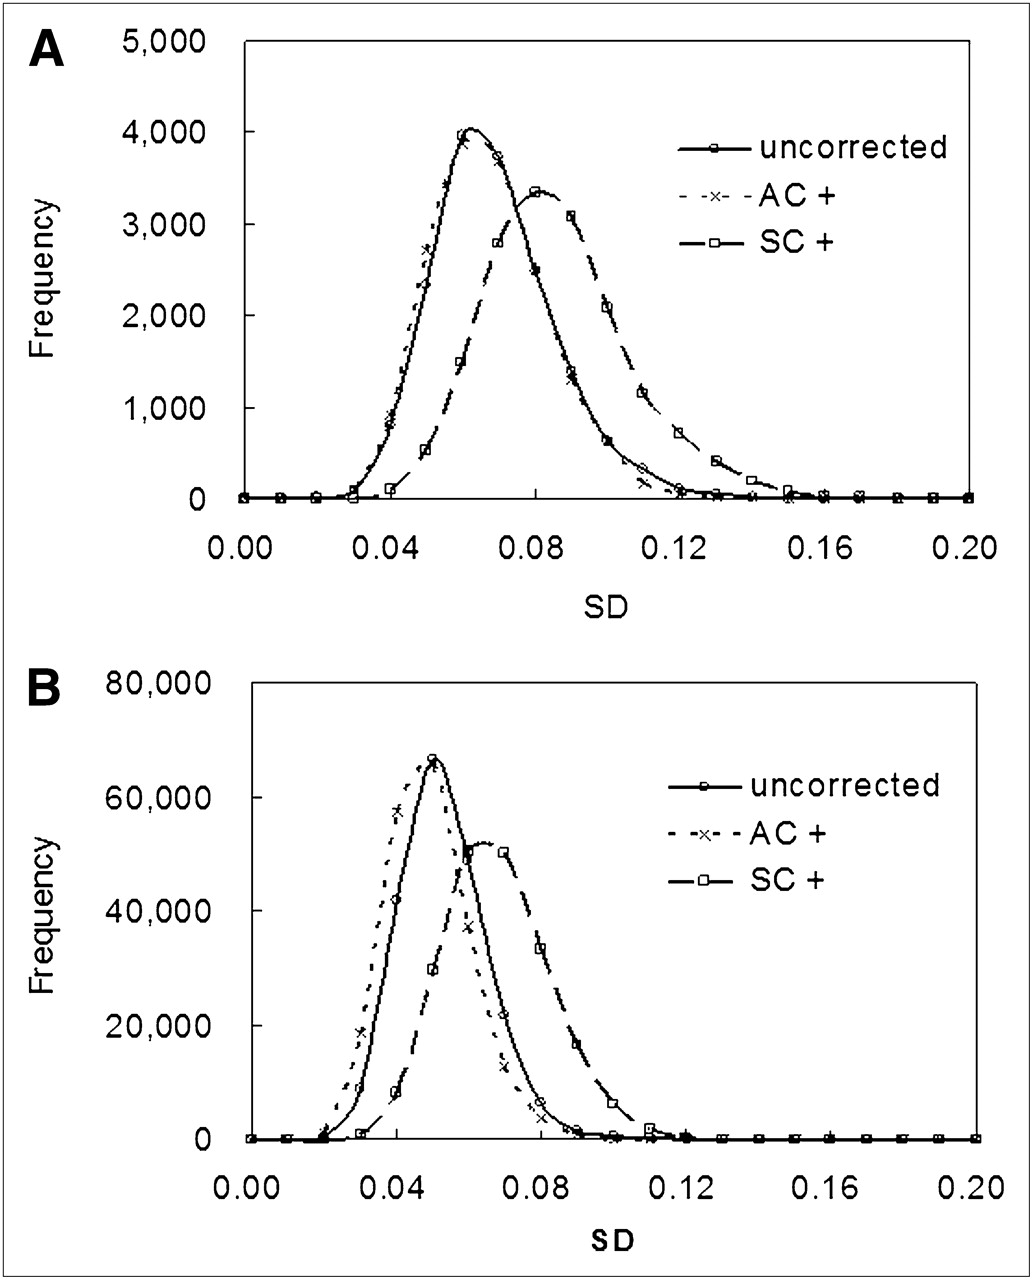
    3D-SSP (A) and eZIS (B) histograms of SD in normal database with and without correction. Each histogram of SD scores of normal database was obtained with and without scatter and attenuation correction. Horizontal axis is SD score; vertical axis is frequency. AC+ = with attenuation correction; SC+ = with scatter correction.

  • FIGURE 4.
    • Download figure
    • Open in new tab
    • Download powerpoint
    FIGURE 4.

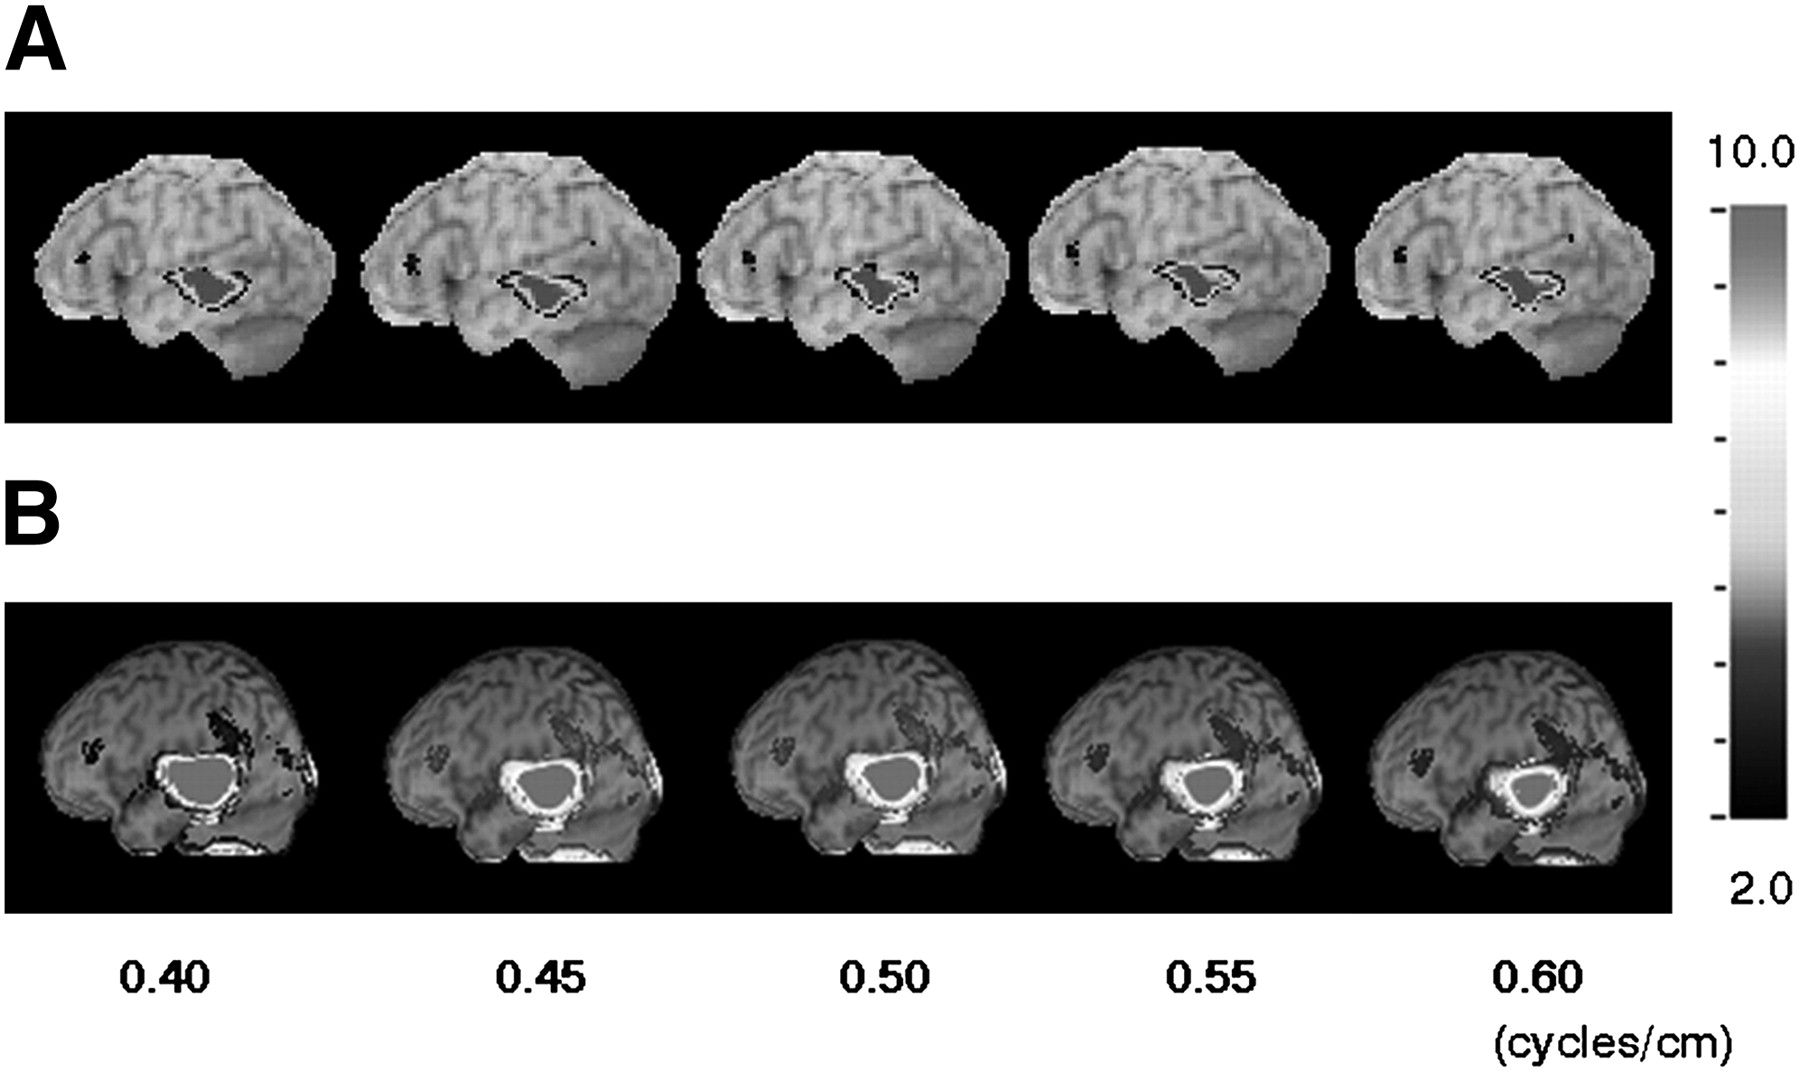
    3D-SSP (A) and eZIS (B) z score map images of left lateral brain surface when fc of Butterworth filter of normal database is changed while patient data remain constant. Pixel values are normalized to global brain, and images show decrease in z score. z score images confirm hypoperfused region. z score in each z score map image is scaled to 10.0 from 2.0.

Tables

  • Figures
    • View popup
    TABLE 1

    Variation in Average z Scores in Region of Interest at Various Butterworth Filter fc Settings

    Processing methodfc (cycles/cm)
    0.40.450.50.550.6
    3D-SSP14.5514.5212.8211.2410.17
    eZIS14.213.9113.5112.8312.24
    • View popup
    TABLE 2

    Error in Areas of Hypoperfused Region Compared with True Values

    Processing methodfc of Butterworth filter (cycles/cm)
    0.40.450.50.550.6
    3D-SSP40.2125.657.51−9.5−13.33
    eZIS70.8666.2655.3453.0941.92
    • Units are % error of measured, compared with true, region size.

    • View popup
    TABLE 3

    Evaluation of Error of Hypoperfused Region According to Differences Between Compensation Methods

    Processing methodNDB−, PD−NDB+, PD+NDB−, PD+NDB+, PD−
    ACSCACSCACSCACSC
    3D-SSP7.817.96−2.15−3.3−13.5419.27−20.58−19.79
    eZIS4.534.53−4.12−4.36−13.1710.7−27.57−23.87
    • Data are ratios. NDB− = without correction in normal database; PD− = without correction in patient data; NDB+ = with correction in normal database; PD+ = with correction in patient data.

PreviousNext
Back to top

In this issue

Journal of Nuclear Medicine Technology: 39 (3)
Journal of Nuclear Medicine Technology
Vol. 39, Issue 3
September 1, 2011
  • Table of Contents
  • About the Cover
  • Index by author
Print
Download PDF
Article Alerts
Sign In to Email Alerts with your Email Address
Email Article

Thank you for your interest in spreading the word on Journal of Nuclear Medicine Technology.

NOTE: We only request your email address so that the person you are recommending the page to knows that you wanted them to see it, and that it is not junk mail. We do not capture any email address.

Enter multiple addresses on separate lines or separate them with commas.
Effect of Prefiltering Cutoff Frequency and Scatter and Attenuation Corrections During Normal Database Creation for Statistical Imaging Analysis of the Brain
(Your Name) has sent you a message from Journal of Nuclear Medicine Technology
(Your Name) thought you would like to see the Journal of Nuclear Medicine Technology web site.
Citation Tools
Effect of Prefiltering Cutoff Frequency and Scatter and Attenuation Corrections During Normal Database Creation for Statistical Imaging Analysis of the Brain
Hideo Onishi, Yuki Matsutake, Norikazu Matsutomo, Yuji Kai, Hizuru Amijima
Journal of Nuclear Medicine Technology Sep 2011, 39 (3) 231-236; DOI: 10.2967/jnmt.110.079871

Citation Manager Formats

  • BibTeX
  • Bookends
  • EasyBib
  • EndNote (tagged)
  • EndNote 8 (xml)
  • Medlars
  • Mendeley
  • Papers
  • RefWorks Tagged
  • Ref Manager
  • RIS
  • Zotero
Share
Effect of Prefiltering Cutoff Frequency and Scatter and Attenuation Corrections During Normal Database Creation for Statistical Imaging Analysis of the Brain
Hideo Onishi, Yuki Matsutake, Norikazu Matsutomo, Yuji Kai, Hizuru Amijima
Journal of Nuclear Medicine Technology Sep 2011, 39 (3) 231-236; DOI: 10.2967/jnmt.110.079871
Twitter logo Facebook logo LinkedIn logo Mendeley logo
  • Tweet Widget
  • Facebook Like
  • Google Plus One
Bookmark this article

Jump to section

  • Article
    • Abstract
    • MATERIALS AND METHODS
    • RESULTS
    • DISCUSSION
    • CONCLUSION
    • Acknowledgments
    • Footnotes
    • REFERENCES
  • Figures & Data
  • Info & Metrics
  • PDF

Related Articles

  • No related articles found.
  • PubMed
  • Google Scholar

Cited By...

  • No citing articles found.
  • Google Scholar

More in this TOC Section

  • Early 10-Minute Postinjection [18F]F-FAPI-42 uEXPLORER Total-Body PET/CT Scanning Protocol for Staging Lung Cancer Using HYPER Iterative Reconstruction
  • Single- Versus Dual-Time-Point Imaging for Transthyretin Cardiac Amyloid Using 99mTc-Pyrophosphate
  • Monte Carlo Simulation of Characteristics of Discovery NM/CT 670 Pro SPECT System for Routinely Used Diagnostic and Therapeutic Radionuclides
Show more Imaging

Similar Articles

SNMMI

© 2025 SNMMI

Powered by HighWire