


Abstract
Uniformity testing is performed daily to ensure adequate camera performance before clinical use. The aim of this study is to assess the reliability of Beth Israel Deaconess Medical Center's locally built, centralized, Web-based uniformity analysis system by examining the differences between manufacturer and Web-based National Electrical Manufacturers Association integral uniformity calculations measured in the useful field of view (FOV) and the central FOV. Methods: Manufacturer and Web-based integral uniformity calculations measured in the useful FOV and the central FOV were recorded over a 30-d period for 4 cameras from 3 different manufacturers. These data were then statistically analyzed. The differences between the uniformity calculations were computed, in addition to the means and the SDs of these differences for each head of each camera. Results: There was a correlation between the manufacturer and Web-based integral uniformity calculations in the useful FOV and the central FOV over the 30-d period. The average differences between the manufacturer and Web-based useful FOV calculations ranged from −0.30 to 0.099, with SD ranging from 0.092 to 0.32. For the central FOV calculations, the average differences ranged from −0.163 to 0.055, with SD ranging from 0.074 to 0.24. Conclusion: Most of the uniformity calculations computed by this centralized Web-based uniformity analysis system are comparable to the manufacturers’ calculations, suggesting that this system is reasonably reliable and effective. This finding is important because centralized Web-based uniformity analysis systems are advantageous in that they test camera performance in the same manner regardless of the manufacturer.
Uniformity testing is performed daily on each γ-camera to verify its performance before it is used for clinical studies. This can be done extrinsically with a 57Co sheet source placed on the collimator surface or intrinsically with the collimators removed and a 99mTc point source. The 57Co sheet source or the 99mTc point source distributes photons homogenously over the detectors and, if the camera is performing adequately, results in a uniform flood image.
Beth Israel Deaconess Medical Center in Boston, Massachusetts, has 4 different γ-camera models from 3 different manufacturers. These cameras include a triple-head Cardius X.ACT (Digirad), a dual-head ADAC Forte (Philips Healthcare), a dual-head Precedence SPECT/CT (Philips Healthcare), and a dual-head ECAM (Siemens Healthcare). Daily uniformity floods on the Cardius X.ACT, the ADAC Forte, and the Precedence are acquired extrinsically with a 57Co sheet source for 10 million counts, and the daily uniformity floods on the ECAM are acquired intrinsically with a 0.74-MBq (20 μCi) 99mTc point source for 10 million counts.
The useful field of view (FOV) is the detector area that is used for imaging, and the central FOV is 75% of the useful FOV (1). In each of these fields of views, the integral uniformity is calculated according to the method of the National Electrical Manufacturers Association (NEMA). The integral uniformity is a measure of the pixel count deviation in the FOV and is calculated according to this formula:
Flood images have been traditionally analyzed using the manufacturers’ analysis tools, and the results of these analyses are recorded in a notebook. Many institutions still follow this practice. Beth Israel Deaconess Medical Center tests uniformity using a Web-based uniformity analysis system that was locally built by the department's physicist, Dr. Matthew Palmer. This system computes NEMA integral uniformity values in the useful FOV and the central FOV and stores the values on the system in a uniformity analysis log. The integral uniformity values for the useful FOV and the central FOV are recorded. These values should be comparable to the values obtained using the manufacturers’ analysis tools.
At Beth Israel Deaconess Medical Center, a flood image is acquired in a 256 × 256 matrix and then rebinned to a 64 × 64 matrix. These data are then smoothed and border pixels are removed to obtain the useful FOV. The useful FOV is scaled along all linear dimensions by 75% to obtain the central FOV.
The objective of this research was to assess the reliability of this Web-based uniformity analysis system by examining the differences between manufacturer and Web-based NEMA integral uniformity calculations measured in the useful FOV and the central FOV.
MATERIALS AND METHODS
Over a 30-d period, the daily uniformity floods for a Cardius X.ACT, an ADAC Forte, a Precedence, and an ECAM were analyzed using both the manufacturers’ analysis tools and the Web-based uniformity analysis system. The manufacturers’ software programs used were Prominence for the Cardius X.ACT, Pegasys for the ADAC Forte, JetStream for the Precedence, and Icon for the ECAM. The manufacturer and Web-based integral uniformity calculations measured in the useful FOV and the central FOV were recorded. The uniformity analysis tool on Prominence measured integral uniformity in only the useful FOV; thus, only the useful FOV was assessed for the Cardius X.ACT.
The discrepancies between the uniformity calculations were computed by subtracting the manufacturers’ values from the Web-based values. For each head of each camera, the mean and SD of these discrepancy datasets was computed. In addition, the integral uniformity values were graphed on scatterplots to assess the correlation between the manufacturer and Web-based datasets.
RESULTS
The average differences between the manufacturer and Web-based useful FOV calculations ranged from −0.30 to 0.099, with SD ranging from 0.092 to 0.32 (Fig. 1A). For the central FOV calculations, the average differences ranged from −0.163 to 0.055, with SD ranging from 0.074 to 0.24 (Fig. 1B).

Means (bar heights) and SD (error bars) of differences between manufacturer and Web-based calculations for useful FOV (A) and central FOV (B). AF = ADAC Forte; C = Cardius X.ACT; CFOV = central FOV; E = ECAM; H1 = head 1; H2 = head 2; H3 = head 2; P = Precedence; UFOV = useful FOV.
Because the means and SDs of the discrepancies were close to zero, there was a correlation between the manufacturer and Web-based integral uniformity calculations in the useful FOV and the central FOV over the 30-d period.
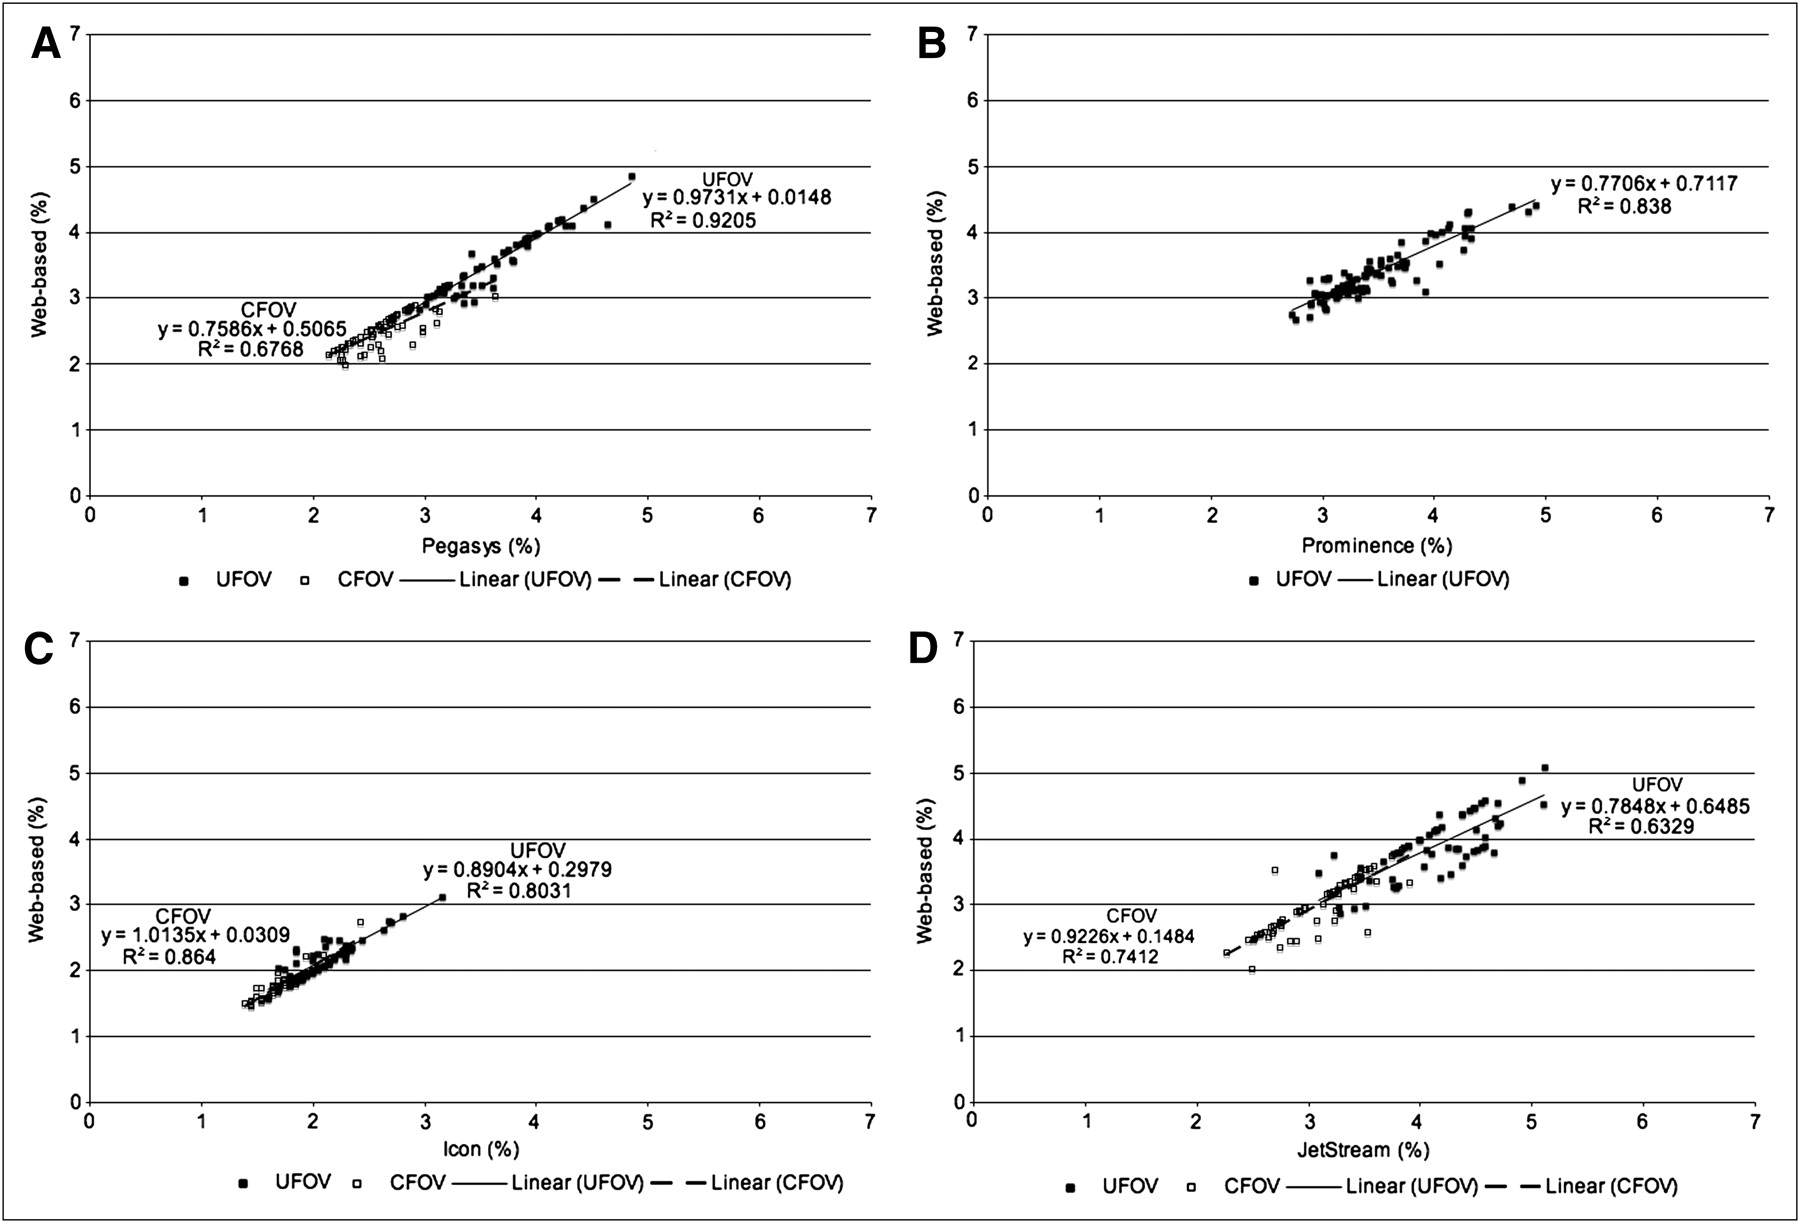
To further assess the correlation between the 2 datasets, scatterplots of the Web-based values versus the manufacturer values were created for the ADAC Forte (Fig. 2A), the Cardius X.ACT (Fig. 2B), the ECAM (Fig. 2C), and the Precedence (Fig. 2D). Linear regression trend lines were added to the scatterplots. The R2 values for the useful FOV datasets ranged from 0.63 to 0.92, and the R2 values for the central FOV datasets ranged from 0.68 to 0.86.

Manufacturer vs. Web-based NEMA integral uniformity calculations for ADAC Forte (A), Cardius X.ACT (B), ECAM (C), and Precedence (D). Slopes, y-intercepts, and R2 values are displayed for linear regression trend lines. CFOV = central FOV; UFOV = useful FOV.
As evident from these scatterplots, there is a linear relationship between the datasets. This finding further supports the relationship between the manufacturer and Web-based NEMA integral uniformity calculations in the useful FOV and central FOV.
DISCUSSION
Although there was a correlation between the manufacturer and Web-based integral uniformity calculations in the useful FOV and the central FOV, there were occasionally discrepancies between them. The reason for these discrepancies is that uniformity is not completely well defined. NEMA allows the manufacturers to define the fields of view (1), and changing these fields of view can change the integral uniformity (2). For example, when using Pegasys and JetStream for the ADAC Forte and Precedence, respectively, it is standard practice to reduce the useful FOV by 2 pixels in each dimension. The integral uniformity values would change if the useful FOV were reduced by a different number of pixels in each dimension, such as 1 or 3. Thus, the manufacturer is able to define the FOV.
Because integral uniformity is calculated according to NEMA whether it is through the manufacturer's analysis tool or this Web-based uniformity analysis system, it is important to discuss the advantages of implementing a Web-based uniformity analysis system. Web-based uniformity analysis systems assess camera performance independently of the manufacturer, as all cameras are assessed uniformly (3). In addition, the values are stored on the system, allowing for simple and more complete record keeping. For example, when the manufacturers’ analysis tools were used, limited information was recorded in a notebook at Beth Israel Deaconess Medical Center. Using this system, the integral uniformity values, the acquisition times, the sources used, the maximum and minimum pixel locations, and the technologists who performed the floods are recorded.
The Web-based system presented in this study standardizes integral uniformity values. Similar systems have been developed that standardize center-of-rotation values in addition to integral uniformity values (2,3). Thus, uniformity analysis systems have the potential to simplify quality control beyond daily uniformity floods.
CONCLUSION
This Web-based uniformity analysis system is reasonably reliable and effective, as the uniformity calculations computed by this system are comparable to the manufacturers’ calculations. This finding is important because Web-based uniformity analysis systems have many advantages. Similar uniformity analysis systems to the one assessed in this study have been created, and it is likely that more will be created in the future, simplifying γ-camera quality control.
Acknowledgments
I acknowledge Dr. Matthew Palmer, medical physicist at Beth Israel Deaconess Medical Center, for his technical expertise in this research, and David Gilmore, program director of the Beth Israel Deaconess Medical Center School of Nuclear Medicine Technology, for his professional expertise in this research.
- Received for publication August 7, 2010.
- Accepted for publication November 9, 2010.


Jump to section
Related Articles
Cited By...
- No citing articles found.