


Article Figures & Data
Figures
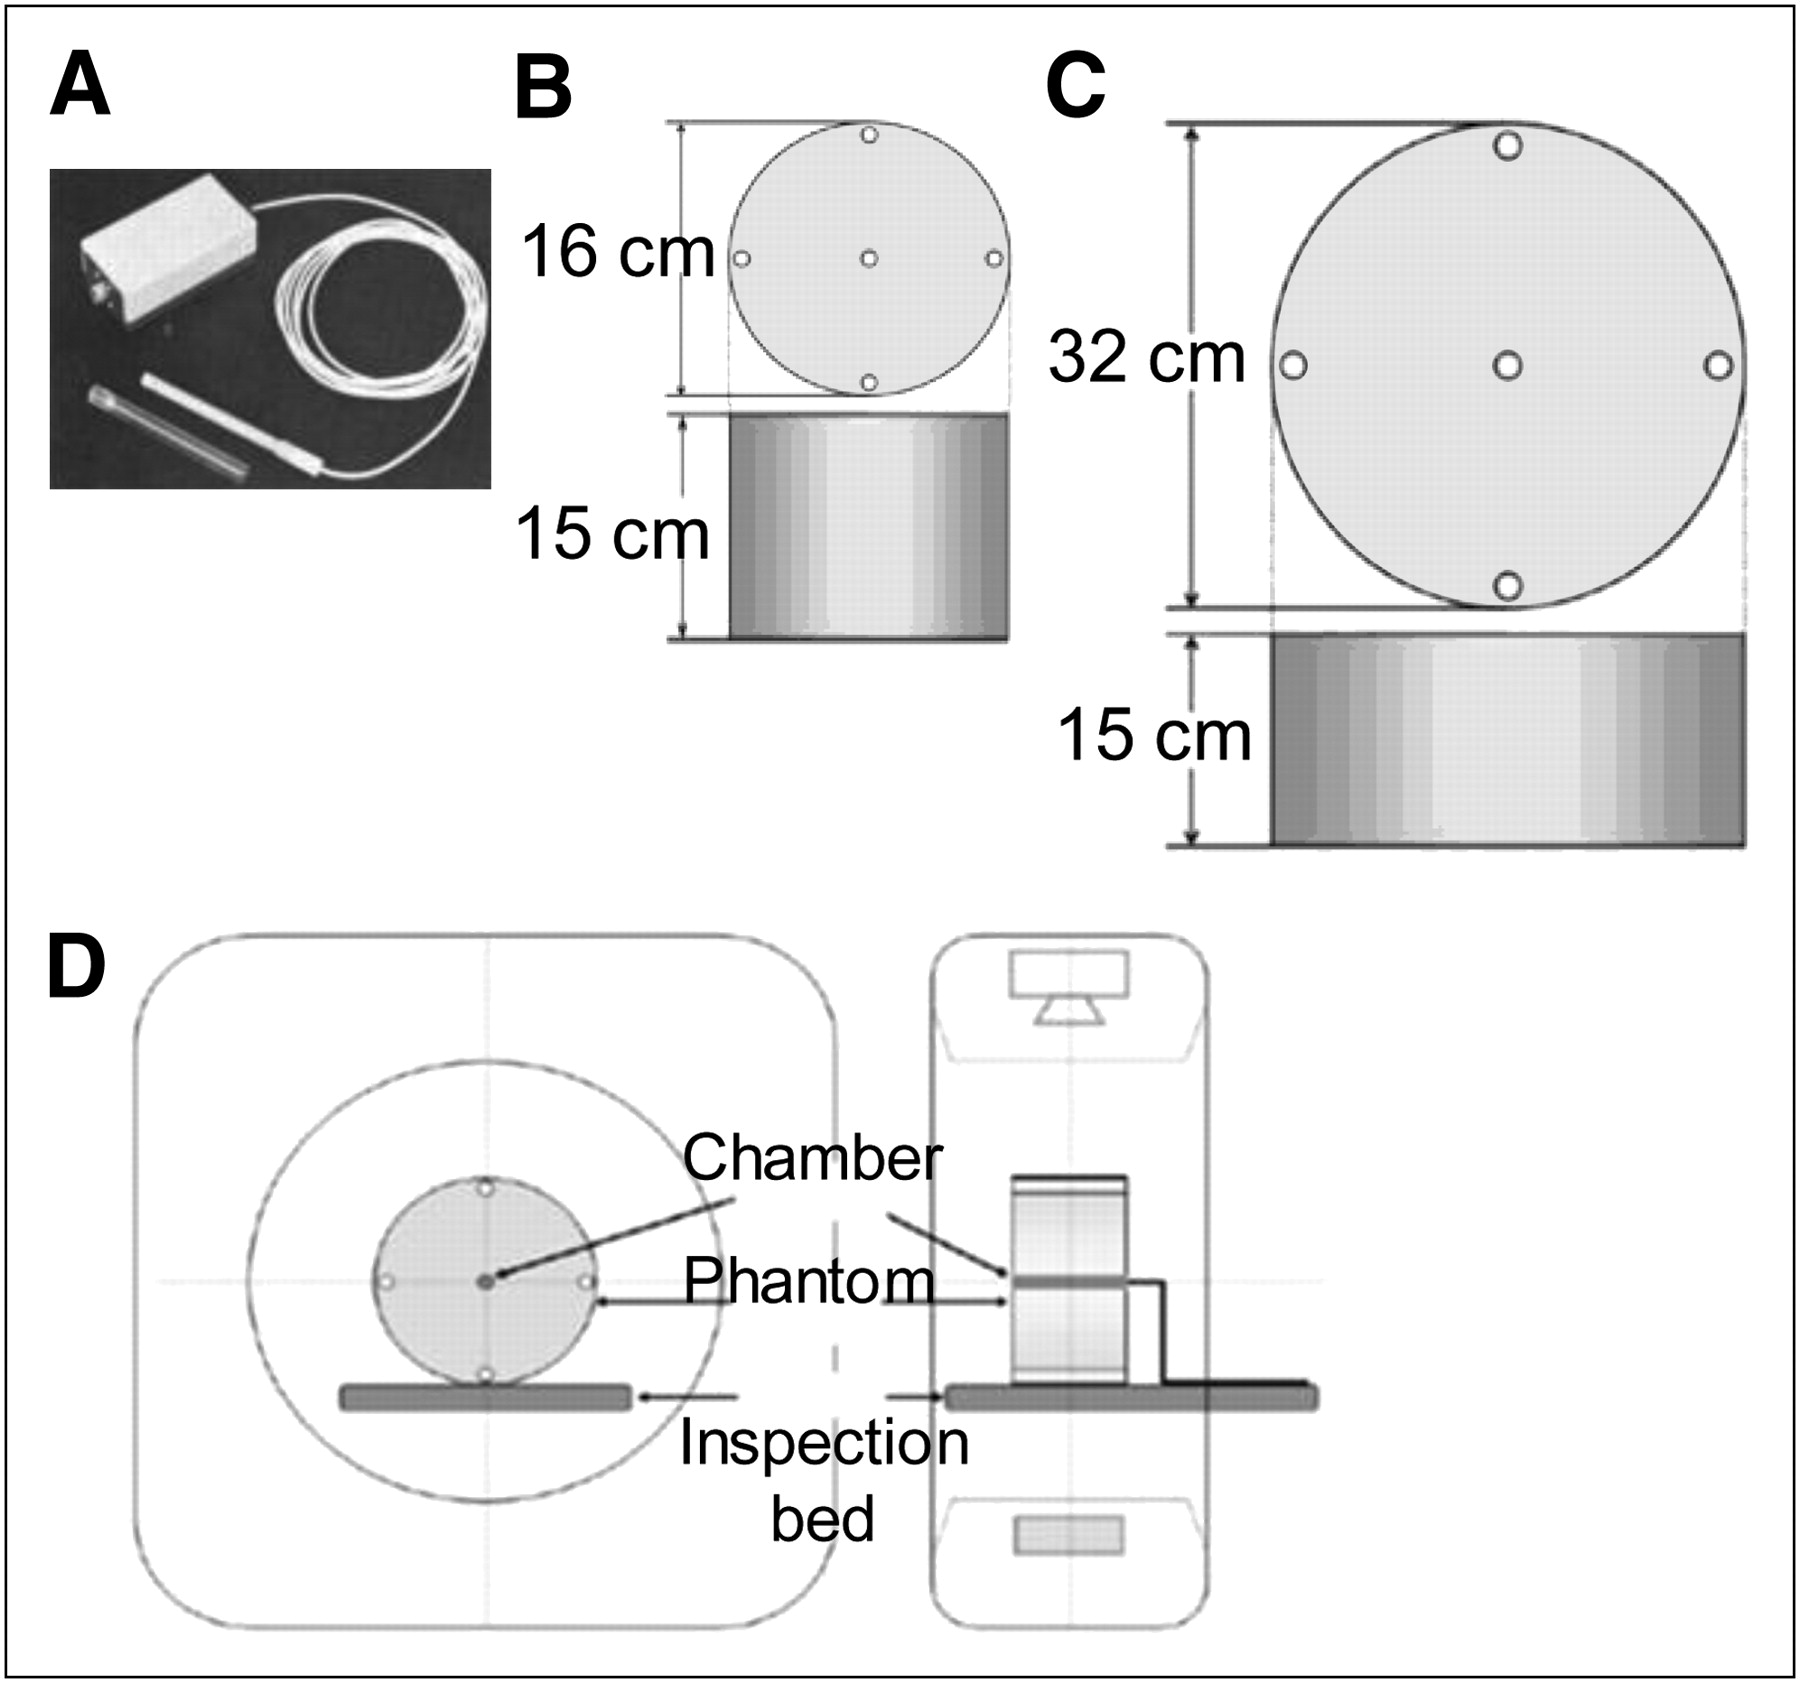
- FIGURE 1.
(A) Pencil-shaped ionization chamber dosimeter. (B) PMMA cylindric head phantom. (C) PMMA cylindric abdominal phantom. (D) Layout of measurement system setup.
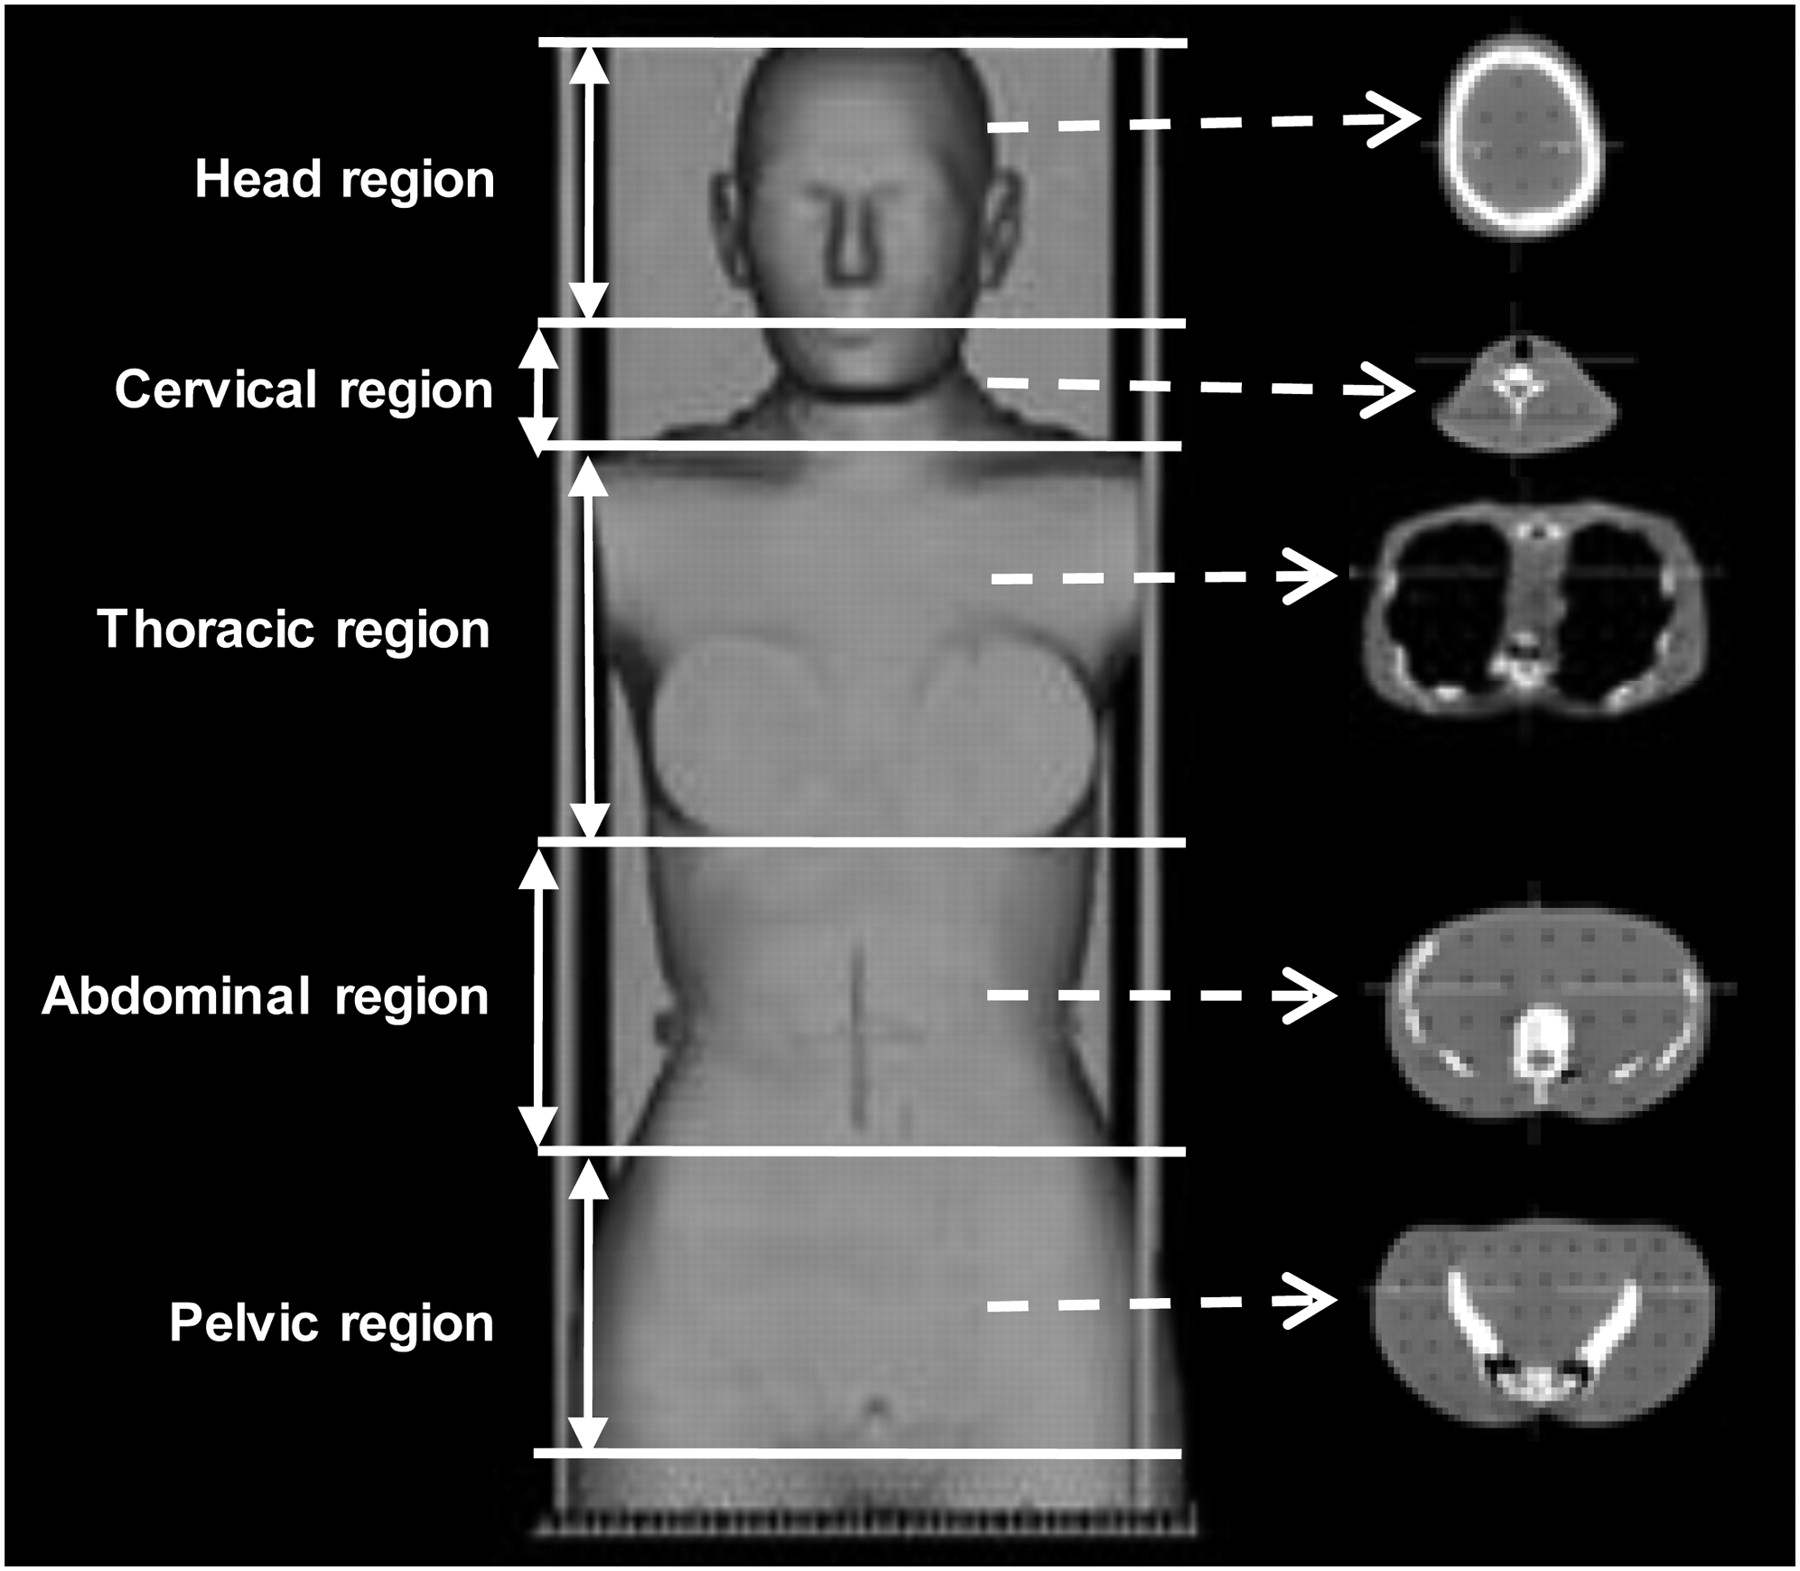
- FIGURE 2.
Alderson RANDO anthropomorphic phantom for deep-body total absorbed dose measurement.
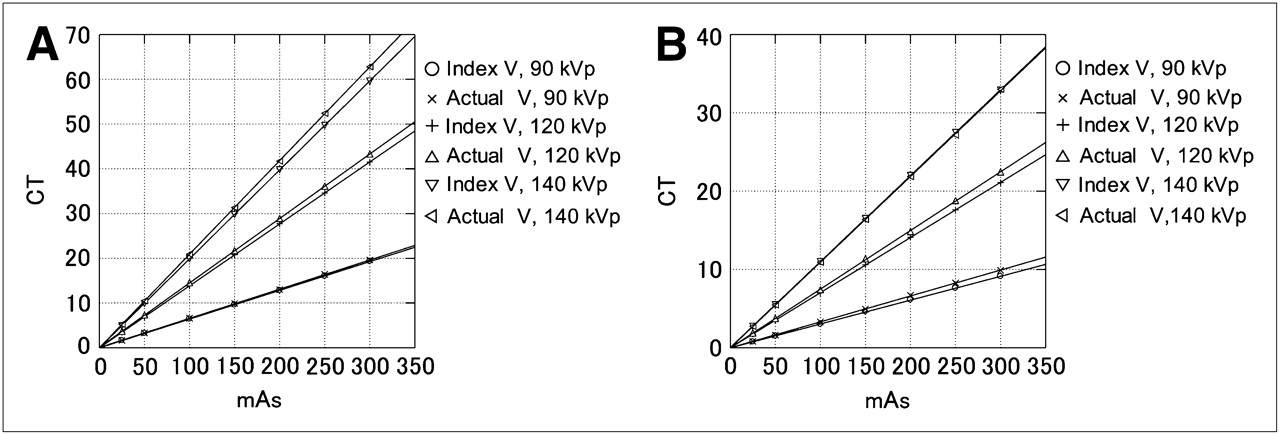
- FIGURE 3.
CTDIvol measurement results of PMMA cylindric head phantom (A) and cylindric abdominal phantom (B) at each tube voltage and current. Actual V = actual measured values; Index V = index values.
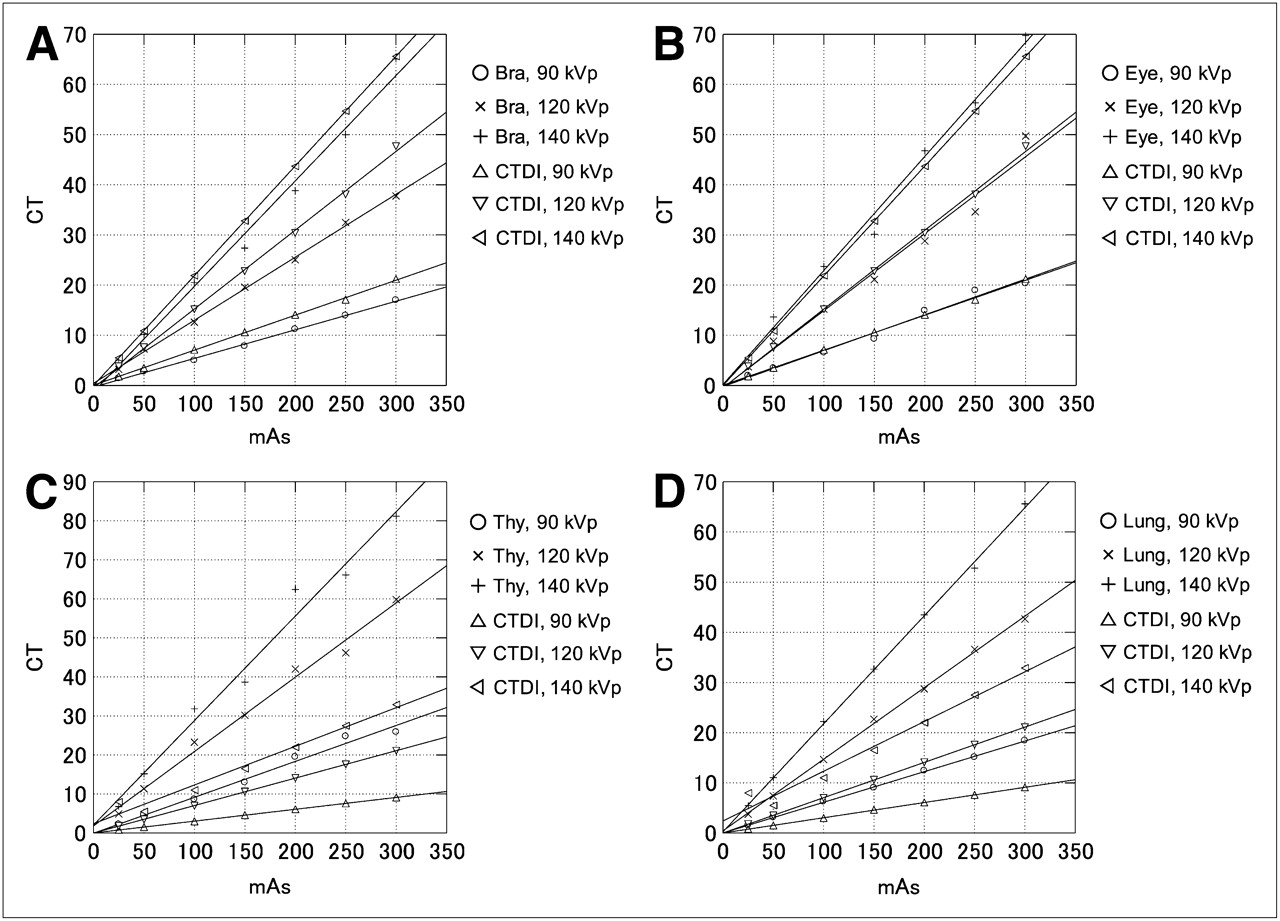
- FIGURE 4.
TLD measurement results of each organ in anthropomorphic phantom: head region, brain (A); head region, eyes (B); cervical region, thyroid glands (C); thoracic region, lungs (D). Bra = Brain; Thy = Thyroid glands.
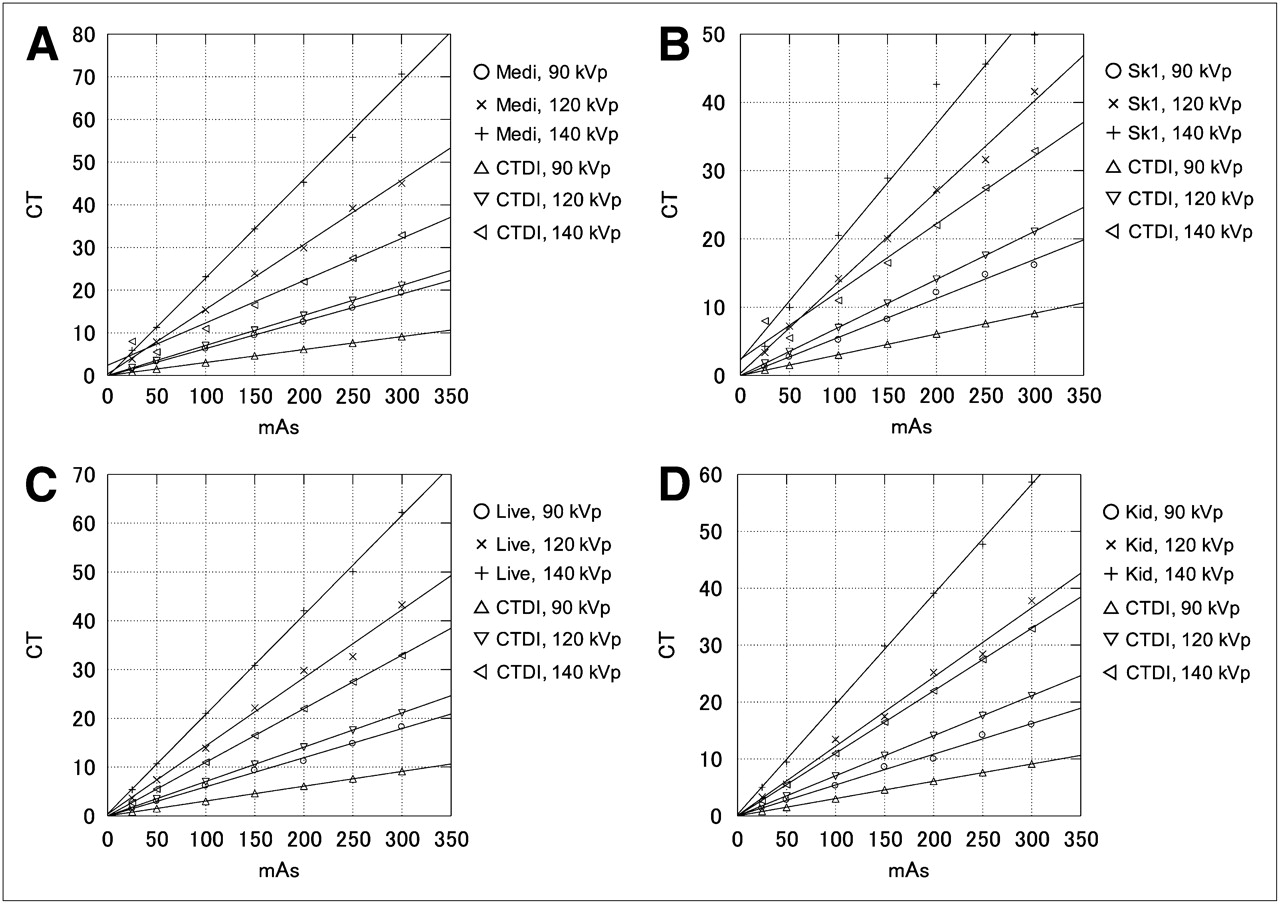
- FIGURE 5.
TLD measurement results of each organ in anthropomorphic phantom: thoracic region, mediastinum (A); thoracic region, skin (B); abdominal region, liver (C); abdominal region, kidneys (D). Medi = mediastinum; Kid = kidneys; Live = Liver; Sk1 = skin of thoracic region.
- FIGURE 6.
TLD measurement results of each organ in anthropomorphic phantom: pelvic region, urinary bladder (A); pelvic region, muscles (B); pelvic region, skin (C). Blad = urinary bladder; mus = muscles; Sk2 = skin of pelvic region.
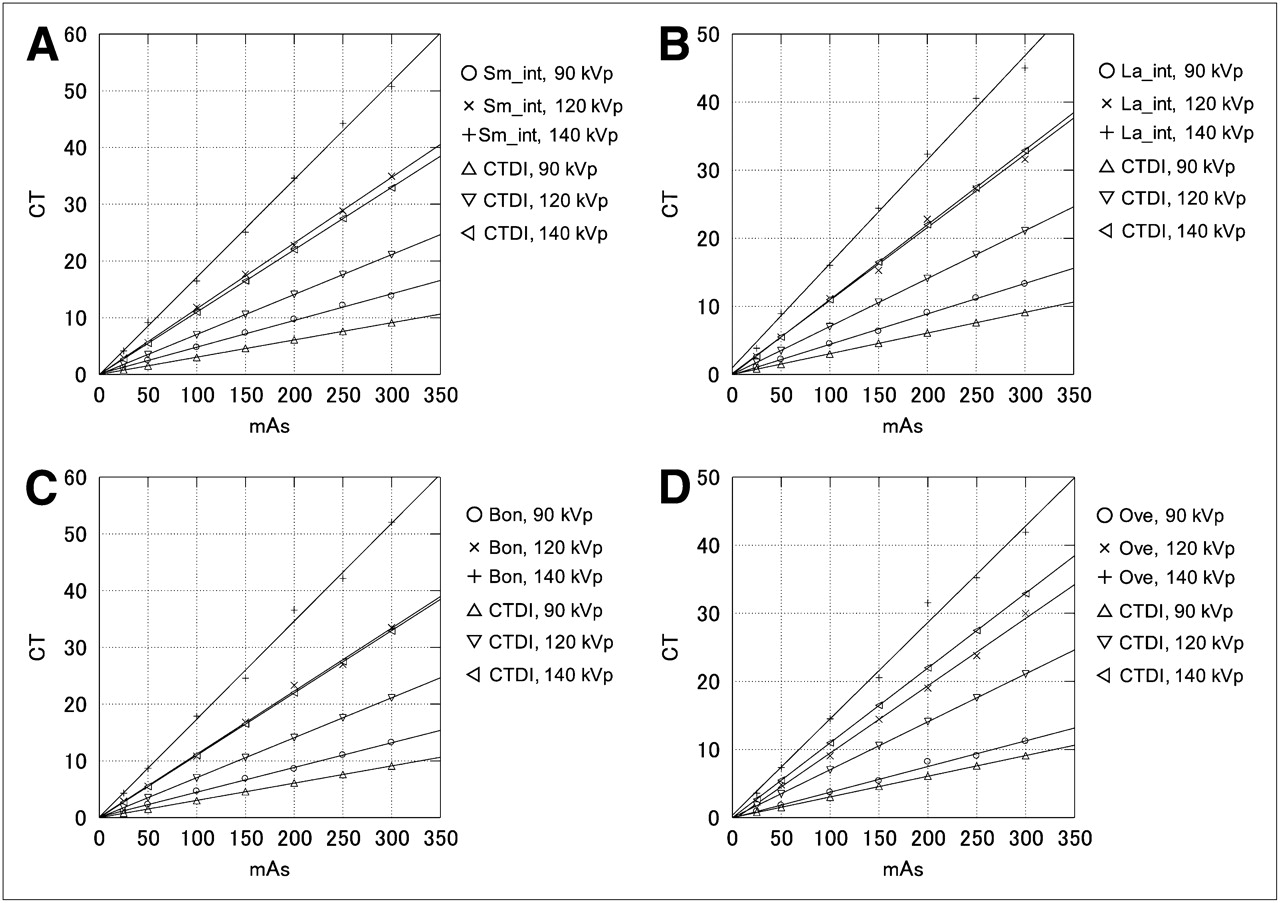
- FIGURE 7.
TLD measurement results of each organ in anthropomorphic phantom: abdominal region, small intestine (A); abdominal region, large intestine (B); abdominal region, bones (C); pelvic region, ovaries (D). Bon = bones; La_int = large intestine; Sm_int = small intestine; Ova = ovaries.


Tables
90 kVp 120 kVp 140 kVp mAs TDL CTDIvol Ratio TDL CTDIvol Ratio TDL CTDIvol Ratio Brain 25 1.39 1.80 0.77 3.21 3.80 0.85 5.08 5.50 0.92 50 2.76 3.50 0.79 7.29 7.60 0.96 10.18 10.90 0.93 100 4.98 7.10 0.70 12.61 15.20 0.83 20.51 21.90 0.94 150 7.82 10.60 0.74 19.60 22.80 0.86 27.37 32.80 0.83 200 11.20 14.10 0.79 25.05 30.40 0.82 38.84 43.70 0.89 250 13.93 17.10 0.81 32.48 38.10 0.85 49.98 54.70 0.91 300 17.00 21.20 0.80 37.79 47.70 0.79 65.07 65.60 0.99 Eyes 25 1.94 1.80 1.08 3.71 3.80 0.98 5.44 5.50 0.99 50 3.44 3.50 0.98 8.82 7.60 1.16 13.66 10.90 1.25 100 6.56 7.10 0.92 15.22 15.20 1.00 23.73 21.90 1.08 150 9.27 10.60 0.87 21.11 22.80 0.93 30.14 32.80 0.92 200 14.92 14.10 1.06 28.81 30.40 0.95 46.79 43.70 1.07 250 18.93 17.10 1.11 34.61 38.10 0.91 56.30 54.70 1.03 300 20.31 21.20 0.96 49.72 47.70 1.04 69.76 65.60 1.06 Data are milligrays.
90 kVp 120 kVp 140 kVp mAs TDL CTDIvol Ratio TDL CTDIvol Ratio TDL CTDIvol Ratio Thyroid 25 2.21 0.80 2.77 4.87 1.80 2.71 6.80 2.70 2.52 50 4.70 1.50 3.13 11.34 3.50 3.24 15.18 5.50 2.76 100 8.62 3.00 2.87 23.27 7.00 3.32 31.82 11.00 2.89 150 12.97 4.60 2.82 30.18 10.60 2.85 38.70 16.50 2.35 200 19.49 6.10 3.20 42.03 14.10 2.98 62.44 22.00 2.84 250 24.76 7.60 3.26 46.17 17.60 2.62 66.12 27.50 2.40 300 25.88 9.10 2.84 59.83 21.10 2.84 81.21 32.90 2.47 Lung 25 1.51 0.80 1.89 3.76 1.80 2.09 5.45 2.70 2.02 50 3.10 1.50 2.07 7.41 3.50 2.12 11.03 5.50 2.00 100 6.25 3.00 2.08 14.66 7.00 2.09 22.21 11.00 2.02 150 8.99 4.60 1.96 22.67 10.60 2.14 32.64 16.50 1.98 200 12.42 6.10 2.04 28.72 14.10 2.04 43.49 22.00 1.98 250 15.11 7.60 1.99 36.60 17.60 2.08 52.83 27.50 1.92 300 18.42 9.10 2.02 42.65 21.10 2.02 65.61 32.90 1.99 Mediastinum 25 1.54 0.80 1.93 3.87 1.80 2.15 5.90 2.70 2.19 50 3.26 1.50 2.17 7.91 3.50 2.26 11.27 5.50 2.05 100 6.29 3.00 2.10 15.37 7.00 2.20 23.16 11.00 2.11 150 9.39 4.60 2.04 23.95 10.60 2.26 34.36 16.50 2.08 200 12.51 6.10 2.05 29.92 14.10 2.12 45.27 22.00 2.06 250 15.80 7.60 2.08 39.20 17.60 2.23 55.79 27.50 2.03 300 19.34 9.10 2.13 45.05 21.10 2.13 70.64 32.90 2.15 Thoracic skin 25 1.28 0.80 1.60 3.37 1.80 1.87 4.29 2.70 1.59 50 2.71 1.50 1.81 7.24 3.50 2.07 9.94 5.50 1.81 100 5.21 3.00 1.74 14.19 7.00 2.03 20.52 11.00 1.87 150 8.21 4.60 1.78 20.04 10.60 1.89 28.91 16.50 1.75 200 12.15 6.10 1.99 27.21 14.10 1.93 42.64 22.00 1.94 250 14.76 7.60 1.94 31.62 17.60 1.80 45.60 27.50 1.66 300 16.15 9.10 1.78 41.59 21.10 1.97 49.84 32.90 1.52 Data are milligrays.
90 kVp 120 kVp 140 kVp mAs TDL CTDIvol Ratio TDL CTDIvol Ratio TDL CTDIvol Ratio Liver 25 1.40 0.80 1.76 3.64 1.80 2.02 5.37 2.70 1.99 50 2.99 1.50 1.99 7.41 3.50 2.12 10.69 5.50 1.94 100 6.16 3.00 2.05 13.88 7.00 1.98 21.01 11.00 1.91 150 9.29 4.60 2.02 22.13 10.60 2.09 30.82 16.50 1.87 200 11.19 6.10 1.83 29.81 14.10 2.11 42.04 22.00 1.91 250 14.80 7.60 1.95 32.64 17.60 1.85 50.08 27.50 1.82 300 18.23 9.10 2.00 43.23 21.10 2.05 62.19 32.90 1.89 Kidney 1.36 0.80 1.69 3.31 1.80 1.84 5.03 2.70 1.86 25 2.81 1.50 1.88 5.55 3.50 1.59 9.46 5.50 1.72 50 5.29 3.00 1.76 13.45 7.00 1.92 20.08 11.00 1.83 100 8.59 4.60 1.87 17.46 10.60 1.65 29.86 16.50 1.81 150 9.99 6.10 1.64 25.21 14.10 1.79 39.07 22.00 1.78 200 14.18 7.60 1.87 28.42 17.60 1.61 47.71 27.50 1.73 250 16.05 9.10 1.76 37.81 21.10 1.79 58.64 32.90 1.78 300 1.36 0.80 1.69 3.31 1.80 1.84 5.03 2.70 1.86 Small intestine 25 1.14 0.80 1.43 2.92 1.80 1.62 4.16 2.70 1.54 50 2.46 1.50 1.64 5.60 3.50 1.60 9.15 5.50 1.66 100 4.78 3.00 1.59 11.84 7.00 1.69 16.49 11.00 1.50 150 7.29 4.60 1.58 17.65 10.60 1.67 25.08 16.50 1.52 200 9.69 6.10 1.59 22.72 14.10 1.61 34.58 22.00 1.57 250 12.18 7.60 1.60 28.82 17.60 1.64 44.23 27.50 1.61 300 13.81 9.10 1.52 34.94 21.10 1.66 50.75 32.90 1.54 Large intestine 25 1.06 0.80 1.32 2.64 1.80 1.47 3.85 2.70 1.43 50 2.21 1.50 1.47 5.50 3.50 1.57 8.93 5.50 1.62 100 4.50 3.00 1.50 11.15 7.00 1.59 16.02 11.00 1.46 150 6.33 4.60 1.38 15.27 10.60 1.44 24.41 16.50 1.48 200 9.08 6.10 1.49 22.81 14.10 1.62 32.36 22.00 1.47 250 11.21 7.60 1.48 27.27 17.60 1.55 40.52 27.50 1.47 300 13.29 9.10 1.46 31.59 21.10 1.50 45.02 32.90 1.37 Ovary 25 0.90 0.80 1.13 2.30 1.80 1.28 3.59 2.70 1.33 50 1.79 1.50 1.19 4.82 3.50 1.38 7.37 5.50 1.34 100 3.72 3.00 1.24 9.09 7.00 1.30 14.52 11.00 1.32 150 5.38 4.60 1.17 14.44 10.60 1.36 20.57 16.50 1.25 200 8.20 6.10 1.34 19.01 14.10 1.35 31.54 22.00 1.43 250 9.06 7.60 1.19 23.80 17.60 1.35 35.23 27.50 1.28 300 11.22 9.10 1.23 29.99 21.10 1.42 41.90 32.90 1.27 Urinary bladder 25 1.07 0.80 1.34 2.56 1.80 1.42 4.11 2.70 1.52 50 2.13 1.50 1.42 5.52 3.50 1.58 8.17 5.50 1.49 100 4.35 3.00 1.45 10.47 7.00 1.50 16.21 11.00 1.47 150 6.01 4.60 1.31 16.68 10.60 1.57 22.66 16.50 1.37 200 7.61 6.10 1.25 20.34 14.10 1.44 33.14 22.00 1.51 250 10.29 7.60 1.35 25.41 17.60 1.44 38.64 27.50 1.41 300 13.09 9.10 1.44 30.55 21.10 1.45 44.23 32.90 1.34 Red bone marrow 25 1.11 0.80 1.38 2.92 1.80 1.62 4.33 2.70 1.60 50 2.29 1.50 1.53 5.55 3.50 1.59 8.72 5.50 1.58 100 4.65 3.00 1.55 10.83 7.00 1.55 17.88 11.00 1.63 150 6.84 4.60 1.49 16.83 10.60 1.59 24.55 16.50 1.49 200 8.59 6.10 1.41 23.32 14.10 1.65 36.56 22.00 1.66 250 11.02 7.60 1.45 26.99 17.60 1.53 42.14 27.50 1.53 300 13.24 9.10 1.45 33.50 21.10 1.59 52.07 32.90 1.58 Muscle 25 1.28 0.80 1.60 3.19 1.80 1.77 4.29 2.70 1.59 50 2.68 1.50 1.79 6.39 3.50 1.83 9.64 5.50 1.75 100 5.60 3.00 1.87 11.93 7.00 1.70 20.35 11.00 1.85 150 8.17 4.60 1.78 18.94 10.60 1.79 29.41 16.50 1.78 200 10.90 6.10 1.79 25.15 14.10 1.78 38.04 22.00 1.73 250 13.11 7.60 1.72 31.09 17.60 1.77 45.14 27.50 1.64 300 16.93 9.10 1.86 40.78 21.10 1.93 54.40 32.90 1.65 Pelvic skin 25 1.23 0.80 1.53 2.69 1.80 1.49 4.00 2.70 1.48 50 2.34 1.50 1.56 5.52 3.50 1.58 8.56 5.50 1.56 100 4.73 3.00 1.58 10.21 7.00 1.46 15.24 11.00 1.39 150 7.55 4.60 1.64 15.34 10.60 1.45 21.41 16.50 1.30 200 7.87 6.10 1.29 20.29 14.10 1.44 29.49 22.00 1.34 250 12.14 7.60 1.60 24.93 17.60 1.42 38.58 27.50 1.40 300 13.89 9.10 1.53 30.84 21.10 1.46 44.10 32.90 1.34 Data are milligrays.
Head region Abdominal region Imaging condition Brain perfusion scintigraphy (N-isopropyl-4-iodoamphetamine(123I) hydrochloride, 111 MBq) CT (brain) Total radiation exposure (mGy) Liver scintigraphy (galactosyl human serum albumin diethylenetriamine pentaacetic acid, 185 MBq) CT (liver) Total radiation exposure (mGy) 90 kVp 25 mAs 2.52 +1.39 3.91 9.99 +1.40 11.39 50 mAs +2.76 5.28 +2.99 12.98 100 mAs +4.98 7.50 +6.16 16.15 150 mAs +7.82 10.34 +9.29 19.28 200 mAs +11.20 13.72 +11.19 21.18 250 mAs +13.93 16.45 +14.80 24.79 300 mAs +17.00 19.52 +18.23 28.22 120 kVp 25 mAs 2.52 +3.21 5.73 9.99 +3.64 13.63 50 mAs +7.29 9.81 +7.41 17.40 100 mAs +12.61 15.13 +13.88 23.87 150 mAs +19.60 22.12 +22.13 32.12 200 mAs +25.05 27.57 +29.81 39.80 250 mAs +32.48 35.00 +32.64 42.63 300 mAs +37.79 40.31 +43.23 53.22 140 kVp 25 mAs 2.52 +5.08 7.60 9.99 +5.37 20.68 50 mAs +10.18 12.70 +10.69 20.68 100 mAs +20.51 23.03 +21.01 31.00 150 mAs +27.37 29.89 +30.82 40.81 200 mAs +38.83 41.35 +42.04 52.03 250 mAs +49.98 52.50 +50.08 60.07 300 mAs +65.07 67.59 +62.19 72.18 Organ 111In-diethylenetriaminepentaacetic acid N-isopropyl-4-iodoamphetamine(123I) hydrochloride 123I-iomazenil 99mTc-ethyl cysteinate dimer Brain 41 0.84 0.44 0.0051 Body 1.5 0.38 0.17 0.001 Organ-absorbed doses are given in mGy/37 MBq, except for 99mTc-ethyl cysteinate dimer, which is given in mGy/Bq.
Organ 123I capsule 131I capsule 99mTcO4− Thyroid 13 1,300 0.11 Body 0.029 0.71 0.09 Organ-absorbed doses are given in mGy/37 MBq.
Organ 99mTc-human serum albumin diethylenetriamine pentaacetic acid 99mTc-tetrofosmin (rest) 99mTc-methoxyisobutylisonitrile (rest) 201TlCl 123I-15-(4-iodophenyl)-3(R,S)-methylpentadecanoic acid 99mTc-macroaggregated albumin 81mKr gas Heart 0.64 0.0041 0.34 6.4 0.057 — — Lung 0.17 0.0023 0.045 2.4 — 3 17 Liver 0.57 0.0032 0.14 4.7 0.038 0.43 0.27 Kidney 0.48 0.0104 0.62 4.0 0.011 1.1 0.1 Body 0.16 0.0038 0.089 1.7 0.01 0.19 0.04 Organ-absorbed doses are given in mGy/37 MBq for 99mTc-human serum albumin diethylenetriamine pentaacetic acid, 99mTc-methoxyisobutylisonitrile, 201TlCl, and 99mTc-macroaggregated albumin; mGy/MBq for 99mTc-tetrofosmin and 123I-15-(4-iodophenyl)-3(R,S)-methylpentadecanoic acid; and μGy/37 MBq for 81mKr gas.
Organ 99mTc-stannous colloid 99mTc-N-pyridoxyl-5-methyltryptophan 99mTc-galactosyl human serum albumin diethylenetriamine pentaacetic acid 99mTc-mercaptoacetylglycylglycylglycin 131I-adosterol Liver 3.2 0.5 0.054 0.0006 8.0 Kidney — 0.2 0.0081 0.0028 4.6 Ovaries 0.06 0.9 — — 40.3 Body 0.2 0.2 0.0011 0.001 4.4 Organ-absorbed doses are given in mGy/37 MBq for 99mTc-stannous colloid and 99mTc-N-pyridoxyl-5-methyltryptophan, mGy/MBq for 99mTc-galactosyl human serum albumin diethylenetriamine pentaacetic acid and 99mTc-mercaptoacetylglycylglycylglycin, and mGy/18.5 MBq for 131I-adosterol.
Organ 99mTc-hydroxymethylenediphosphonate 99mTc-methylenediphosphonate 67Ga-citrate 201TlCl 18F-FDG Liver 0.086 0.07 4.6 4.7 3.7 Kidney 0.219 0.81 4.1 4 4.4 Ovaries 0.1 0.09 2.8 7.1 1.9 Bone 0.512 0.46 4.4 — — Bone marrow (red) 0.331 — — — 1.7 Body 0.119 0.07 2.6 1.7 1.9 Organ-absorbed doses are given in mGy/37 MBq.
Feature Description 1: IntelliBeam filtration 2-1: DoseRight automatic current selection 2-2: DoseRight dose modulation Auto current selection (ACS) Dynamic dose modulation (D-DOM) Z-direction dose modulation (Z-DOM) 3-1: DoseRight cardiac 3-2: DoseRight electrocardiogram-gated modulation Cardiac dose modulation


Jump to section
Related Articles
Cited By...
- No citing articles found.