


Article Figures & Data
Figures
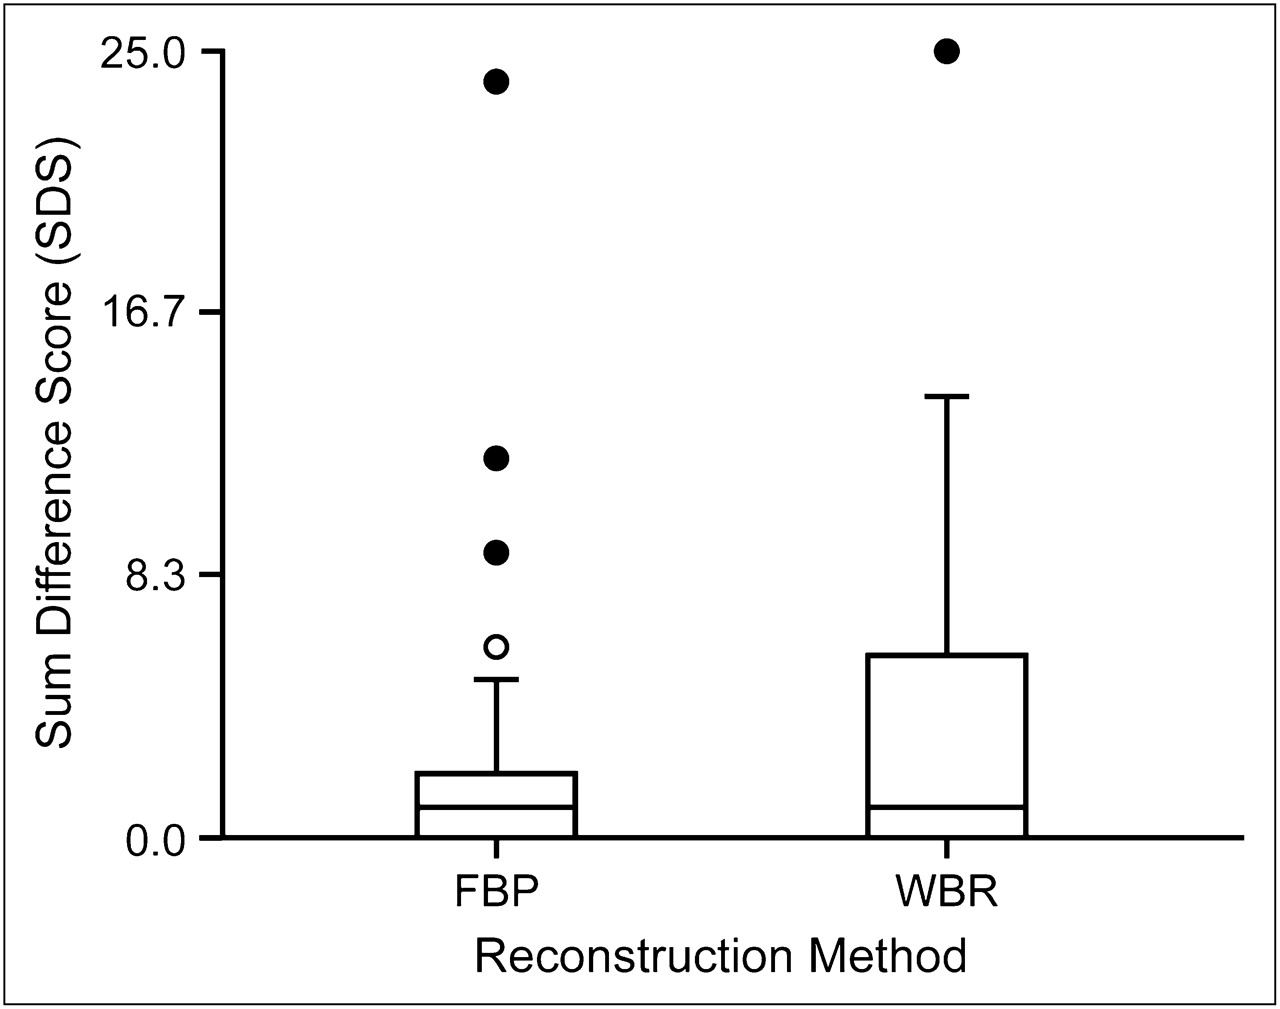
- FIGURE 1.
Box plot comparing median and distribution of SDS for FBP and WBR. Data indicated no difference between 2 distributions (F = 0.91; P = 0.3421). Whiskers represent 1.5 times the interquartile range. ○ = mild outlier; • = severe outlier.
- FIGURE 2.
Box plot comparing median and distribution of left ventricular EF (percentage) for FBP and WBR. Data indicated significant difference between 2 distributions (F = 6.13; P = 0.0157).
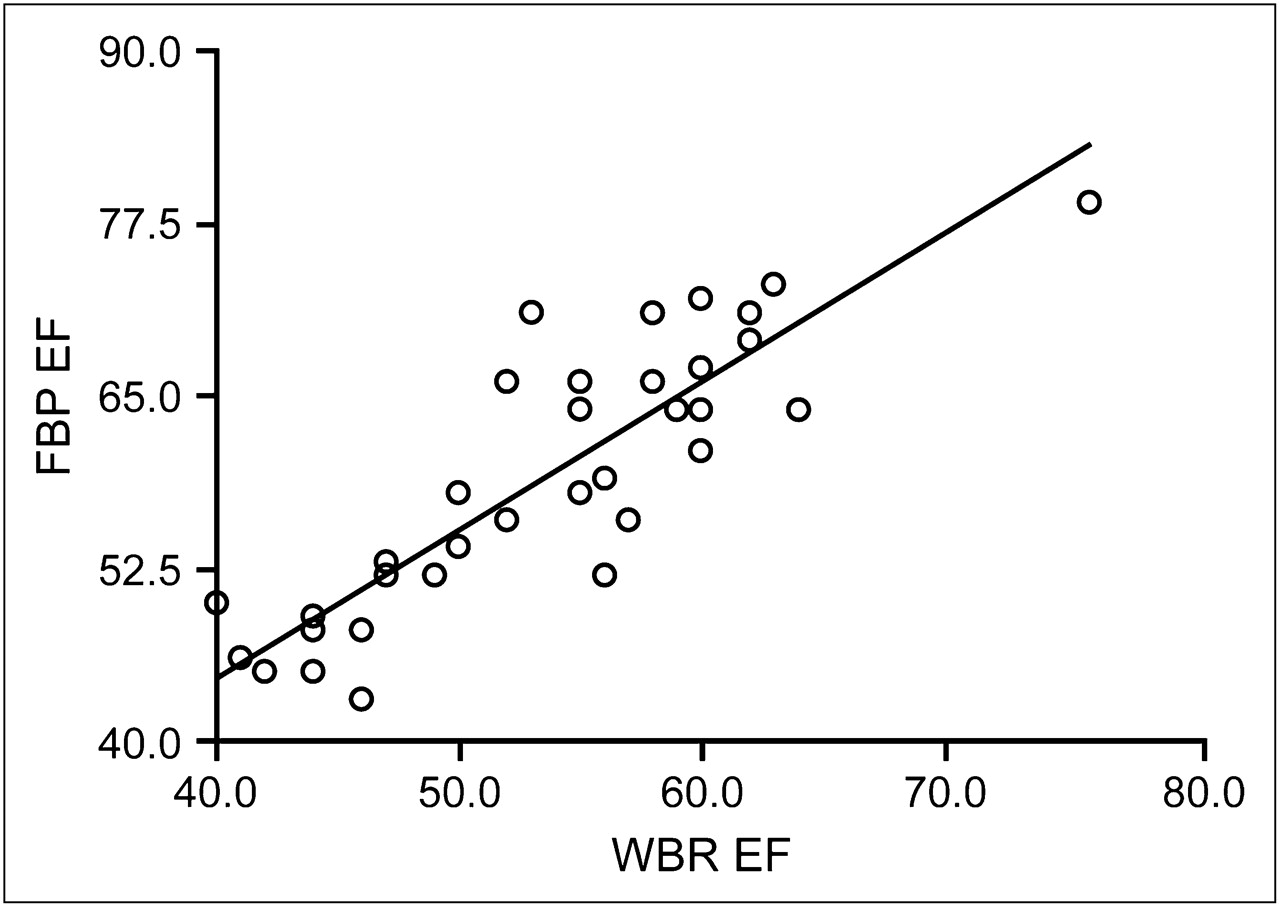
- FIGURE 3.
Linear regression plot indicating relationship between FBP EF and WBR EF. Equation describing plot was as follows: FBP EF = 2.1243 + (1.0666 × WBR EF).
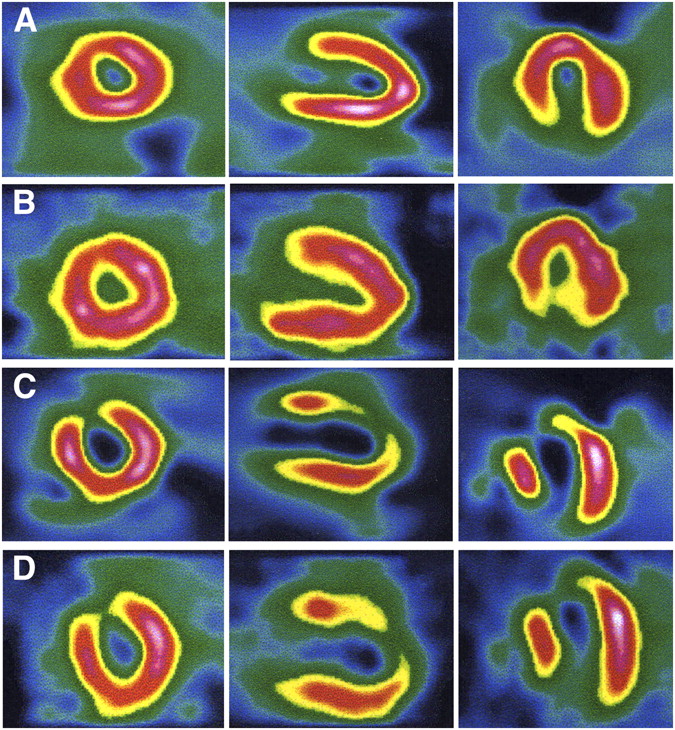
- FIGURE 4.
Myocardial images in short-axis (left), vertical long-axis (middle), and horizontal long-axis (right) orientations showing normal radiopharmaceutical distribution with WBR techniques (A), normal radiopharmaceutical distribution with FBP techniques (B), abnormal radiopharmaceutical distribution with WBR techniques (C), and abnormal radiopharmaceutical distribution with FBP techniques (D).


Tables
Ranking Reconstruction method (no. of studies) Image interpretation parameter Range Mean SD Median FBP (42) Image quality 1–5 2.048 0.8506 2 Myocardial normality 1–5 2.381 1.497 2 Lesion reversibility 1–5 2.095 1.353 1 Treatment recommendation 1–3 1.778 0.9060 1 WBR (42) Image quality 1–5 1.841 0.7871 2 Myocardial normality 1–5 2.429 1.500 2 Lesion reversibility 1–5 2.238 1.500 1 Treatment recommendation 1–3 1.762 0.9108 1 - TABLE 2
Paired Statistics from Repeated-Measures ANOVA and Pearson Correlation Coefficients for SSS, SRS, SDS, EDV, ESV, and Percentage EF by Reconstruction Method (FBP or WBR)
Reconstruction method Variable analyzed No. of studies* Mean SE F P Pearson r FBP SSS 42 2.925 0.8882 0.84 0.3628 0.8618† WBR SSS 42 4.075 0.8883 FBP SRS 42 0.525 0.2611 0.16 0.6857 0.7999† WBR SRS 42 0.675 0.2613 FBP SDS 42 2.325 0.7397 0.91 0.3421 0.8755† WBR SDS 42 3.325 0.7398 FBP EDV 36 67.7 3.5147 6.64‡ 0.0121 0.8269† WBR EDV 36 80.5 3.5141 FBP ESV 36 28.5 2.5659 6.69‡ 0.0118 0.8755† WBR ESV 36 37.9 2.5661 FBP % EF 36 59.97 1.6228 6.13‡ 0.0157 0.8747† WBR % EF 36 54.06 1.3309


Jump to section
Related Articles
Cited By...
- No citing articles found.