


Article Figures & Data
Figures
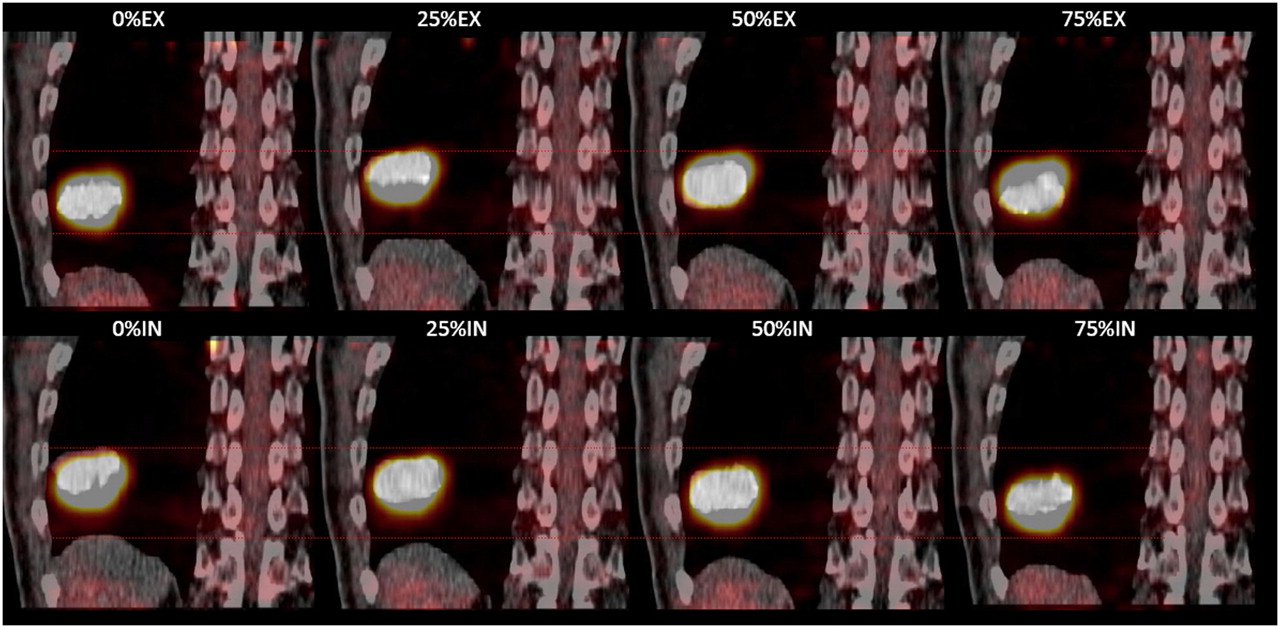
- FIGURE 1.
Overview of RCCT and RCPET phases with their corresponding amplitudes. Mismatch of position of tumor if 2 different binning methods are used. Blue and red circles indicate tumor location for amplitude binning and phase binning, respectively. Blue and red dashed lines illustrate division of signal into, respectively, equally spaced amplitude bins and equally spaced phase bins.
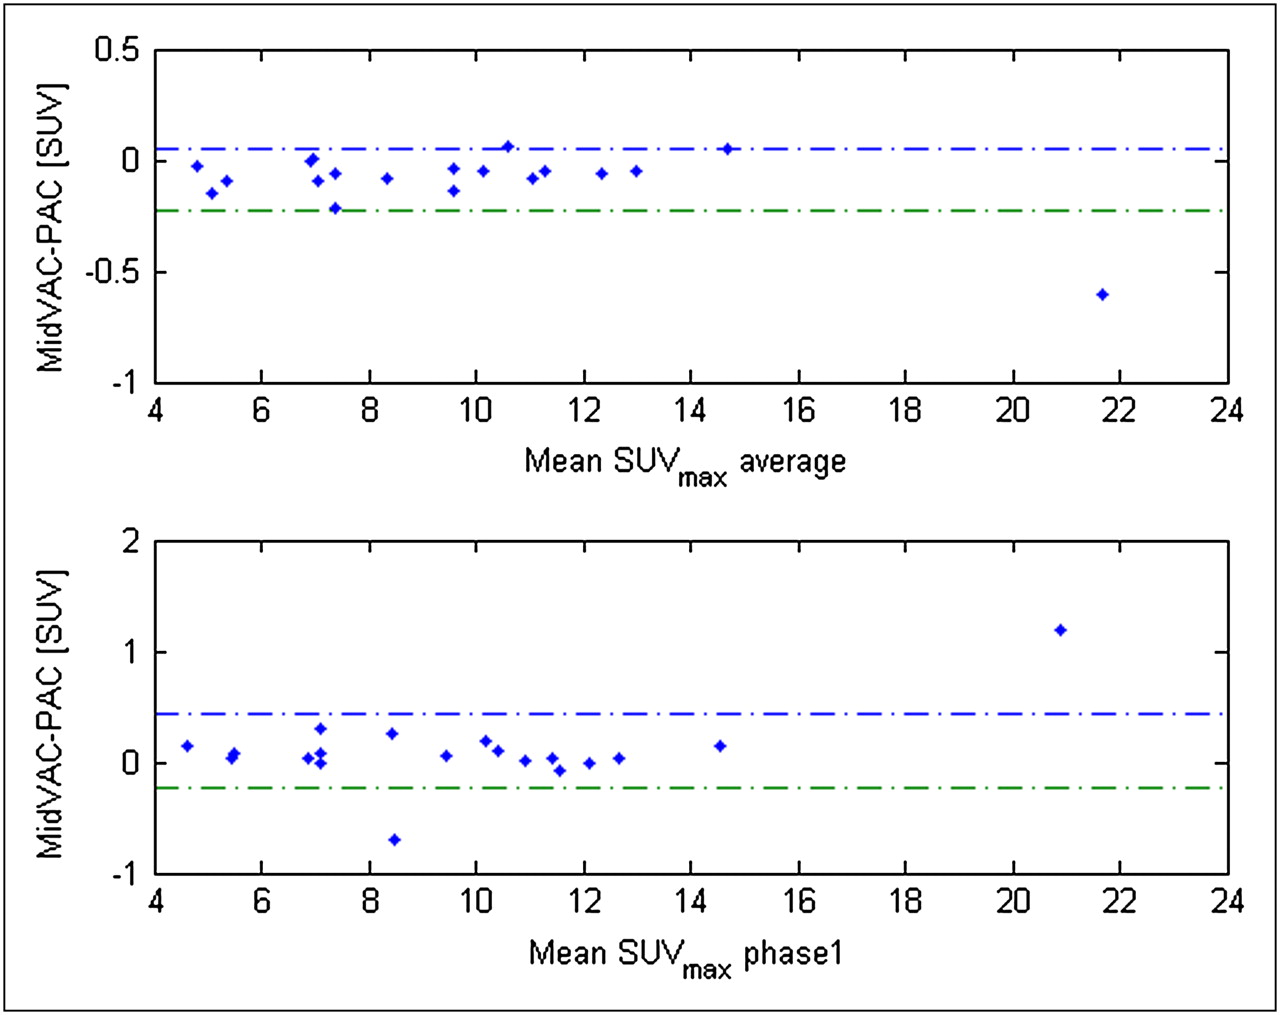
- FIGURE 3.
Bland–Altman plots showing absolute difference between MidV-AC and PAC against mean SUVmax in tumor per patient for average and phase 1 values. Blue and green dashed lines represent, respectively, upper and lower 95% limit of agreement.
- FIGURE 4.
Bland–Altman plots showing absolute difference between MidV-AC and PAC against mean tumor volume per patient for average and phase 1 values. Blue and green dashed lines represent, respectively, upper and lower 95% limit of agreement.


Tables
- TABLE 1
Relevant System Specifications of PET and CT Components of Siemens TruePoint Biograph 40 PET/CT Scanner
System specification Value PET Axial field of view 162 mm Transaxial field of view 605 mm Transaxial resolution (34), FWHM at 1 cm 4.2 mm Axial resolution (34), FWHM at 1 cm 4.5 mm Reconstructed slice thickness 3 mm CT Maximum number of CT slices 40 Transaxial field of view 500 mm High-contrast resolution 0.6 mm Reconstructed slice thickness 3 mm Rotation time 0.5–1 s Feed/rotation RCCT 2.9 mm Pitch factor RCCT 0.1 FWHM = full width at half maximum.
- TABLE 2
Patient Average and Phase 1 SUVmax with SD for 8 Phases of PAC RCPET and MidV-AC RCPET
SUVmax Patient no. Motion vector (mm) Tumor location PAC average MidV-AC average Difference MidV-AC vs. PAC (average values) PAC phase 1 MidV-AC phase 1 Difference MidV-AC vs. PAC (phase 1 values) 1 4.4 LUL 10.55 ± 0.6 10.61 ± 0.5 0.6% 11.58 11.51 −0.6% 2 4.4 RML 7.49 ± 0.7 7.27 ± 0.5 −2.9% 8.83 8.13 −7.9% 3 3.0 LUL 9.61 ± 1.1 9.57 ± 0.6 −0.4% 10.11 10.30 1.9% 4 6.7 RUL 10.17 ± 2.1 10.12 ± 0.3 −0.5% 10.38 10.48 1.0% 5 12.3 RLL 14.67 ± 0.6 14.72 ± 0.6 0.3% 14.50 14.64 1.0% 6 10.0 RB 6.96 ± 0.6 6.97 ± 0.7 0.1% 6.94 7.23 4.2% 7 3.7 RUL 5.14 ± 0.3 4.99 ± 0.3 −2.9% 5.45 5.52 1.3% 8 6.7 LLL 7.42 ± 0.4 7.36 ± 0.4 −0.8% 7.10 7.10 0.0% 9 4.4 LB 12.37 ± 0.8 12.31 ± 0.8 −0.5% 12.10 12.10 0.0% 10 15.2 RLL 22.00 ± 1.4 21.40 ± 0.5 −2.7% 20.30 21.50 5.9% 11 1.9 RUL 6.91 ± 0.3 6.91 ± 0.3 0.0% 6.84 6.88 0.6% 12 2.5 RB 11.30 ± 0.3 11.25 ± 0.4 −0.4% 11.42 11.45 0.3% 13 4.8 RUL 7.10 ± 0.4 7.00 ± 0.4 −1.4% 7.05 7.13 1.1% 14 2.9 RUL 11.08 ± 0.6 11.00 ± 0.6 −0.7% 10.91 10.92 0.1% 15 6.6 RML 4.82 ± 0.3 4.79 ± 0.3 −0.6% 4.53 4.67 3.1% 16 3.1 LLL 5.39 ± 0.7 5.30 ± 0.7 −1.7% 5.42 5.46 0.7% 17 15.3 LUL 8.38 ± 1 8.30 ± 1 −1.0% 8.30 8.55 3.0% 18 5.8 LUL 9.66 ± 0.3 9.52 ± 0.3 −1.4% 9.42 9.47 0.5% 19 6.8 LLL 13.00 ± 0.4 12.95 ± 0.4 −0.4% 12.64 12.68 0.3% Average −0.9% (P = 0.002) 0.9% (P = 0.01) LUL = left upper lobe; RML = right middle lobe; RUL = right upper lobe; RLL = right lower lobe; RB = right bronchus; LLL = left lower lobe; LB = left bronchus.
- TABLE 3
Patient Average and Phase 1 Volumes (cm3) with SD for 8 Phases of PAC- and MidV-AC RCPET
Volume (cm3) Patient no. Motion vector (mm) Tumor location PAC average MidV-AC average Difference MidV-AC vs. PAC (average values) PAC phase 1 MidV-AC phase 1 Difference MidV-AC vs.PAC (phase 1 values) 1 4.4 LUL 6.71 ± 0.5 6.72 ± 0.6 0.2% 5.98 6.14 2.7% 2 4.4 RML 1.95 ± 0.1 1.89 ± 0.1 −2.4% 2.23 1.81 −18.8% 3 3.0 LUL 21.82 ± 0.8 22.00 ± 0.9 0.4% 21.43 21.01 −1.9% 4 6.7 RUL 18.63 ± 0.6 18.72 ± 0.7 0.5% 18.26 19.23 5.3% 5 12.3 RLL 45.60 ± 3.6 46.42 ± 3.4 1.8% 44.49 48.58 9.2% 6 10.0 RB 7.55 ± 2.6 7.36 ± 2.7 −2.5% 5.84 4.63 −20.7% 7 3.7 RUL 11.45 ± 1.2 11.23 ± 1.11 −1.9% 9.66 9.92 2.7% 8 6.7 LLL 48.7 ± 6.5 49.5 ± 5.6 1.6% 54.21 54.70 0.9% 9 4.4 LB 1.82 ± 0.3 1.85 ± 0.2 1.9% 1.91 1.92 0.5% 10 15.2 RLL 15.12 ± 0.6 15.28 ± 0.3 1.1% 15.20 15.70 3.3% 11 1.9 RUL 104.2 ± 3.9 103.49 ± 4 −0.7% 106.71 105.53 −1.1% 12 2.5 RB 16.02 ± 0.7 16.08 ± 0.8 0.4% 16.08 16.28 1.3% 13 4.8 RUL 72.89 ± 3.8 73.89 ± 3.5 1.4% 76.25 74.87 −1.8% 14 2.9 RUL 12.06 ± 1.5 12.28 ± 1.4 1.8% 11.27 11.68 3.6% 15 6.6 RML 6.67 ± 0.7 6.72 ± 0.8 0.8% 7.11 7.21 1.4% 16 3.1 LLL 7.04 ± 2.1 6.79 ± 2.1 −3.5% 6.06 5.65 −6.7% 17 15.3 LUL 4.40 ± 0.7 4.42 ± 0.8 0.6% 5.40 5.40 0.0% 18 5.8 LUL 4.28 ± 0.4 4.34 ± 0.4 1.6% 4.47 4.41 −1.4% 19 6.8 LLL 114.95 ± 4.5 114.49 ± 4.4 −0.4% 119.00 120.19 1.0% Average 0.2% (P = 0.6) −1.7% (P = 0.6) LUL = left upper lobe; RML = right middle lobe; RUL = right upper lobe; RLL = right lower lobe; RB = right bronchus; LLL = left lower lobe; LB = left bronchus.
- TABLE 4
Average Differences Between 2 Attenuation-Correction Methods for Average and Phase 1 Values for SUV, Image Quality, and Volume
Parameter Difference MidV-AC vs. PAC (average values) Difference MidV-AC vs. PAC (phase 1 values) SUVmax −0.9% (P = 0.002) 0.9% (P = 0.01) SUV Mean −1.0% (P = 0.007) 0.5% (P = 0.1) Volume 0.2% (P = 0.6) −1.7% (P = 0.6) Signal-to-noise ratio −0.5% (P = 0.3) −0.9% (P = 0.2) Contrast −0.1% (P = 0.4) −0.1% (P = 0.7)


