  • Main menu
  • User menu
  • Search
  • English ▼
    • English
    • Afrikaans
    • Albanian
    • Amharic
    • Arabic
    • Armenian
    • Azerbaijani
    • Basque
    • Belarusian
    • Bengali
    • Bosnian
    • Bulgarian
    • Catalan
    • Cebuano
    • Chichewa
    • Chinese (Simplified)
    • Chinese (Traditional)
    • Corsican
    • Croatian
    • Czech
    • Danish
    • Dutch
    • Esperanto
    • Estonian
    • Filipino
    • Finnish
    • French
    • Frisian
    • Galician
    • Georgian
    • German
    • Greek
    • Gujarati
    • Haitian Creole
    • Hausa
    • Hawaiian
    • Hebrew
    • Hindi
    • Hmong
    • Hungarian
    • Icelandic
    • Igbo
    • Indonesian
    • Irish
    • Italian
    • Japanese
    • Javanese
    • Kannada
    • Kazakh
    • Khmer
    • Korean
    • Kurdish (Kurmanji)
    • Kyrgyz
    • Lao
    • Latin
    • Latvian
    • Lithuanian
    • Luxembourgish
    • Macedonian
    • Malagasy
    • Malay
    • Malayalam
    • Maltese
    • Maori
    • Marathi
    • Mongolian
    • Myanmar (Burmese)
    • Nepali
    • Norwegian
    • Pashto
    • Persian
    • Polish
    • Portuguese
    • Punjabi
    • Romanian
    • Russian
    • Samoan
    • Scottish Gaelic
    • Serbian
    • Sesotho
    • Shona
    • Sindhi
    • Sinhala
    • Slovak
    • Slovenian
    • Somali
    • Spanish
    • Sudanese
    • Swahili
    • Swedish
    • Tajik
    • Tamil
    • Telugu
    • Thai
    • Turkish
    • Ukrainian
    • Urdu
    • Uzbek
    • Vietnamese
    • Welsh
    • Xhosa
    • Yiddish
    • Yoruba
    • Zulu

Main menu

  • Home
  • Content
    • Current
      • JNMT Supplement
    • Ahead of print
    • Past Issues
    • Continuing Education
    • JNMT Podcast
    • SNMMI Annual Meeting Abstracts
  • Subscriptions
    • Subscribers
    • Rates
    • Journal Claims
    • Institutional and Non-member
  • Authors
    • Submit to JNMT
    • Information for Authors
    • Assignment of Copyright
    • AQARA Requirements
  • Info
    • Reviewers
    • Permissions
    • Advertisers
    • Corporate & Special Sales
  • About
    • About Us
    • Editorial Board
    • Contact Information
  • More
    • Alerts
    • Feedback
    • Help
    • SNMMI Journals
  • SNMMI
    • JNMT
    • JNM
    • SNMMI Journals
    • SNMMI

User menu

  • Subscribe
  • My alerts
  • Log in
  • My Cart

Search

  • Advanced search
Journal of Nuclear Medicine Technology
  • SNMMI
    • JNMT
    • JNM
    • SNMMI Journals
    • SNMMI
  • Subscribe
  • My alerts
  • Log in
  • My Cart
Journal of Nuclear Medicine Technology

Advanced Search

English ▼
  • English
  • Afrikaans
  • Albanian
  • Amharic
  • Arabic
  • Armenian
  • Azerbaijani
  • Basque
  • Belarusian
  • Bengali
  • Bosnian
  • Bulgarian
  • Catalan
  • Cebuano
  • Chichewa
  • Chinese (Simplified)
  • Chinese (Traditional)
  • Corsican
  • Croatian
  • Czech
  • Danish
  • Dutch
  • Esperanto
  • Estonian
  • Filipino
  • Finnish
  • French
  • Frisian
  • Galician
  • Georgian
  • German
  • Greek
  • Gujarati
  • Haitian Creole
  • Hausa
  • Hawaiian
  • Hebrew
  • Hindi
  • Hmong
  • Hungarian
  • Icelandic
  • Igbo
  • Indonesian
  • Irish
  • Italian
  • Japanese
  • Javanese
  • Kannada
  • Kazakh
  • Khmer
  • Korean
  • Kurdish (Kurmanji)
  • Kyrgyz
  • Lao
  • Latin
  • Latvian
  • Lithuanian
  • Luxembourgish
  • Macedonian
  • Malagasy
  • Malay
  • Malayalam
  • Maltese
  • Maori
  • Marathi
  • Mongolian
  • Myanmar (Burmese)
  • Nepali
  • Norwegian
  • Pashto
  • Persian
  • Polish
  • Portuguese
  • Punjabi
  • Romanian
  • Russian
  • Samoan
  • Scottish Gaelic
  • Serbian
  • Sesotho
  • Shona
  • Sindhi
  • Sinhala
  • Slovak
  • Slovenian
  • Somali
  • Spanish
  • Sudanese
  • Swahili
  • Swedish
  • Tajik
  • Tamil
  • Telugu
  • Thai
  • Turkish
  • Ukrainian
  • Urdu
  • Uzbek
  • Vietnamese
  • Welsh
  • Xhosa
  • Yiddish
  • Yoruba
  • Zulu
  • Home
  • Content
    • Current
    • Ahead of print
    • Past Issues
    • Continuing Education
    • JNMT Podcast
    • SNMMI Annual Meeting Abstracts
  • Subscriptions
    • Subscribers
    • Rates
    • Journal Claims
    • Institutional and Non-member
  • Authors
    • Submit to JNMT
    • Information for Authors
    • Assignment of Copyright
    • AQARA Requirements
  • Info
    • Reviewers
    • Permissions
    • Advertisers
    • Corporate & Special Sales
  • About
    • About Us
    • Editorial Board
    • Contact Information
  • More
    • Alerts
    • Feedback
    • Help
    • SNMMI Journals
  • Watch or Listen to JNMT Podcast
  • Visit SNMMI on Facebook
  • Join SNMMI on LinkedIn
  • Follow SNMMI on Twitter
  • Subscribe to JNMT RSS feeds
OtherIMAGING

An Automated Method for Delineating a Reference Region Using Masked Volumewise Principal-Component Analysis in 11C-PIB PET

Pasha Razifar, Henry Engler, Anna Ringheim, Sergio Estrada, Anders Wall and Bengt Långström
Journal of Nuclear Medicine Technology March 2009, 37 (1) 38-44; DOI: https://doi.org/10.2967/jnmt.108.054296
Pasha Razifar
  • Find this author on Google Scholar
  • Find this author on PubMed
  • Search for this author on this site
Henry Engler
  • Find this author on Google Scholar
  • Find this author on PubMed
  • Search for this author on this site
Anna Ringheim
  • Find this author on Google Scholar
  • Find this author on PubMed
  • Search for this author on this site
Sergio Estrada
  • Find this author on Google Scholar
  • Find this author on PubMed
  • Search for this author on this site
Anders Wall
  • Find this author on Google Scholar
  • Find this author on PubMed
  • Search for this author on this site
Bengt Långström
  • Find this author on Google Scholar
  • Find this author on PubMed
  • Search for this author on this site
  • Article
  • Figures & Data
  • Info & Metrics
  • PDF
Loading

Article Figures & Data

Figures

  • Tables
  • FIGURE 1. 
    • Download figure
    • Open in new tab
    • Download powerpoint
    FIGURE 1. 

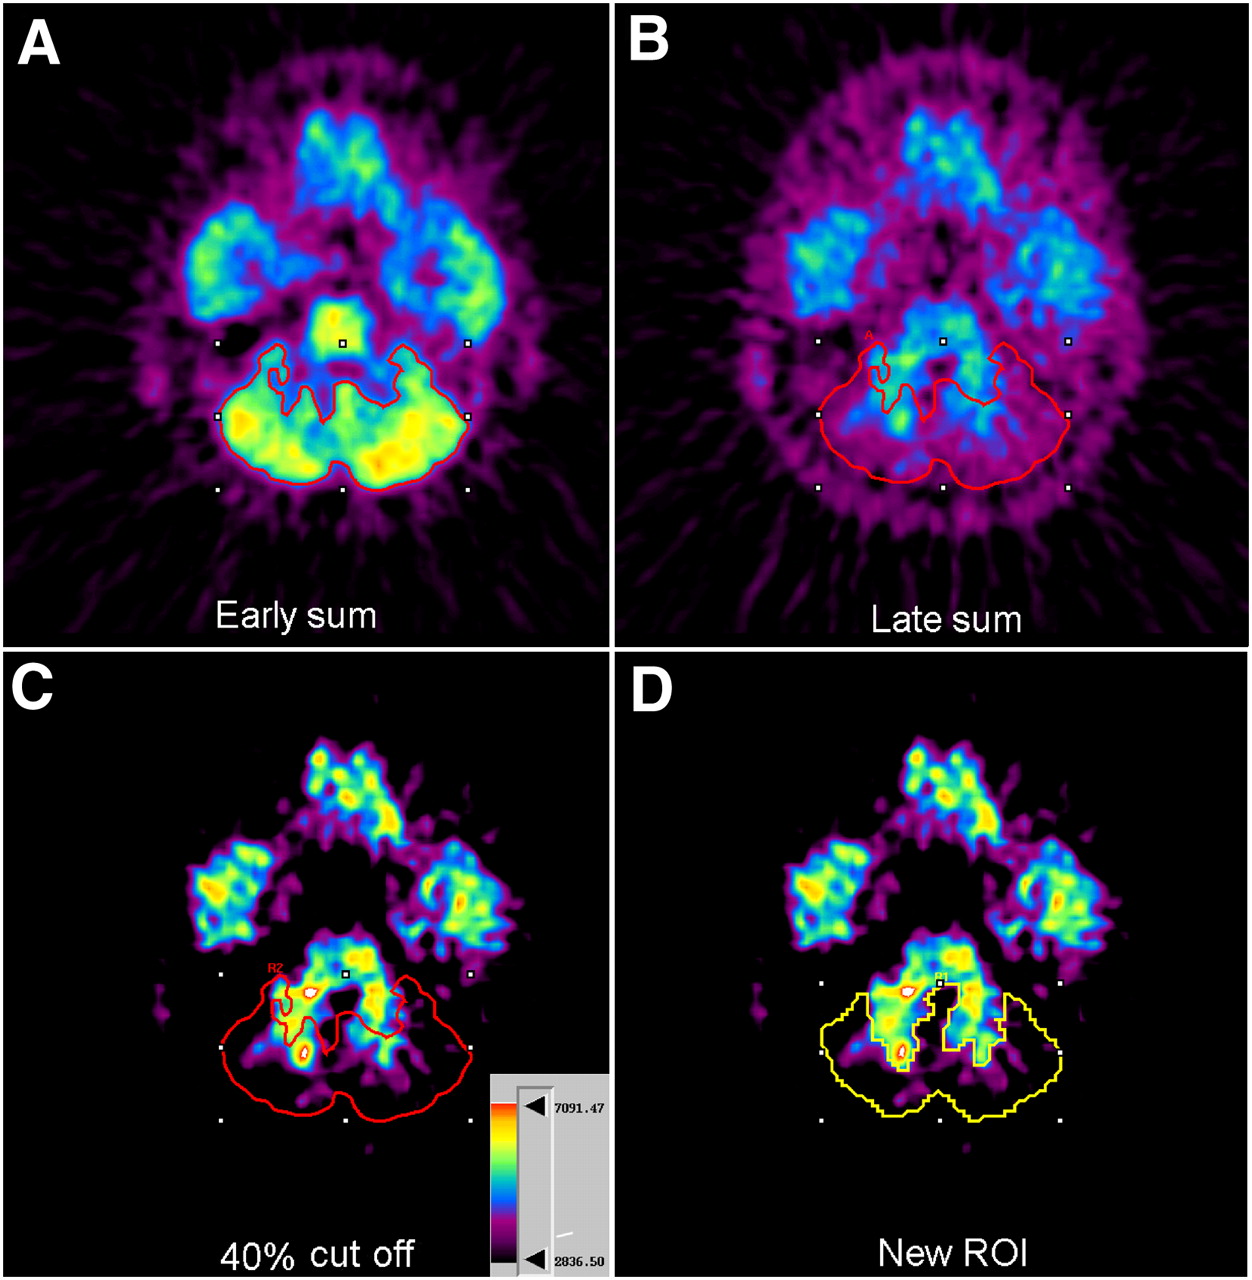
    Manual definition of reference region. Sum images of AD patient are generated using early (A) and late (B) summation of dynamic 11C-PIB PET images, which are used to delineate ROI representing reference region (C).

  • FIGURE 2. 
    • Download figure
    • Open in new tab
    • Download powerpoint
    FIGURE 2. 

    Optimized manual method for definition of reference region. Sum images of AD patient in Figure 1 are generated using early (A) and late (B) summation of dynamic 11C-PIB PET images. Next, 40% cutoff is performed (C), and new ROI defining cerebellum is drawn manually (D).

  • FIGURE 3. 
    • Download figure
    • Open in new tab
    • Download powerpoint
    FIGURE 3. 

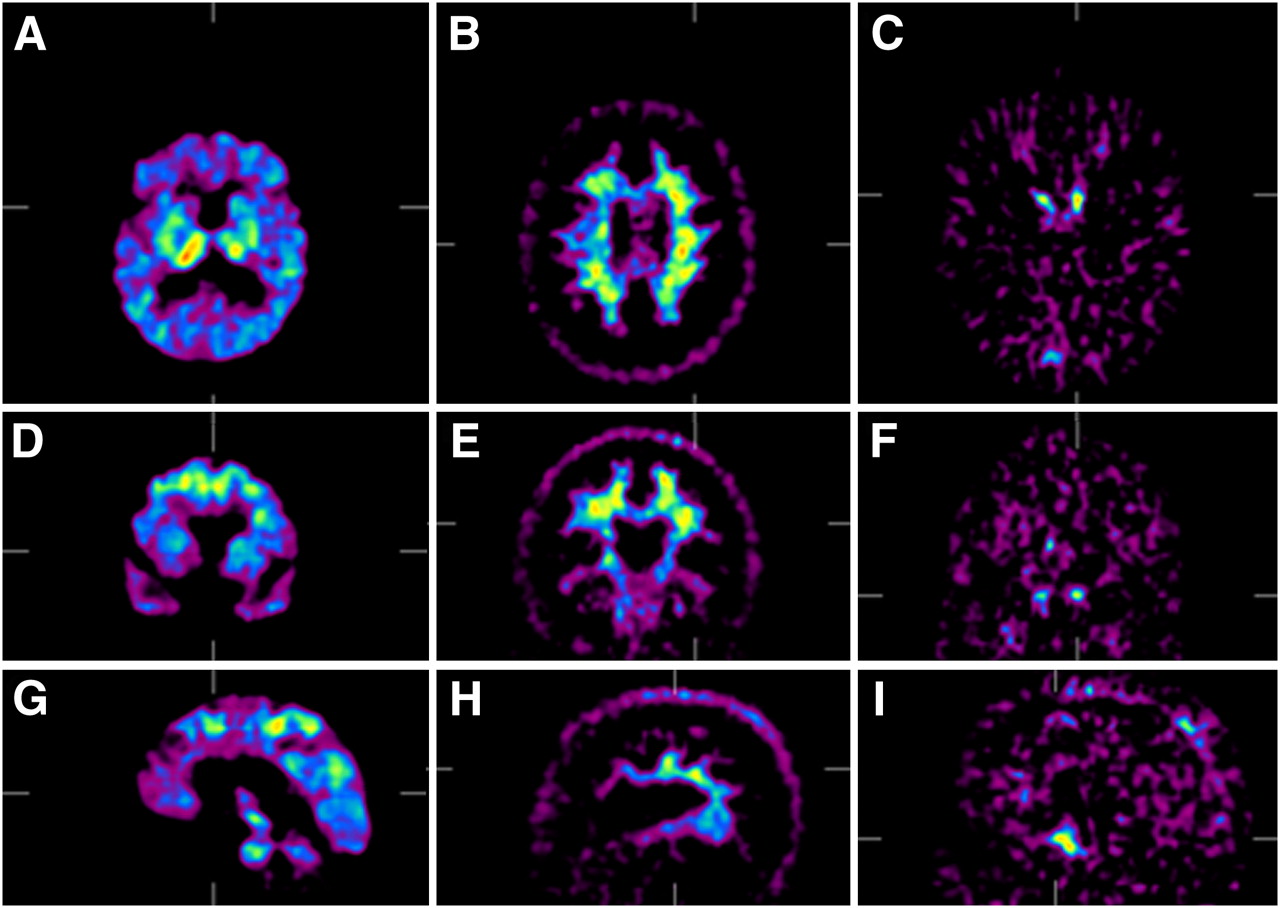
    MVW-PCA application on dynamic 11C-PIB PET images of AD patient. Images from components 1–3 are shown in different views. MVW-PC1 (A–C) corresponds to kinetics of tracer in regions affected by Aβ-amyloid deposits as frontal cortex, anterior cingulate cortex, and temporal cortex. In MVW-PC2 (D–F), delineated cortical areas are devoid of amyloid. Projection planes were selected to illustrate cerebellum. In MVW-PC3 (G–I), kinetic behavior of tracer in blood was extracted and major blood vessels are seen.

  • FIGURE 4. 
    • Download figure
    • Open in new tab
    • Download powerpoint
    FIGURE 4. 

    MVW-PCA application on dynamic 11C-PIB PET images of HC. Images from components 1–3 are shown in different views. MVW-PC1 (A–C) corresponds to kinetics of tracer in regions with 11C-PIB retention as thalamus. In MVW-PC2 (D–F), white matter is extracted and delineated. In MVW-PC3 (G–I), kinetic behavior of tracer in blood was extracted and major blood vessels are seen.

  • FIGURE 5. 
    • Download figure
    • Open in new tab
    • Download powerpoint
    FIGURE 5. 

    Illustration of automatic definition of ROI representing cerebellum, using MVW-PC2 image (A), binary image (B), selected area representing reference region (C), and edge pixels imported into MVW-PC3 image for further exploration (D).

  • FIGURE 6. 
    • Download figure
    • Open in new tab
    • Download powerpoint
    FIGURE 6. 

    Time–activity curves plotted using arbitrarily chosen reference region of AD patient (Fig. 5) generated by automatic method (red line) and manual method (blue line).

  • FIGURE 7. 
    • Download figure
    • Open in new tab
    • Download powerpoint
    FIGURE 7. 

    Illustration of automatic definition of ROI representing cerebellum using MVW-PC2 image (A and C); defined ROI was imported into corresponding slice in MVW-PC3 image (B and D) for 2 arbitrarily chosen AD patients.

  • FIGURE 8. 
    • Download figure
    • Open in new tab
    • Download powerpoint
    FIGURE 8. 

    MVW-PC2 image (A) obtained by applying MVW-PCA on arbitrarily chosen HC (also shown in Fig. 4). Corresponding inverted MVW-PC2 image (B) was generated by inverted weighting factors obtained from application of MVW-PCA. Outlined reference region in MVW-PC2 image was obtained using automatic method (C), and ROI was imported into MVW-PC3 image for further exploration (D).

  • FIGURE 9. 
    • Download figure
    • Open in new tab
    • Download powerpoint
    FIGURE 9. 

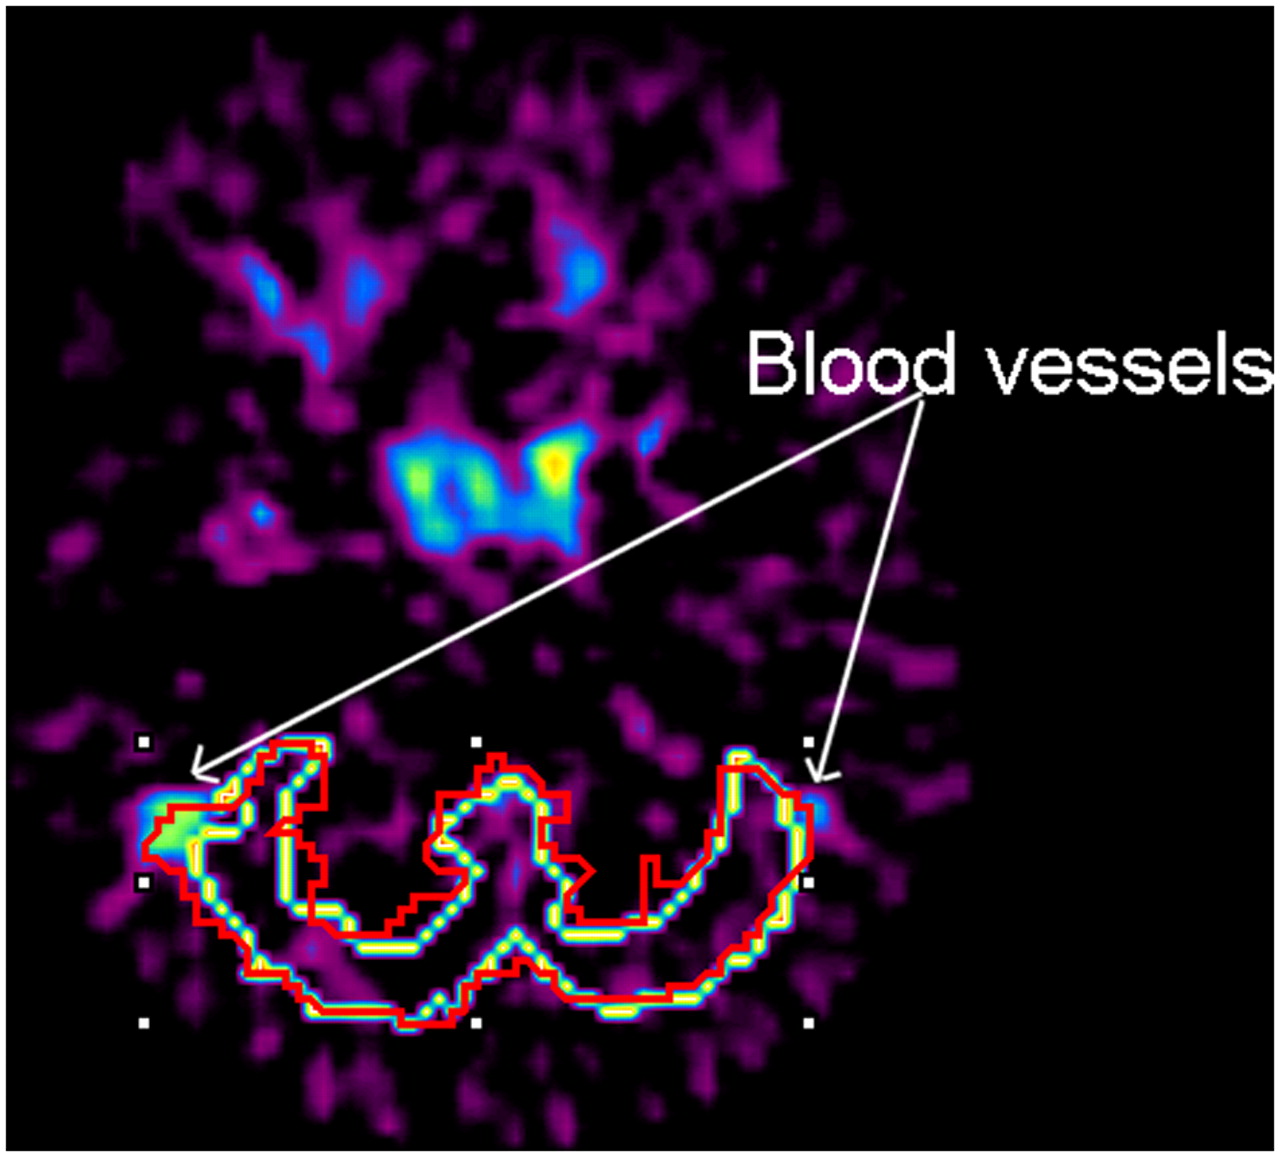
    Both automatically (yellow) and manually (red) delineated reference regions were imported into corresponding PC3 image. Here, ROI that was defined manually (red) covered parts of blood vessels in both right and left sides of reference region. Mean value of pixels covered by ROI was affected. Automatically defined ROI (yellow) did not cover blood vessels.

  • FIGURE 10. 
    • Download figure
    • Open in new tab
    • Download powerpoint
    FIGURE 10. 

    MRI scan of AD patient (A), fused image using same MRI slice corresponding MVW-PC2 image (B), and MRI scan with delineated ROI (representing reference region) superimposed (C) are shown.

  • FIGURE 11. 
    • Download figure
    • Open in new tab
    • Download powerpoint
    FIGURE 11. 

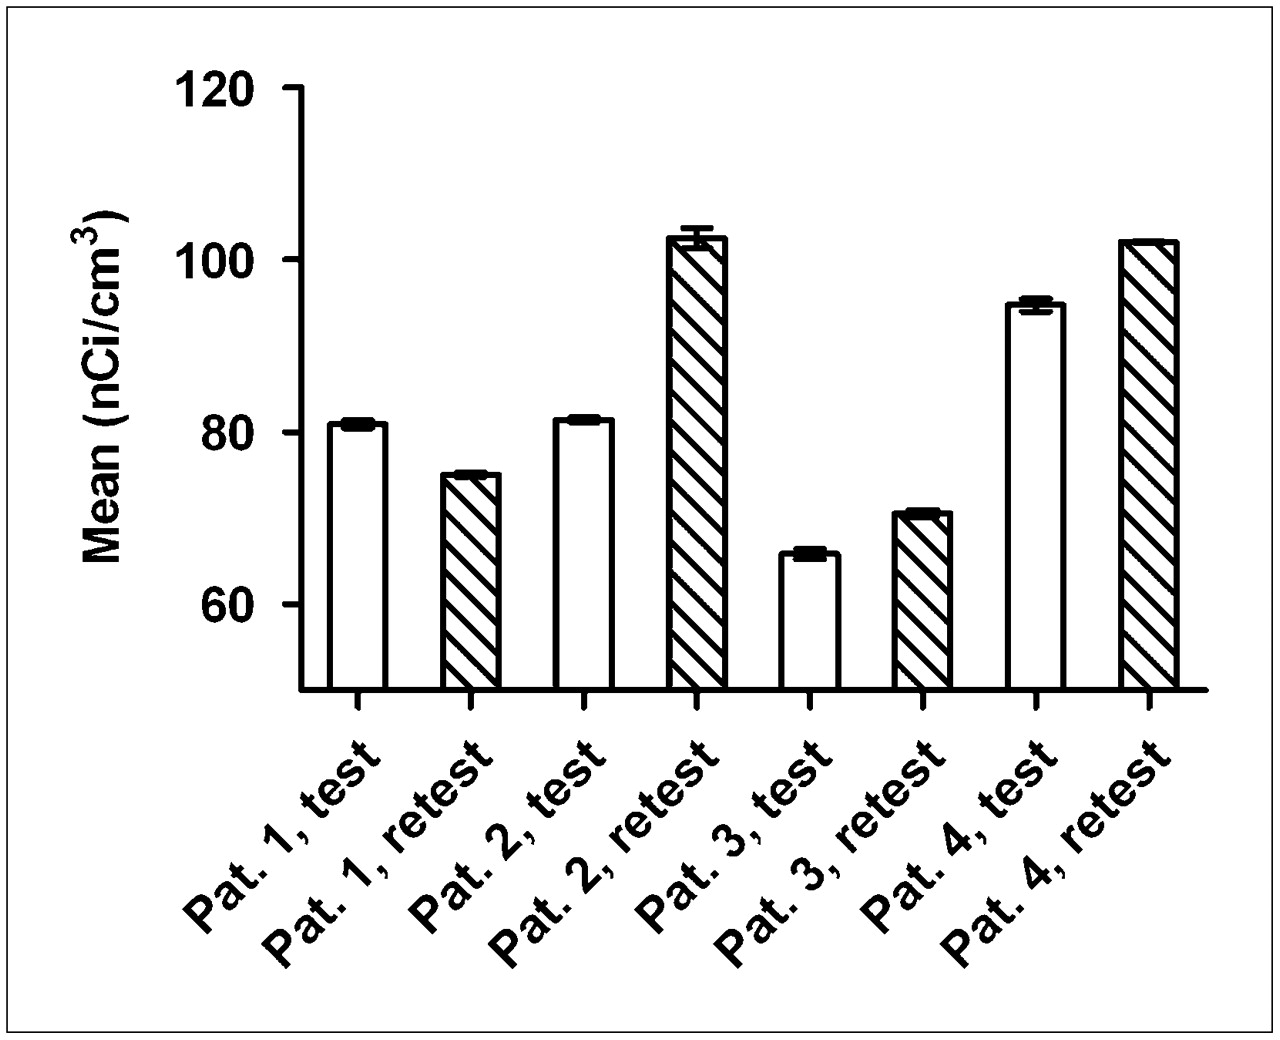
    Diagram showing mean activity concentration, with statistical variation of pixel values within ROIs positioned in test and retest PET studies on AD patient, when reference region is repeatedly defined using manual method. Pat. = patient.

  • FIGURE 12. 
    • Download figure
    • Open in new tab
    • Download powerpoint
    FIGURE 12. 

    Diagram comparing correlation variation (coefficient of variance) of mean pixel values of ROIs positioned in test and retest PET studies on AD patient, when reference region is defined manually and repeatedly. Pat. = patient.

Tables

  • Figures
    • View popup
    TABLE 1

    Automatic vs. Manual Outlining of Reference Region

    Patient no.Mean activityAbsolute value of activity difference(%)No. of pixels
    AutomaticManualAutomaticManual
    13,248.523,163.992.60684204
    23,363.343,459.092.85858614
    31,961.702,140.119.09905778
    44,203.954,062.693.36827703
    • Difference in patient 3 is largest because manually defined ROI covered blood vessels (Fig. 9)

PreviousNext
Back to top

In this issue

Journal of Nuclear Medicine Technology: 37 (1)
Journal of Nuclear Medicine Technology
Vol. 37, Issue 1
March 2009
  • Table of Contents
  • About the Cover
  • Index by author
Print
Download PDF
Article Alerts
Email Article
Citation Tools
Share
An Automated Method for Delineating a Reference Region Using Masked Volumewise Principal-Component Analysis in 11C-PIB PET
Pasha Razifar, Henry Engler, Anna Ringheim, Sergio Estrada, Anders Wall, Bengt Långström
Journal of Nuclear Medicine Technology Mar 2009, 37 (1) 38-44; DOI: 10.2967/jnmt.108.054296
Twitter logo Facebook logo LinkedIn logo Mendeley logo
  • Tweet Widget
Bookmark this article

Jump to section

  • Article
    • Abstract
    • MATERIALS AND METHODS
    • RESULTS
    • DISCUSSION
    • CONCLUSION
    • Acknowledgments
    • Footnotes
    • References
  • Figures & Data
  • Info & Metrics
  • PDF

Related Articles

  • Erratum
  • PubMed
  • Google Scholar

Cited By...

  • Signal Extraction and Separation in In Vivo Animal PET Studies with Masked Volumewise Principal-Component Analysis
  • Google Scholar

More in this TOC Section

  • Early 10-Minute Postinjection [18F]F-FAPI-42 uEXPLORER Total-Body PET/CT Scanning Protocol for Staging Lung Cancer Using HYPER Iterative Reconstruction
  • Single- Versus Dual-Time-Point Imaging for Transthyretin Cardiac Amyloid Using 99mTc-Pyrophosphate
  • Does Arthrography Improve Accuracy of SPECT/CT for Diagnosis of Aseptic Loosening in Patients with Painful Knee Arthroplasty: A Systematic Review and Metaanalysis
Show more Imaging

Similar Articles

  • Signal Extraction and Separation in In Vivo Animal PET Studies with Masked Volumewise Principal-Component Analysis
  • Erratum
See more
SNMMI

© 2025 SNMMI

Powered by HighWire
Alerts for this Article
Sign In to Email Alerts with your Email Address
Email this Article

Thank you for your interest in spreading the word on Journal of Nuclear Medicine Technology.

NOTE: We only request your email address so that the person you are recommending the page to knows that you wanted them to see it, and that it is not junk mail. We do not capture any email address.

Enter multiple addresses on separate lines or separate them with commas.
An Automated Method for Delineating a Reference Region Using Masked Volumewise Principal-Component Analysis in 11C-PIB PET
(Your Name) has sent you a message from Journal of Nuclear Medicine Technology
(Your Name) thought you would like to see the Journal of Nuclear Medicine Technology web site.
Citation Tools
An Automated Method for Delineating a Reference Region Using Masked Volumewise Principal-Component Analysis in 11C-PIB PET
Pasha Razifar, Henry Engler, Anna Ringheim, Sergio Estrada, Anders Wall, Bengt Långström
Journal of Nuclear Medicine Technology Mar 2009, 37 (1) 38-44; DOI: 10.2967/jnmt.108.054296

Citation Manager Formats

  • BibTeX
  • Bookends
  • EasyBib
  • EndNote (tagged)
  • EndNote 8 (xml)
  • Medlars
  • Mendeley
  • Papers
  • RefWorks Tagged
  • Ref Manager
  • RIS
  • Zotero

We use cookies on this site to enhance your user experience

By clicking any link on this page you are giving your consent for us to set cookies.