


Abstract
Kinetic modeling using a reference region is a common method for the analysis of dynamic PET studies. Available methods for outlining regions of interest representing reference regions are usually time-consuming and difficult and tend to be subjective; therefore, MRI is used to help physicians and experts to define regions of interest with higher precision. The current work introduces a fast and automated method to delineate the reference region of images obtained from an N-methyl-11C-2-(4′-methylaminophenyl)-6-hydroxy-benzothiazole (11C-PIB) PET study on Alzheimer disease patients and healthy controls using a newly introduced masked volumewise principal-component analysis. Methods: The analysis was performed on PET studies from 22 Alzheimer disease patients (baseline, follow-up, and test/retest studies) and 4 healthy controls, that is, a total of 26 individual scans. The second principal-component images, which illustrate the kinetic behavior of the tracer in gray matter of the cerebellar cortex, were used as input data for automatic delineation of the reference region. To study the variation associated with the manual and proposed automatic methods, we defined the reference region repeatedly. Results: As expected, the automatic method showed no variation whereas the manual method varied significantly on repetition. Furthermore, the automatic method was significantly faster, more robust, and less biased. Conclusion: The automatic method is helpful in the delineation of the reference region of 11C-PIB PET studies of the human brain and is much faster and more precise than manual delineation.
- positron emission tomography
- masked volumewise principal-component analysis
- automatic delineation
- reference region
- Alzheimer disease
PET is an excellent tool for providing information about tissue that differs between healthy controls (HCs) and patients with Alzheimer disease (AD). This imaging technique is increasingly being used for early diagnosis of several neurologic disorders such as AD. Our group and others have used PET with the amyloid imaging agent N-methyl-11C-2-(4′-methylaminophenyl)-6-hydroxy-benzothiazole (11C-PIB) for in vivo studies of amyloid deposition in the brains of AD patients (1–6). These studies have shown that 11C-PIB may improve our knowledge and understanding of the disease and may be used to evaluate potential therapeutic drugs.
Besides being used for analyses of activity distribution and standardized uptake values, dynamic PET data can be further processed and modeled using different kinetic modeling techniques to extract quantitative values of a desired physiologic, biochemical, or pharmacologic entity (7–10). Kinetic models need either the determination of the time course of a plasma input function or the definition of a reference region void of specific binding.
The regions of interest (ROIs) of the target and reference tissues are usually outlined manually on early and late summation images, depending on the tracer used. When available, MRI scans are used for partial-volume correction and for the definition of ROIs (11). However, knowledge of the kinetic behavior of the administered tracer is necessary to sum the images of relevant frames in the sequence of the study in which the particular signal is proportionally larger. Experience has shown that the summation tends to reduce both the contrast between different parts of the brain and the differences between regions with different kinetic behaviors. Therefore, the manual outlining of ROIs is both time-consuming and prone to errors, depending on who draws them.
Moreover, images generated in such PET studies are inherently noisy because of limitations in the amount of the administered tracer and technical considerations such as counting-rate limitations, scanning time, applied corrections, and the chosen reconstruction algorithm. A high magnitude of noise, correlation between the elements of the images in conjunction with the high level of nonspecific binding to the target, and a sometimes small difference in target expression between pathologic and healthy regions are factors that make the analysis of PET data difficult (12,13).
Previously, we showed that application of principal-component analysis to dynamic PET images, such as the use of masked volumewise principal-component analysis (MVW-PCA) in 11C-PIB PET studies, generates images with improved signal-to-noise ratio and improved diagnostic values (14,15). Compared with images generated using methods such as summation or modeling, MVW-PCA images contain more detailed anatomic information, with higher quality, precision, contrast, and visualization. We have shown that MVW-PCA can be used as a multivariate analysis technique that, without modeling assumptions, can separate the data into images reflecting different components that may correlate with some kinetic information, such as blood flow or tracer accumulation.
The aim of this study was to use MVW-PCA to introduce a new, fast, and automated method for defining and outlining the reference region in brain 11C-PIB PET studies of AD patients and HCs.
MATERIALS AND METHODS
Participants
Data from 22 AD scans (2 × 11) and 4 HC scans (total of 26 scans) were used in this study. The scans were recruited from various studies performed at Uppsala Imanet in collaboration with several research groups. Scans from 7 AD patients and 4 HCs were selected randomly from a study performed in collaboration with Karolinska University Hospital Huddinge and University of Pittsburgh School of Medicine (4). Follow-up scans from these 7 patients were also used (6). Furthermore, we included the test/retest scans of 4 AD patients studied by Uppsala Imanet and Karolinska University Hospital Huddinge (6).
Radiotracer
The radiotracer 11C-PIB was produced according to the standard good manufacturing process at Uppsala Imanet. The synthesis was done according to Mathis et al. (3).
Manual Delineation of Reference Region
Conventional Method.
The method used to define the ROI representing the reference region was based on a visual comparison of the early and late summations of the dynamic 11C-PIB PET data.
In the late-summation images, the threshold bar was drawn down until small hot spots (4–10 pixels) were visible in white matter when a rainbow white color map was applied. The external border of the cerebellum was drawn using the early summation, with the late summation used for comparison (Fig. 1). The internal border of the cerebellum was drawn by following the contour of the uptake of the white matter seen in the late summation (4). Both the external and the internal borders of the cerebellum can be outlined differently, depending on who draws the ROI. Therefore, it was necessary to improve this method to avoid subjective differences in the way the ROI was drawn.

Manual definition of reference region. Sum images of AD patient are generated using early (A) and late (B) summation of dynamic 11C-PIB PET images, which are used to delineate ROI representing reference region (C).
Optimized Manual Method.
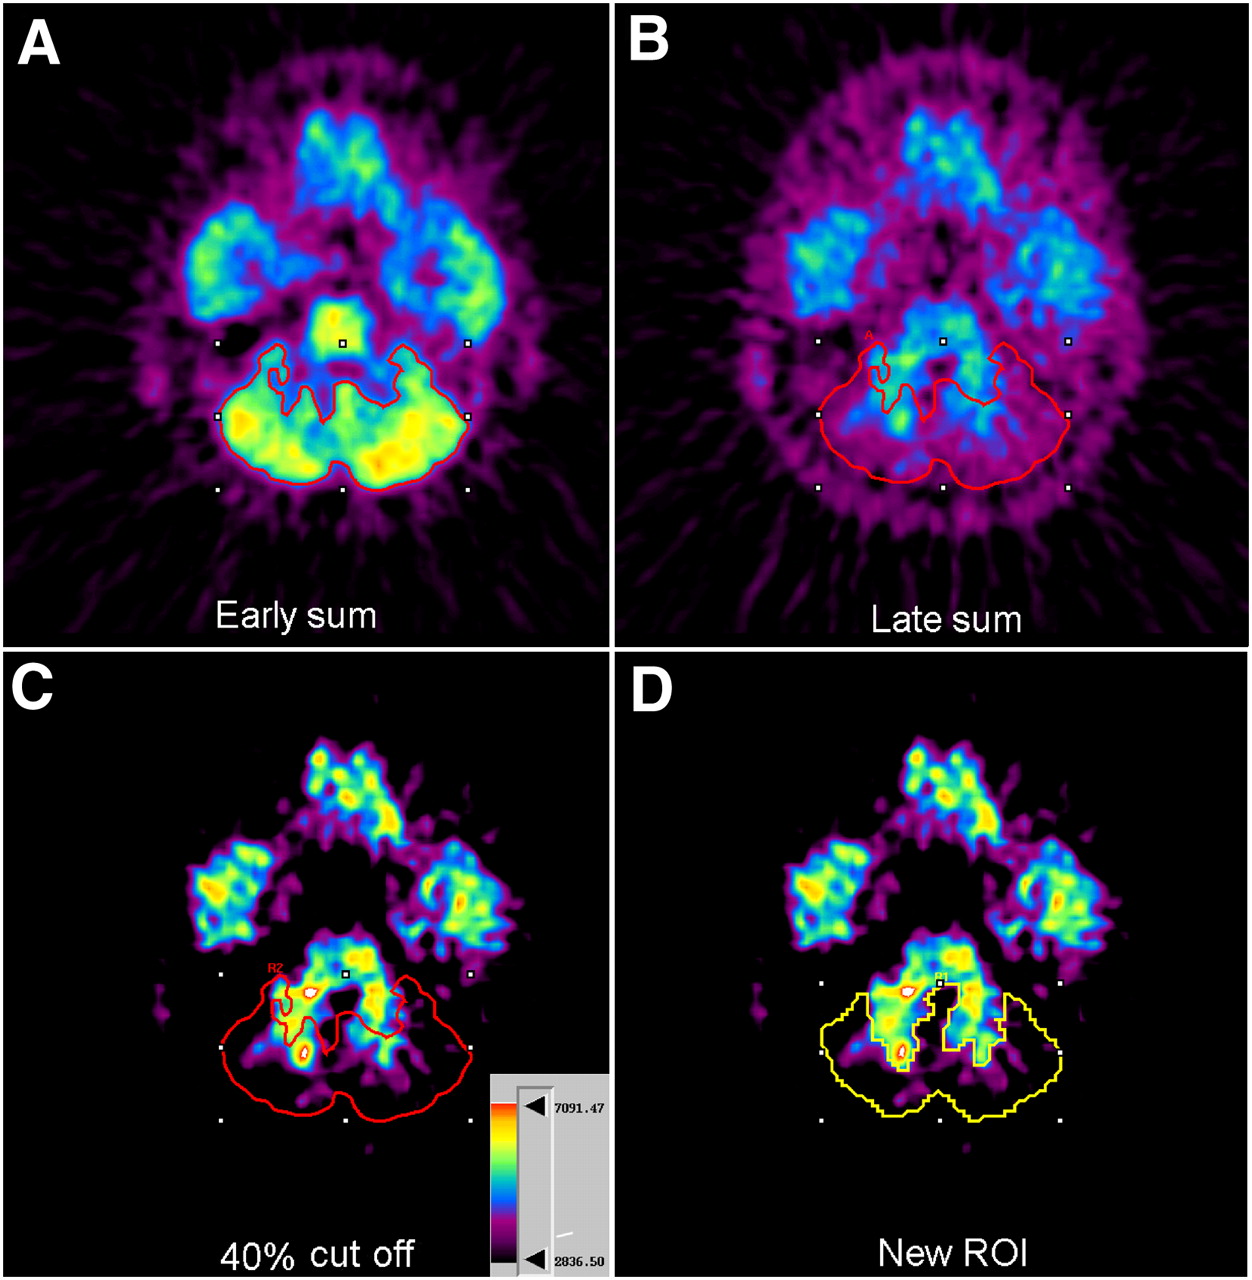
To standardize the outlining of the reference region, we used summation images representing the first 6 min of the sequence. These images were similar to images based on the unidirectional influx rate constant, K1, which were almost identical to the blood flow images. These images contained sufficient anatomic information for positioning of the ROI (16).
The slice in which the cerebellum was most clearly seen at the level of the pons was chosen for each subject. The external border of the cerebellum was determined semiautomatically using the isocontour function in which the maximum value of the pixel within the ROI could be modified manually (Fig. 2A). The defined ROI was imported into the corresponding slice in the late summation, at 40–60 min (Fig. 2B).

Optimized manual method for definition of reference region. Sum images of AD patient in Figure 1 are generated using early (A) and late (B) summation of dynamic 11C-PIB PET images. Next, 40% cutoff is performed (C), and new ROI defining cerebellum is drawn manually (D).
Subsequently, the threshold bar was drawn down until small hot spots (4–10 pixels) were seen in the white matter. Next, 40% of the activity measured in the hot spot was calculated, and values below this cutoff were excluded (Fig. 2C). This procedure was applied to visually eliminate the areas with uptake 40% lower than the highest uptake registered in the white matter. The idea of using a 40% cutoff was based on empirically performed examinations of many patients (6) that showed this cutoff to improve the precision of definition.
A new ROI was drawn representing the external border of the first ROI and the internal border against the white matter. The imported ROI was removed from the image (Fig. 2D).
Our experience showed that this procedure was a good approach for excluding from the defined ROI as many pixels as possible representing the cerebellar medulla.
Using this method, we required about 10–15 min to outline a reference region. The time varied depending on who performed the outlining procedure.
Automated Definition and Delineation of Reference Region
MVW-PCA.
MVW-PCA was introduced as a novel approach for the application of principal-component analysis to dynamic human PET images (14). This method uses a noise-prenormalized dataset that represents the whole brain as a single variable in each frame after the background has been removed (masked) and before principal-component analysis has been applied. These images represent different kinetic behaviors of the administered tracer and contain anatomic information that is more detailed and of higher quality than the information from images generated using summation or modeling. Moreover, compared with parametric images and summed images, MVW-PCA images have an improved signal-to-noise ratio and improved visual contrast between anatomic structures representing the affected and unaffected tissues in the human brain.
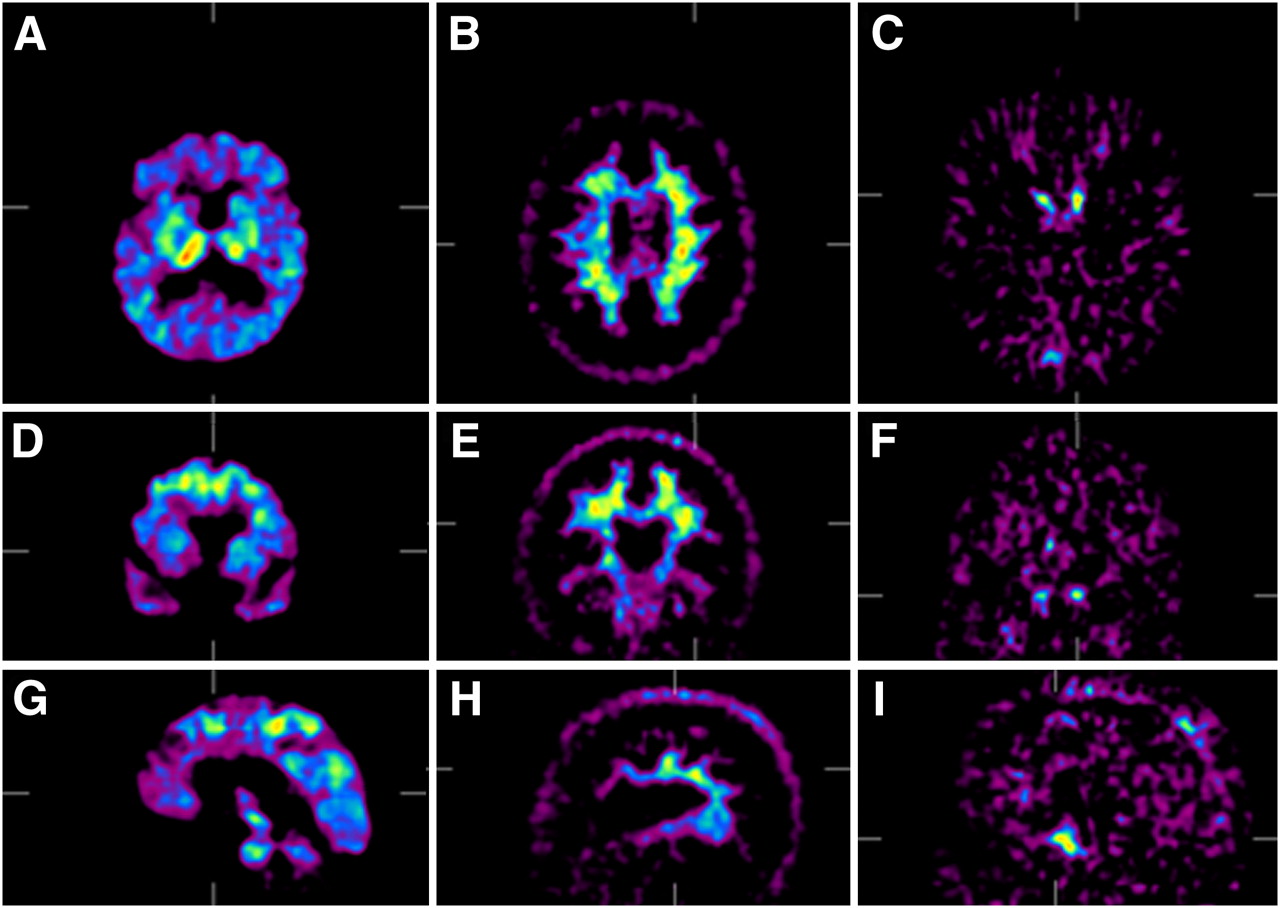
Figures 3 and 4 illustrate the results from applying MVW-PCA to images generated from a PET study on 1 AD patient and 1 HC, respectively, using 11C-PIB. The first 3 principal components illustrate 3 different kinetic behaviors of administered 11C-PIB in the brain of the patient and the HC. MVW-PC1 corresponds to the most predominant kinetic behavior of the tracer in different regions, such as the frontal cortex in the AD patient and the thalamus in the HC. MVW-PC2 images illustrate additional information by extracting cortical areas in AD patients and white matter in HCs. Finally, MVW-PC3 images illustrate the kinetic behavior of the administered tracer in blood vessels.

MVW-PCA application on dynamic 11C-PIB PET images of AD patient. Images from components 1–3 are shown in different views. MVW-PC1 (A–C) corresponds to kinetics of tracer in regions affected by Aβ-amyloid deposits as frontal cortex, anterior cingulate cortex, and temporal cortex. In MVW-PC2 (D–F), delineated cortical areas are devoid of amyloid. Projection planes were selected to illustrate cerebellum. In MVW-PC3 (G–I), kinetic behavior of tracer in blood was extracted and major blood vessels are seen.

MVW-PCA application on dynamic 11C-PIB PET images of HC. Images from components 1–3 are shown in different views. MVW-PC1 (A–C) corresponds to kinetics of tracer in regions with 11C-PIB retention as thalamus. In MVW-PC2 (D–F), white matter is extracted and delineated. In MVW-PC3 (G–I), kinetic behavior of tracer in blood was extracted and major blood vessels are seen.
Automated Delineation of Reference Region.
After MVW-PCA had been applied to the whole dataset for each patient, MVW-PC2 images were used as input data. These images contained information about regions in which the tracer kinetics were different from those in regions visualized in MVW-PC1 images, such as the cerebellar cortex These images were used as input data for a program developed in-house for automatic definition of the cerebellum using Matlab 7.0 (The MathWorks) with installed statistical and image-processing toolboxes. Because MVW-PC2 images of HCs illustrate white matter, inverted weighting factors should be used to generate MVW-PC2 images in which the gray matter of cerebellum is illustrated before a dataset is used. Weighting factors for the generation of MVW-PC2 images are controlled automatically as well.
The algorithm consists of the following steps:
Use MVW-PC2 images as input data to outline reference region (Fig. 5A).
Create binary images of the MVW-PC2 images slicewise using the method of Otsu (17) (Fig. 5B).
Select the object with an area totaling more than 250 pixels (empirically chosen) in each image (Fig. 5C).
Fill the holes within the selected region in each slice by setting the zero-labeled 4-connected-neighbor pixels to 1.
Save the coordinates of the pixels representing the selected area for each slice.
Import the pixels representing the selected region into the original dynamic PET images and calculate the mean values of the pixels within the defined region.
Plot the time–activity curves for the regions defined in each slice using the dynamic PET images for further exploration.
Define edge pixels by removing interior pixels. This option sets a pixel to 0 if all its 4-connected neighbors are 1, thus leaving only the boundary pixels. Save the coordinates (Fig. 5D).
Import edge pixels representing the outlined regions into MVW-PC3 images for further exploration and control.

Illustration of automatic definition of ROI representing cerebellum, using MVW-PC2 image (A), binary image (B), selected area representing reference region (C), and edge pixels imported into MVW-PC3 image for further exploration (D).
As a result, the cerebellum was automatically outlined in the MVW-PC2 image, and the ROI was imported into the corresponding MVW-PC3 image to ensure visually that the ROI covered no blood vessels. Different statistical measurements such as the mean and SD of the pixels within the ROI were calculated, and time–activity curves were plotted automatically when the procedure was performed.
Repetitive Definition of Reference Region
Data for performing repetitive delineation of the reference region were collected from a test/retest human brain 11C-PIB PET study included in a follow-up study by our group (6). The cerebellum was outlined consecutively 3 times both manually and automatically for each patient. Mean, SD, and coefficient of variance were calculated for each attempt, and statistical comparisons were performed. In this study, Graph Pad Prism, version 4.03 (Graph Pad Software, Inc.), was used to perform all statistical analysis and graphic illustrations.
Computerized Reorientation and Coregistration
MVW-PC2 images were reoriented and coaligned on corresponding MRI scans using a computerized reorientation program called the computerized brain atlas, which was developed by Andersson and Thurfjell (18), for comparison. This procedure was performed to investigate the precision of the proposed method.
RESULTS
The different steps are shown in Figure 5, which illustrates the results from the automated procedure to delineate the reference region, using MVW-PCA on an arbitrarily chosen AD patient. The time–activity curves obtained using images generated with the automated and manual methods show that almost identical results were obtained by the 2 methods (Fig. 6). Moreover, automatic definition and delineation of the reference region worked well for both HCs and AD patients (Figs. 7 and 8).

Time–activity curves plotted using arbitrarily chosen reference region of AD patient (Fig. 5) generated by automatic method (red line) and manual method (blue line).

Illustration of automatic definition of ROI representing cerebellum using MVW-PC2 image (A and C); defined ROI was imported into corresponding slice in MVW-PC3 image (B and D) for 2 arbitrarily chosen AD patients.

MVW-PC2 image (A) obtained by applying MVW-PCA on arbitrarily chosen HC (also shown in Fig. 4). Corresponding inverted MVW-PC2 image (B) was generated by inverted weighting factors obtained from application of MVW-PCA. Outlined reference region in MVW-PC2 image was obtained using automatic method (C), and ROI was imported into MVW-PC3 image for further exploration (D).
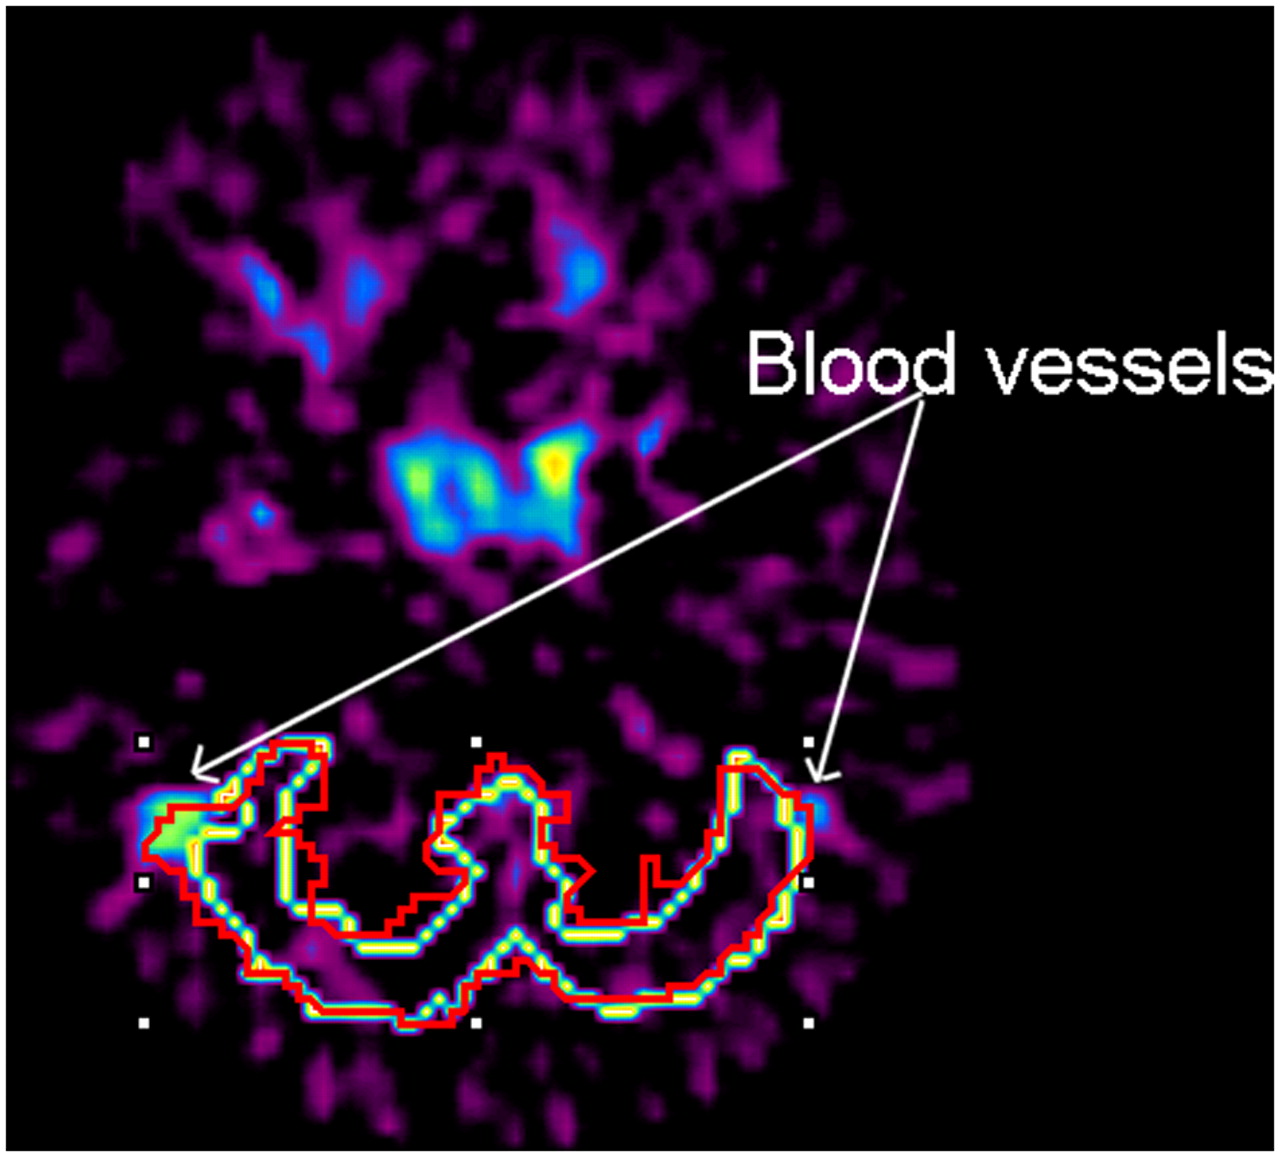
The results obtained from importing, slice by slice, both manually and automatically defined ROIs into the MVW-PC3 images are given for further comparison. Some of the manually delineated ROIs included the blood vessels in either one or both sides of the reference region, but this problem was avoided using the automatic method (Fig. 9). The variation between the mean activities of the pixels within the manually and automatically outlined reference regions was between 2.5% and 9%. Table 1 shows the difference between automatic and manual delineation of the gray matter of the cerebellum in 4 arbitrarily chosen images of AD patients.

Both automatically (yellow) and manually (red) delineated reference regions were imported into corresponding PC3 image. Here, ROI that was defined manually (red) covered parts of blood vessels in both right and left sides of reference region. Mean value of pixels covered by ROI was affected. Automatically defined ROI (yellow) did not cover blood vessels.
Automatic vs. Manual Outlining of Reference Region
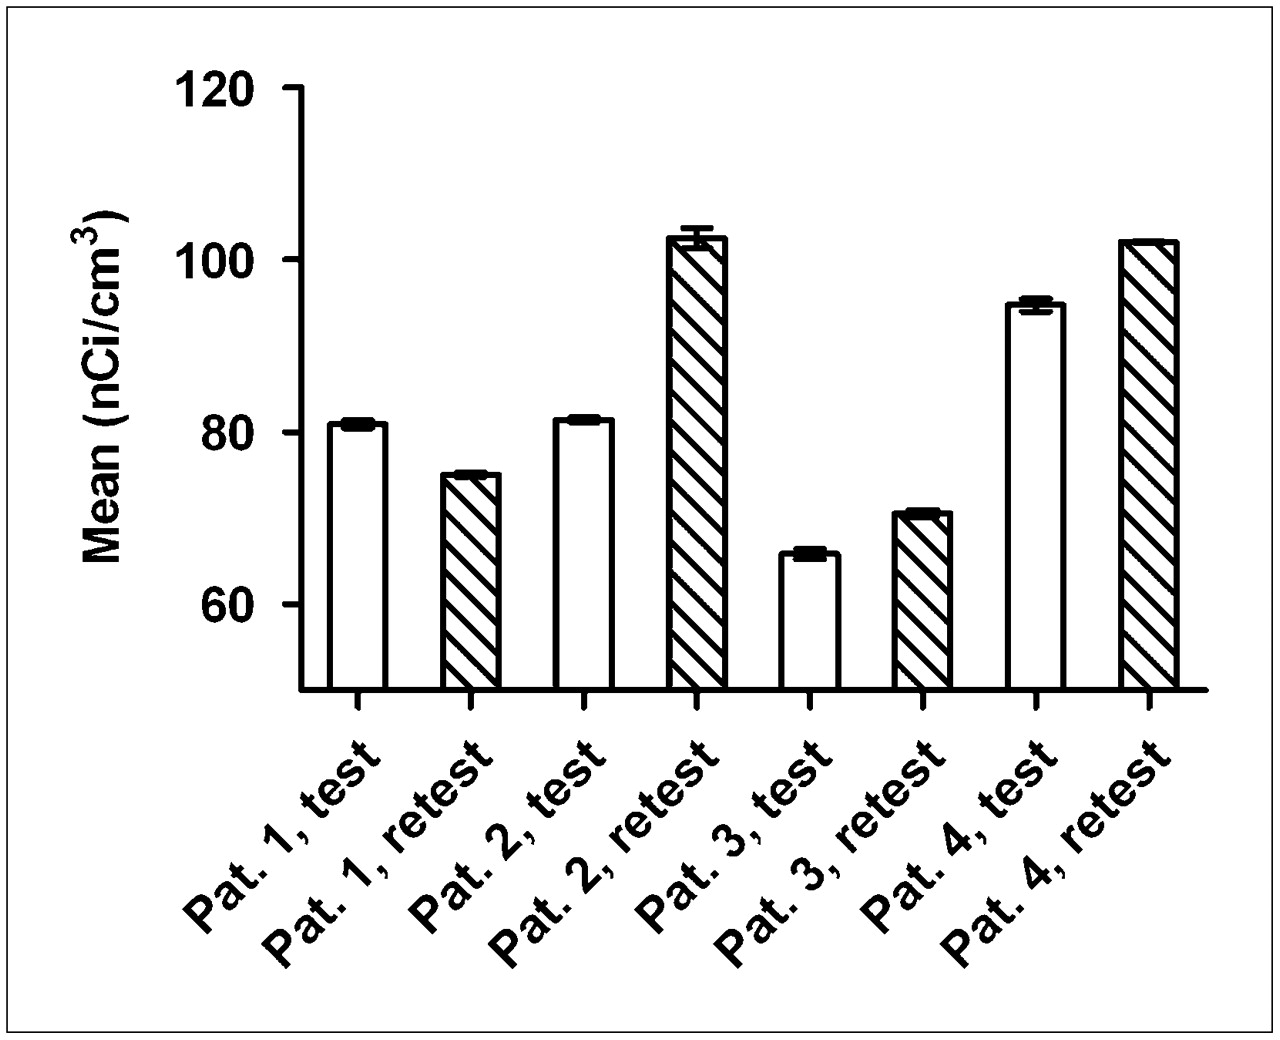
When a MVW-PC2 image including the delineated ROI (representing reference region) was superimposed on an MRI scan, it was evident that the automatically drawn ROI followed the gray matter of cerebellar cortex for each AD patient and HC and did not cover blood vessels (Fig. 10). Finally, when comparing the results of repetitive definition of reference regions obtained by the 2 methods, we found small variations between different attempts when delineation was performed manually but no variation when the automated method was used (Figs. 11 and 12).

MRI scan of AD patient (A), fused image using same MRI slice corresponding MVW-PC2 image (B), and MRI scan with delineated ROI (representing reference region) superimposed (C) are shown.

Diagram showing mean activity concentration, with statistical variation of pixel values within ROIs positioned in test and retest PET studies on AD patient, when reference region is repeatedly defined using manual method. Pat. = patient.

Diagram comparing correlation variation (coefficient of variance) of mean pixel values of ROIs positioned in test and retest PET studies on AD patient, when reference region is defined manually and repeatedly. Pat. = patient.
DISCUSSION
This study introduced a fast and automated method for outlining reference regions by using higher-order images generated by the application of MVW-PCA to dynamic 11C-PIB PET images of the human brain. As shown in Figures 3 and 4, application of MVW-PCA to dynamic 11C-PIB PET images of AD patients and HCs generates 3 different datasets separated into 3 uncorrelated components. These separations are based on the different kinetic behaviors of 11C-PIB in the brain tissues of AD patients and HCs.
MVW-PC2 images contain information about the kinetic behavior of 11C-PIB in the gray matter of the cerebellar cortex in AD patients and white matter in HCs. This information is used to create the proposed automated method, which can help the analyst, even an experienced one, to delineate the reference region of human 11C-PIB PET studies. Information obtained from MVW-PC3 images, which show the kinetic behavior of the tracer in blood, is used to ensure that outlined ROIs representing cerebellum do not include the blood vessels near the cerebellum.
Notably for HCs, MVW-PC2 images contained information about the kinetics of 11C-PIB in white matter instead of gray matter; hence, new images that showed the gray matter of the cerebellum were generated using inverted MVW-PC2 weighting factors (Fig. 8).
Despite our good experience using the optimized manual approach to delineate the cerebellum, our experienced analyst had some difficulty defining the contours of the cerebellum manually because summation tended to reduce the contrast between different parts of the brain and dampen the differences between regions such as white and gray matter in AD patients and HCs. However, the automatic method appears to have solved these problems in this dataset.
In contrast to the automated method, some of the manually defined ROIs included the blood vessels in both the right and the left sides of the reference region (Fig. 9). The mean value of the pixels covered by each ROI is affected, as are the statistical measurements used to compare these 2 methods (Fig. 10). The manual outlining of ROIs is time-consuming and prone to errors, depending on who draws them. Manual delineation of the cerebellum for each AD patient and HC took about 10–15 min, versus 17 s when the automated method was used.
The results obtained using the proposed automated method were outstanding and showed none of the variability observed with the manual method. Furthermore, our automated method was significantly faster, more robust, and less biased than the manual empiric method because studies analyzed with the manual approach were more likely to include vessels in the regions being sampled and one would expect more variability in the dataset. Only a few seconds were required to delineate each reference region excluded from blood vessels, to calculate and plot the time–activity curve, and to generate images containing the outlined ROI, without relying on MRI scans.
Further evidence of the accuracy of this method was provided by fused images, which showed that the outlined area in MVW-PC2 images followed the gray matter of the cerebellar cortex for each AD patient and HC in this study and that the defined region did not contain blood vessels. This finding shows the robustness and precision of the automatic method.
CONCLUSION
The automatic method is helpful in the delineation of the reference region of 11C-PIB PET studies of the human brain and is much faster and more precise than manual delineation.
Acknowledgments
We thank Dr. Lennart Thurfjell for helping with registration of the PET and MRI scans.
Footnotes
-
COPYRIGHT © 2009 by the Society of Nuclear Medicine, Inc.
References
- Received for publication May 14, 2008.
- Accepted for publication January 7, 2009.


