
Main menu

  • Home
  • Content
    • Current
      • JNMT Supplement
    • Ahead of print
    • Past Issues
    • Continuing Education
    • JNMT Podcast
    • SNMMI Annual Meeting Abstracts
  • Subscriptions
    • Subscribers
    • Rates
    • Journal Claims
    • Institutional and Non-member
  • Authors
    • Submit to JNMT
    • Information for Authors
    • Assignment of Copyright
    • AQARA Requirements
  • Info
    • Reviewers
    • Permissions
    • Advertisers
    • Corporate & Special Sales
  • About
    • About Us
    • Editorial Board
    • Contact Information
  • More
    • Alerts
    • Feedback
    • Help
    • SNMMI Journals
  • SNMMI
    • JNMT
    • JNM
    • SNMMI Journals
    • SNMMI

User menu

  • Subscribe
  • My alerts
  • Log in
  • My Cart

Search

  • Advanced search
Journal of Nuclear Medicine Technology
  • SNMMI
    • JNMT
    • JNM
    • SNMMI Journals
    • SNMMI
  • Subscribe
  • My alerts
  • Log in
  • My Cart
Journal of Nuclear Medicine Technology

Advanced Search

  • Home
  • Content
    • Current
    • Ahead of print
    • Past Issues
    • Continuing Education
    • JNMT Podcast
    • SNMMI Annual Meeting Abstracts
  • Subscriptions
    • Subscribers
    • Rates
    • Journal Claims
    • Institutional and Non-member
  • Authors
    • Submit to JNMT
    • Information for Authors
    • Assignment of Copyright
    • AQARA Requirements
  • Info
    • Reviewers
    • Permissions
    • Advertisers
    • Corporate & Special Sales
  • About
    • About Us
    • Editorial Board
    • Contact Information
  • More
    • Alerts
    • Feedback
    • Help
    • SNMMI Journals
  • Watch or Listen to JNMT Podcast
  • Visit SNMMI on Facebook
  • Join SNMMI on LinkedIn
  • Follow SNMMI on Twitter
  • Subscribe to JNMT RSS feeds
OtherIMAGING

Optimized Energy Window Configuration for 201Tl Imaging

Faraz Kalantari, Hossein Rajabi and Nahid Yaghoobi
Journal of Nuclear Medicine Technology March 2008, 36 (1) 36-43; DOI: https://doi.org/10.2967/jnmt.107.043711
Faraz Kalantari
  • Find this author on Google Scholar
  • Find this author on PubMed
  • Search for this author on this site
Hossein Rajabi
  • Find this author on Google Scholar
  • Find this author on PubMed
  • Search for this author on this site
Nahid Yaghoobi
  • Find this author on Google Scholar
  • Find this author on PubMed
  • Search for this author on this site
  • Article
  • Figures & Data
  • Info & Metrics
  • PDF
Loading

Article Figures & Data

Figures

  • Tables
  • FIGURE 1. 
    • Download figure
    • Open in new tab
    • Download powerpoint
    FIGURE 1. 

    Sample images of phantom. (A) One slice of activity distribution in torso phantom. (B) Corresponding attenuation map. (C) 3-Dimensional view of cardiac left ventricle wall. (D) Bull's-eye plot of cardiac left ventricle. Images shown here are very similar to images from real patients.
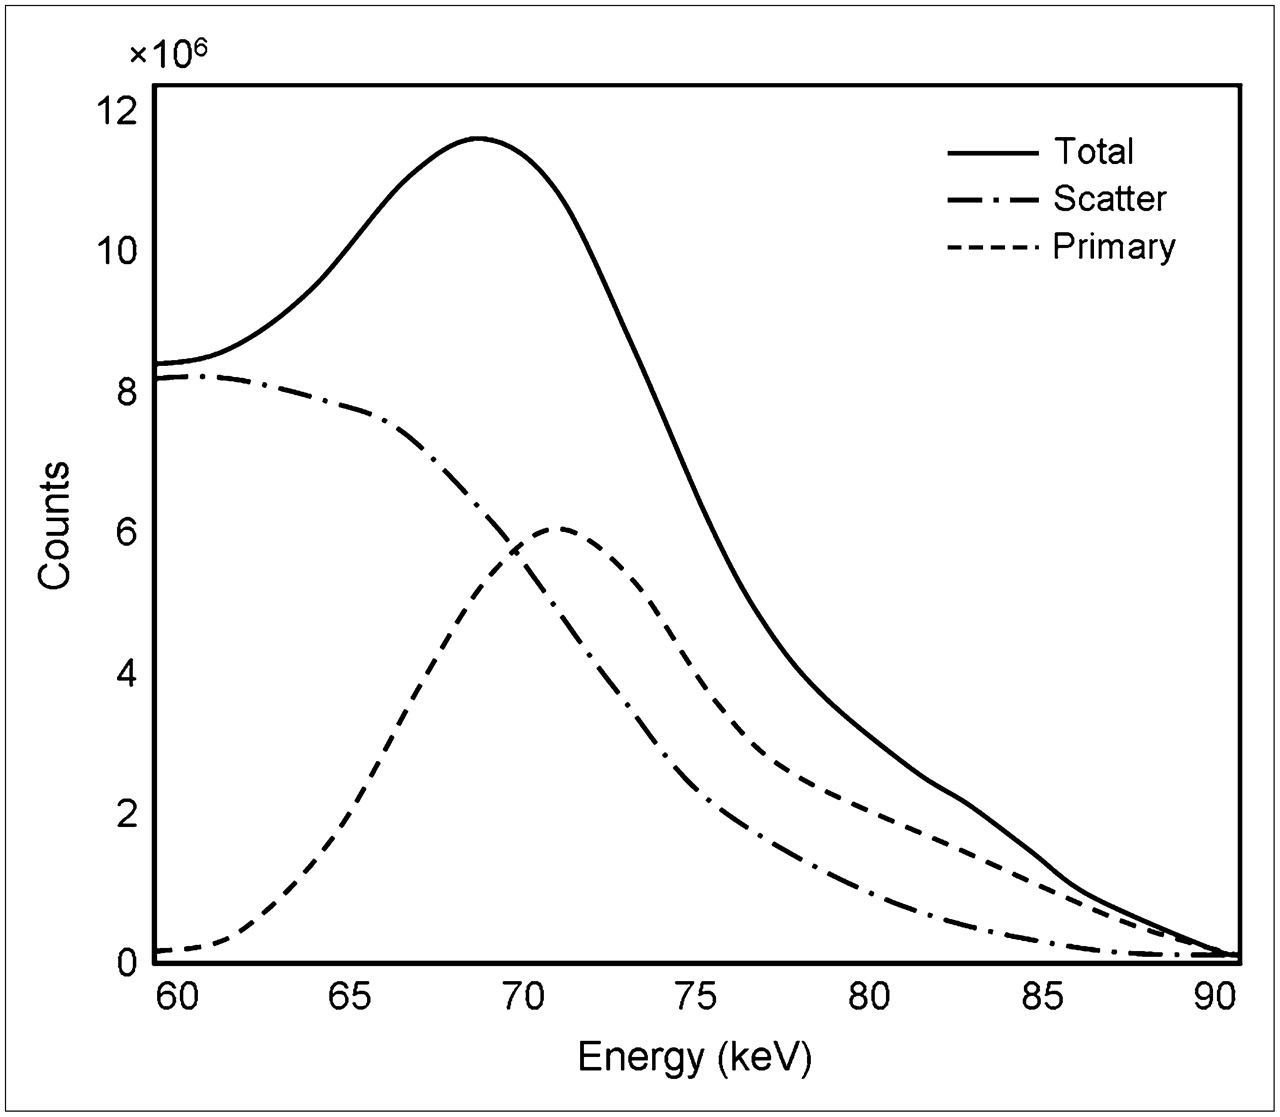
  • FIGURE 2. 
    • Download figure
    • Open in new tab
    • Download powerpoint
    FIGURE 2. 

    Primary, scatter, and total energy spectra of simulated 201Hg x-ray photons. Graphs were generated by calculating total counts in images acquired in 32 windows from 58 keV to 90 keV at 1-keV resolution. Spectra included 167-keV photopeak counts.
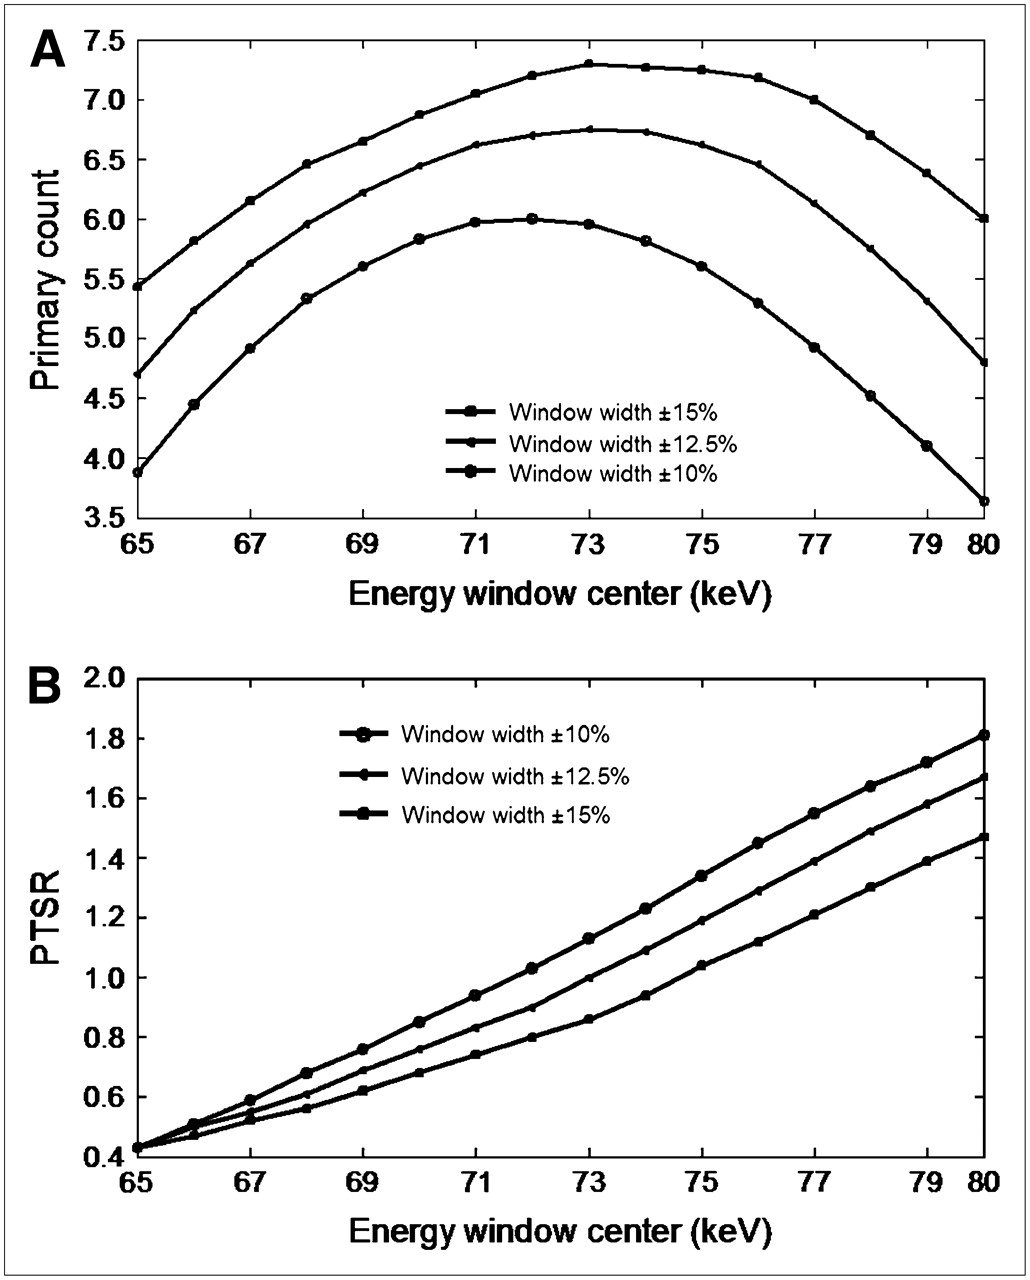
  • FIGURE 3. 
    • Download figure
    • Open in new tab
    • Download powerpoint
    FIGURE 3. 

    Primary counts vs. energy window centers (A) and PTSRs vs. energy window centers (B). Graphs were generated by calculating total counts in images acquired in 48 energy window configurations.
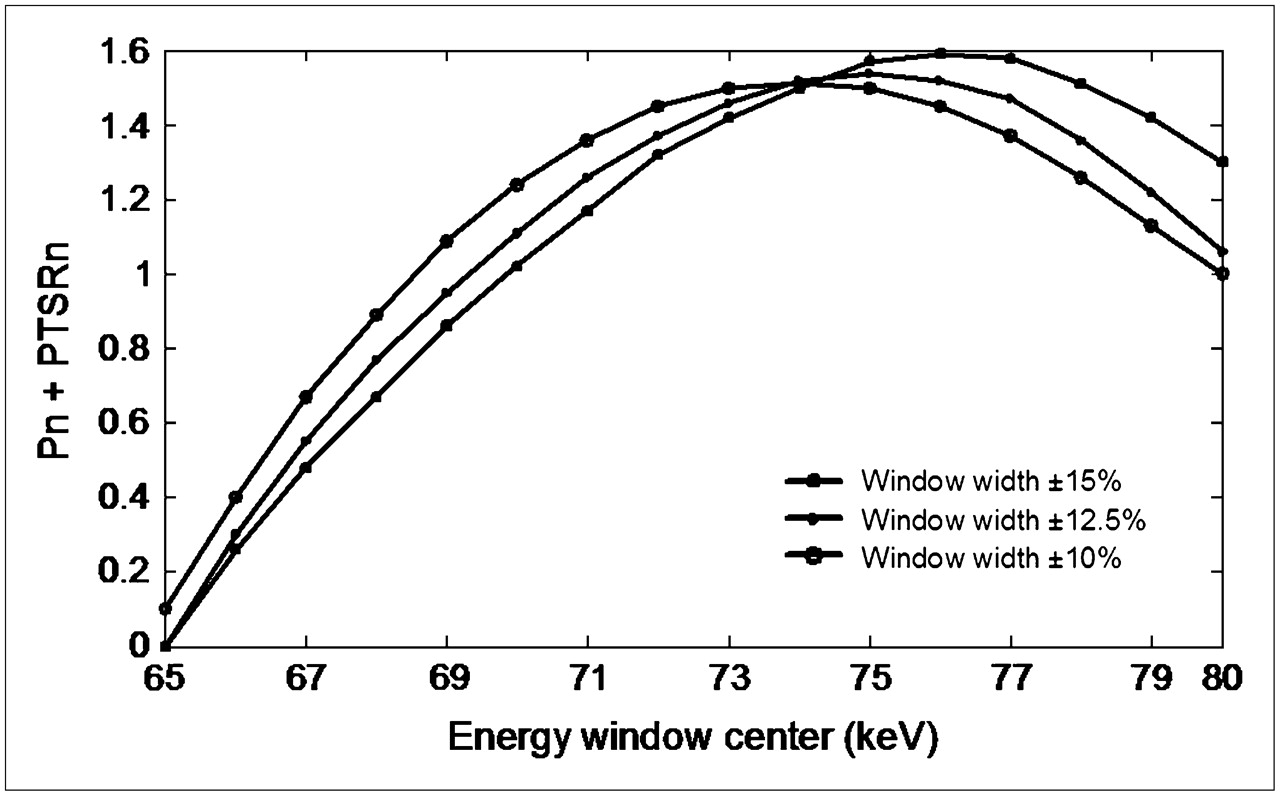
  • FIGURE 4. 
    • Download figure
    • Open in new tab
    • Download powerpoint
    FIGURE 4. 

    Combination of 2 graphs shown in Figure 3 after normalization. This graph simultaneously represents variations in normalized primary counts (Pn) and normalized PTSRs (PTSRn) vs. energy window centers. Maximum point in graph was assumed to represent optimum window configuration.
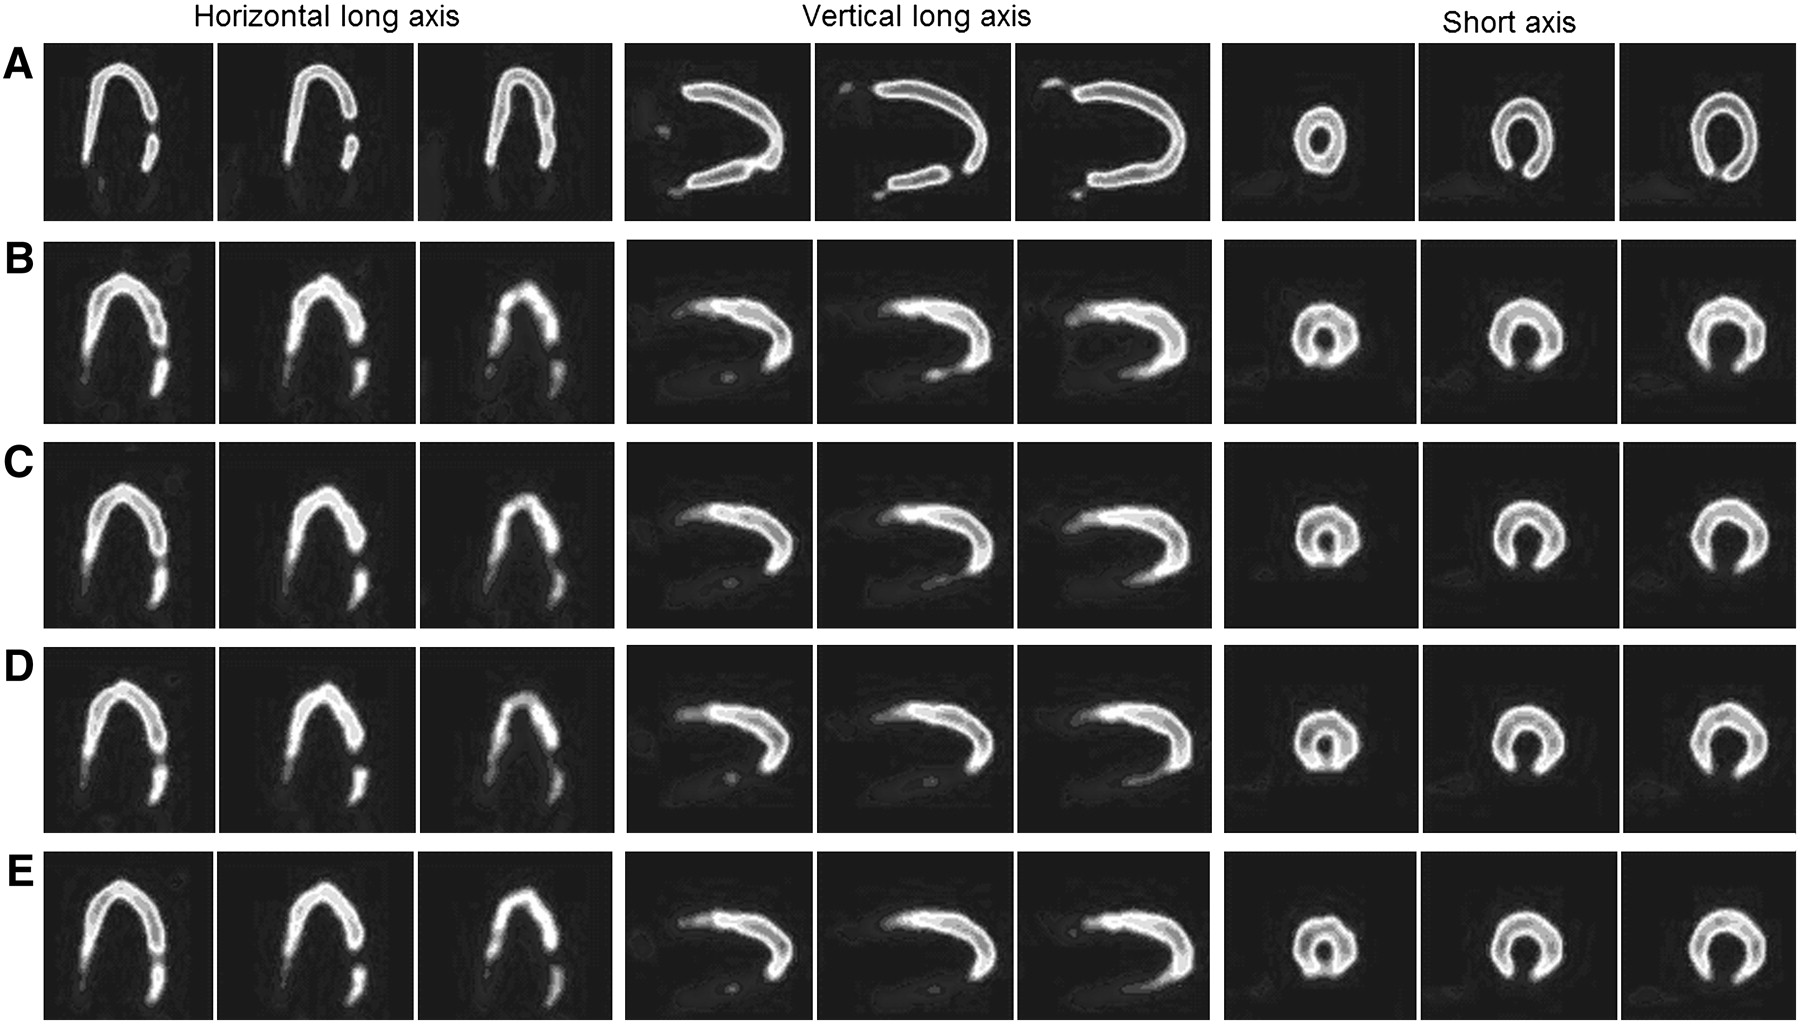
  • FIGURE 5. 
    • Download figure
    • Open in new tab
    • Download powerpoint
    FIGURE 5. 

    From top to bottom, 3 consecutive slices of cardiac region in NCAT phantom that was used as reference in simulation study (A), images acquired in window of 67 ± 10% keV (B), images acquired in window of 73 ± 15% keV (C), images acquired in window of 75 ± 15% keV (D), and images acquired in window of 77 ± 15% keV (E). From left to right, 3 standard views: horizontal long axis, vertical long axis, and short axis.
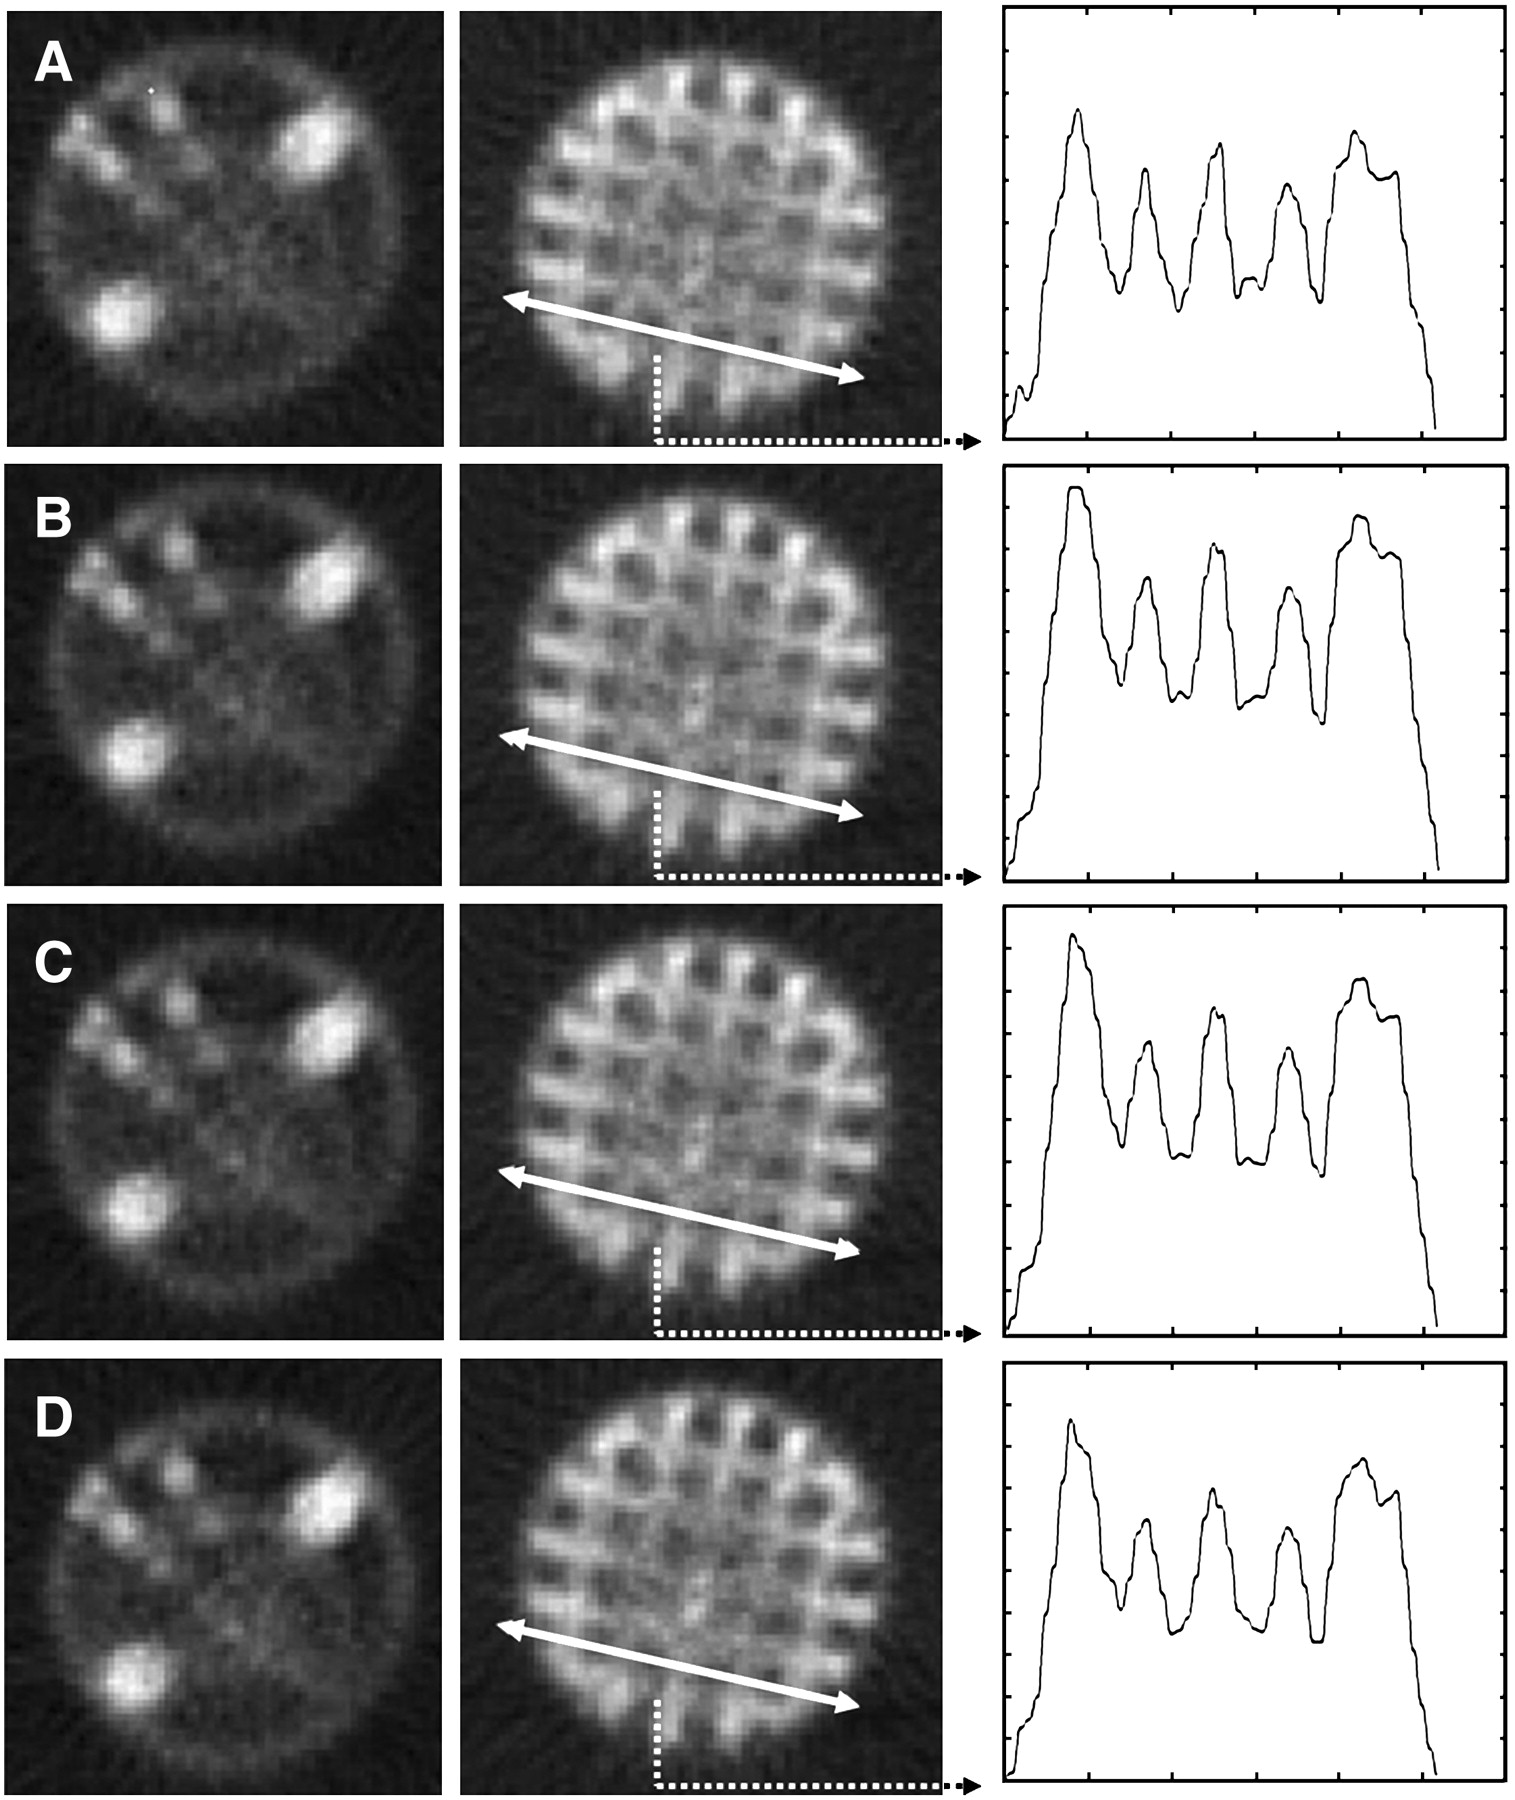
  • FIGURE 6. 
    • Download figure
    • Open in new tab
    • Download powerpoint
    FIGURE 6. 

    Reconstructed Jaszczak phantom images acquired in different energy window configurations: 67 ± 10% keV (A), 73 ± 15% keV (B), 75 ± 15% keV (C), and 77 ± 15% keV (D). Left image was used for visual inspection, and next was used for quantitative evaluation. Identical line profiles were used for calculation of average counts at peaks and valleys to calculate image contrast.
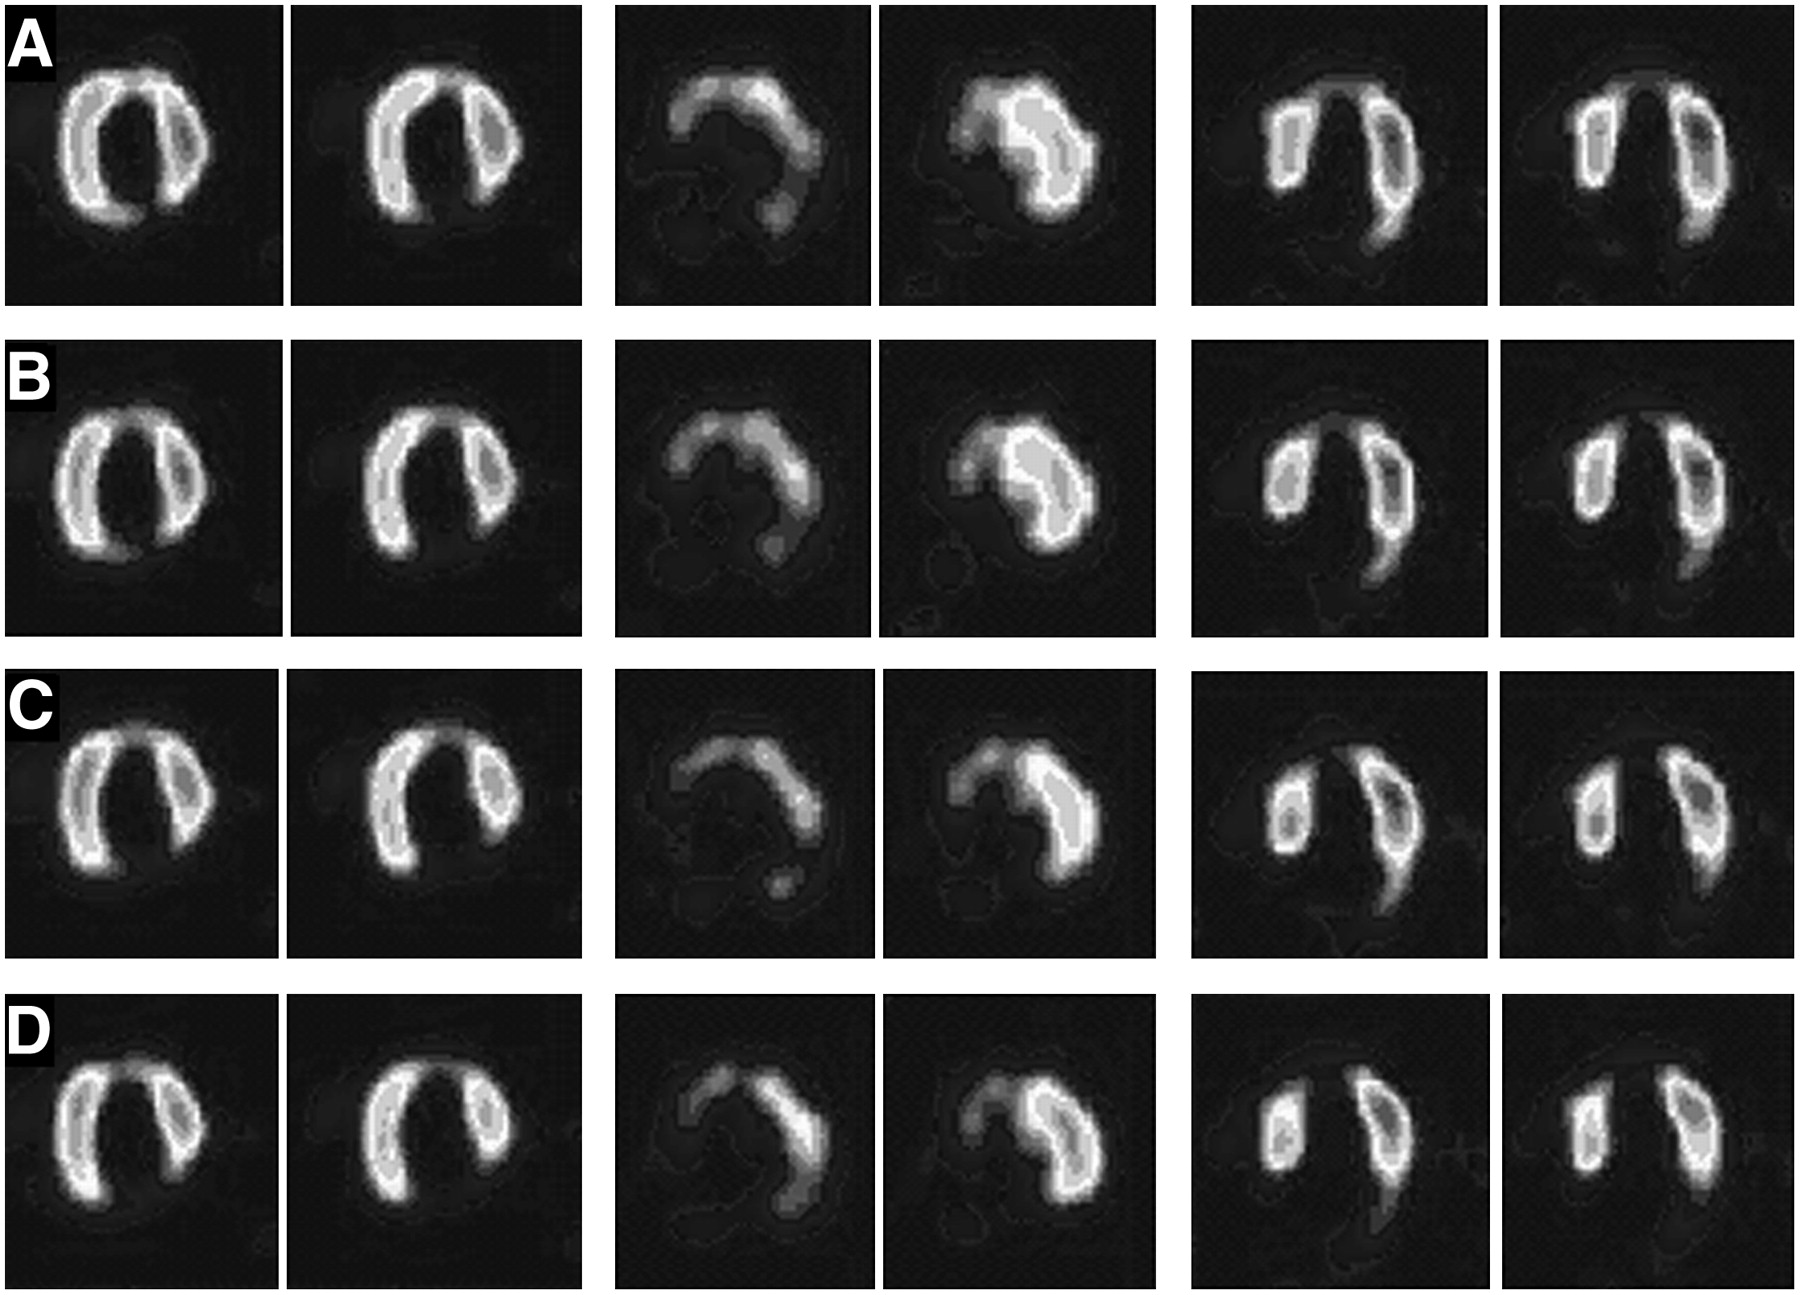
  • FIGURE 7. 
    • Download figure
    • Open in new tab
    • Download powerpoint
    FIGURE 7. 

    Two adjacent slices from patient images acquired in window of 67 ± 20% keV (A), window of 73 ± 15% keV (B), window of 75 ± 15% keV (C), and window of 77 ± 15% keV (D). From left to right, 3 standard views (see legend to Fig. 5).

Tables

  • Figures
    • View popup
    TABLE 1

    Quantitative Parameters Derived from Simulated Images

    Value at the following window center ± width (keV):
    Parameter68 ± 10%73 ± 15%75 ± 15%77 ± 15%Reference
    Relative sensitivity11.181.080.97
    PTSR0.590.881.041.21
    Myocardium-to-cavity contrast0.520.570.620.620.91
    Myocardium-to-defect contrast0.190.190.190.230.35
    • Images were acquired with SimSET SPECT simulator in 4 energy window configurations. Reference values were directly derived from NCAT activity distribution images. Difference between conventional window setting and window setting of 77 ± 15% keV was highly significant (P < 0.01), except for relative sensitivity.

    • View popup
    TABLE 2

    Quantitative Parameters Derived from Jaszczak Phantom Images Acquired in Different Energy Windows

    Value at the following window center ± width (keV)
    Parameter68 ± 10%73 ± 15%75 ± 15%77 ± 15%
    Relative sensitivity11.281.141.05
    Contrast0.420.520.450.45
    Physicians*0112
    • ↵* Number of physicians who accepted corresponding images as best among 4 sets of images.

    • Difference between conventional window setting and window setting of 77 ± 15% keV was highly significant (P < 0.01), except for relative sensitivity.

    • View popup
    TABLE 3

    Averages of Parameters Derived from Clinical Images Acquired in Different Energy Windows

    Value at the following window center ± width (keV)
    Parameter77 ± 15%75 ± 15%73 ± 15%68 ± 10%
    Relative sensitivity1.05 ± 0.021.15 ± 0.021.24 ± 0.021
    Relative myocardium-to-cavity contrast1.17 ± 0.101.12 ± 0.091.07 ± 0.041
    Relative myocardium-to-defect contrast1.54 ± 0.371.33 ± 0.261.28 ± 0.241
    Marks by physicians*2.652.11.00.25
    • ↵* Average of marks (0–3) given by physicians to images in corresponding window settings.

    • Except for relative sensitivity, difference between conventional window setting and window setting of 77 ± 15% keV was highly significant (P < 0.01).

PreviousNext
Back to top

In this issue

Journal of Nuclear Medicine Technology: 36 (1)
Journal of Nuclear Medicine Technology
Vol. 36, Issue 1
March 2008
  • Table of Contents
  • About the Cover
  • Index by author
Print
Download PDF
Article Alerts
Sign In to Email Alerts with your Email Address
Email Article

Thank you for your interest in spreading the word on Journal of Nuclear Medicine Technology.

NOTE: We only request your email address so that the person you are recommending the page to knows that you wanted them to see it, and that it is not junk mail. We do not capture any email address.

Enter multiple addresses on separate lines or separate them with commas.
Optimized Energy Window Configuration for 201Tl Imaging
(Your Name) has sent you a message from Journal of Nuclear Medicine Technology
(Your Name) thought you would like to see the Journal of Nuclear Medicine Technology web site.
Citation Tools
Optimized Energy Window Configuration for 201Tl Imaging
Faraz Kalantari, Hossein Rajabi, Nahid Yaghoobi
Journal of Nuclear Medicine Technology Mar 2008, 36 (1) 36-43; DOI: 10.2967/jnmt.107.043711

Citation Manager Formats

  • BibTeX
  • Bookends
  • EasyBib
  • EndNote (tagged)
  • EndNote 8 (xml)
  • Medlars
  • Mendeley
  • Papers
  • RefWorks Tagged
  • Ref Manager
  • RIS
  • Zotero
Share
Optimized Energy Window Configuration for 201Tl Imaging
Faraz Kalantari, Hossein Rajabi, Nahid Yaghoobi
Journal of Nuclear Medicine Technology Mar 2008, 36 (1) 36-43; DOI: 10.2967/jnmt.107.043711
Twitter logo Facebook logo LinkedIn logo Mendeley logo
  • Tweet Widget
  • Facebook Like
  • Google Plus One
Bookmark this article

Jump to section

  • Article
    • Abstract
    • MATERIALS AND METHODS
    • RESULTS
    • DISCUSSION
    • CONCLUSION
    • Footnotes
    • References
  • Figures & Data
  • Info & Metrics
  • PDF

Related Articles

  • No related articles found.
  • PubMed
  • Google Scholar

Cited By...

  • No citing articles found.
  • Google Scholar

More in this TOC Section

  • Early 10-Minute Postinjection [18F]F-FAPI-42 uEXPLORER Total-Body PET/CT Scanning Protocol for Staging Lung Cancer Using HYPER Iterative Reconstruction
  • Single- Versus Dual-Time-Point Imaging for Transthyretin Cardiac Amyloid Using 99mTc-Pyrophosphate
  • Does Arthrography Improve Accuracy of SPECT/CT for Diagnosis of Aseptic Loosening in Patients with Painful Knee Arthroplasty: A Systematic Review and Metaanalysis
Show more Imaging

Similar Articles

SNMMI

© 2025 SNMMI

Powered by HighWire