


Abstract
A poor signal-to-noise ratio attributable to a low injected dose of thallium and the presence of scattered photons are the major impediments in the use of thallium as an imaging agent. Thallium decays in a complicated way and emits photons in a wide range of energies (68–82 keV). To increase the ratios of primary photons to scatter photons (primary-to-scatter ratios) and possibly increase system sensitivity, a new energy window for thallium was investigated. Methods: The NCAT phantom was used to simulate the distribution of activity and the attenuation coefficient in a typical patient torso. The phantom was imaged with a SPECT simulator in different energy window configurations. The energy spectra for primary photons and scatter photons were generated, and the most suitable energy windows were investigated. To evaluate the results of the simulation study, a physical phantom was imaged in different energy windows with a SPECT system. The images of the physical phantom were analyzed for the best-quality image and the corresponding window setting. To evaluate the windows determined in the simulation and phantom studies, SPECT images of 7 patients who had angiographically confirmed myocardial defects were acquired in different energy windows. The images were quantitatively compared on the basis of the calculated contrast, scatter-to-noise ratio, and sensitivity. The images were also qualitatively evaluated independently by 4 nuclear medicine specialists. Results: The simulation study showed that the conventional window setting (68 ± 10% keV) is not the most suitable window configuration for 201Tl imaging and that the optimum energy window is 77 ± 15% keV. The images acquired in the latter window configuration yielded higher primary-to-scatter ratios, higher sensitivity (total counts), and better contrast than the images acquired in the conventional window configuration. The phantom study confirmed the results of the simulation study. In the clinical study, the images acquired in the suggested window showed a considerable increase in myocardium-to-defect contrast (1.541 ± 0.368) and myocardium-to-cavity contrast (1.171 ± 0.099) than those acquired in the conventional window configuration. Conclusion: The energy window configuration of 77 ± 15% keV yields higher-quality images than the conventional window configuration.
Thallium is a metallic element in group IIIA of the periodic table, having biologic properties similar to those of potassium (1). This property makes 201Tl a suitable radioisotope for myocardium, parathyroid gland, and tumor imaging in nuclear medicine (2–5). Myocardial perfusion imaging is a widely used diagnostic procedure for the detection of cardiac artery disease and myocardial viability assessment (6–10).
201Tl decays by electron capture to 201Hg, emitting several types of γ-rays. The 2 main types of γ-rays are γ-4 of 135 keV (2.5% abundance) and γ-6 of 167 keV (9.5% abundance). The daughter element mercury has a complex spectrum of radiation; however, only x-rays of 68–82 keV (∼93%) are suitable for imaging (11).
There are many different protocols for adjusting the energy windows in 201Tl imaging (12–18), although commonly thallium images are acquired in 2 energy windows (11). The first energy window is set at the x-ray photopeak (68 ± 10% or 68 ± 15% keV), and the second window is set at the γ-6 photopeak (167 ± 20% keV). The images acquired in these 2 windows are simply summed to form images with better statistics.
This type of window setting is questionable because the x-rays emitted from 201Hg are regarded as monoenergetic γ-photons of 68 keV. This presumption is not quite valid because the observed peak is not at the center of the x-ray spectrum. Therefore, substantial amounts of scatter photons are registered in the final images.
Because of the high absorbed dose and long half-time, the amount of 201Tl activity administered to patients is limited, and the acquired images usually have a poor signal-to-noise ratio. In such a situation, an accurate energy window is essential to preserving the quality of the 201Tl images.
The aim of the present study was to investigate the optimum energy center and width for x-rays in 201Tl imaging. This investigation was performed with Monte Carlo simulated images and physical phantom images, and the results were checked against clinical images. A comparison of the images acquired with suggested versus conventional window configurations was also performed.
MATERIALS AND METHODS
Creation of Digital Phantom
The nonuniform rational B-spline–based cardiac–torso (NCAT) digital phantom (19,20) was used to simulate a realistic typical patient's torso. The activity distributions in the organs of the phantom were adjusted on the basis of the 201Tl uptake of the organs in a healthy person (21). Two small defects were fabricated on the lateral and inferoapical regions of the cardiac left ventricle. The attenuation coefficients of the tissues in the torso phantom were adjusted on the basis of the phantom attenuation coefficients of Zubal et al. (22). The activity and attenuation distributions of a coronal slice of the NCAT phantom are shown in Figure 1, which also shows a 3-dimensional view and a bull's-eye plot of the cardiac left ventricle.

Sample images of phantom. (A) One slice of activity distribution in torso phantom. (B) Corresponding attenuation map. (C) 3-Dimensional view of cardiac left ventricle wall. (D) Bull's-eye plot of cardiac left ventricle. Images shown here are very similar to images from real patients.
Imaging of Digital Phantom
A SimSET (simulation system for emission tomography) Monte Carlo simulator (version 2.6.2.6; University of Washington) was used to image the virtual patient (23). The parameters and the dimensions of the simulator were adjusted according to Spirit DH-V (Mediso) SPECT system specifications.
The projection data were collected in a 128 × 128 matrix size with a low-energy, general-purpose (LEGP) collimator. A total of 128 views were acquired over 360° in each simulation.
Processing of Simulated images
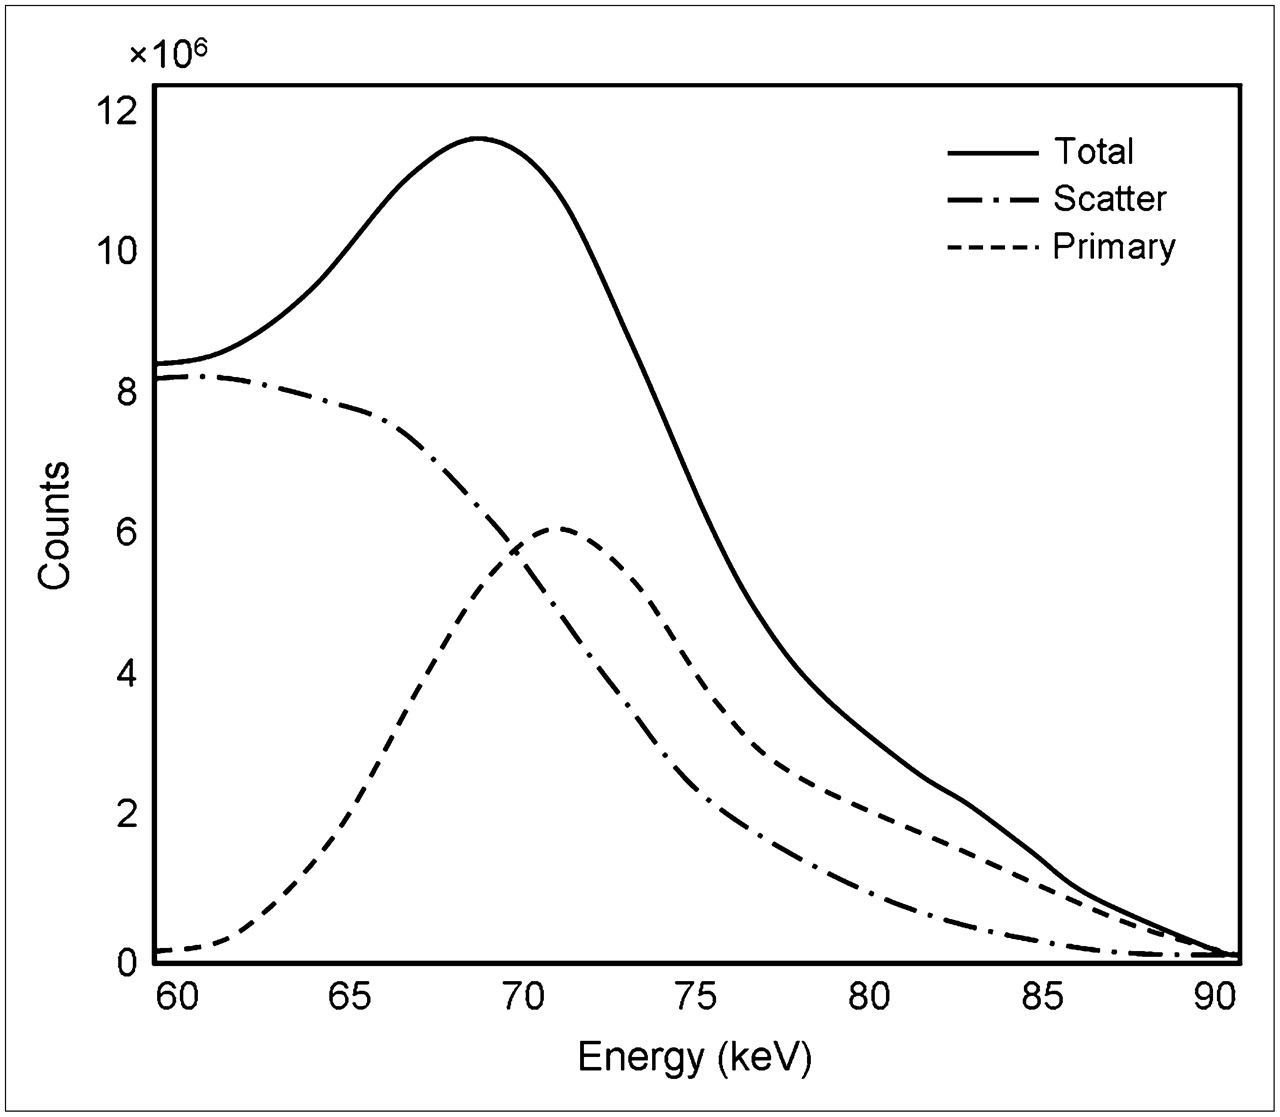
To determine the energy spectrum of the 201Tl x-rays, we performed imaging with 32 energy windows from 58 keV to 90 keV (1-keV window width, 1-keV increment). The energy spectra of the primary photons, scatter photons, and total photons were plotted (Fig. 2).

Primary, scatter, and total energy spectra of simulated 201Hg x-ray photons. Graphs were generated by calculating total counts in images acquired in 32 windows from 58 keV to 90 keV at 1-keV resolution. Spectra included 167-keV photopeak counts.
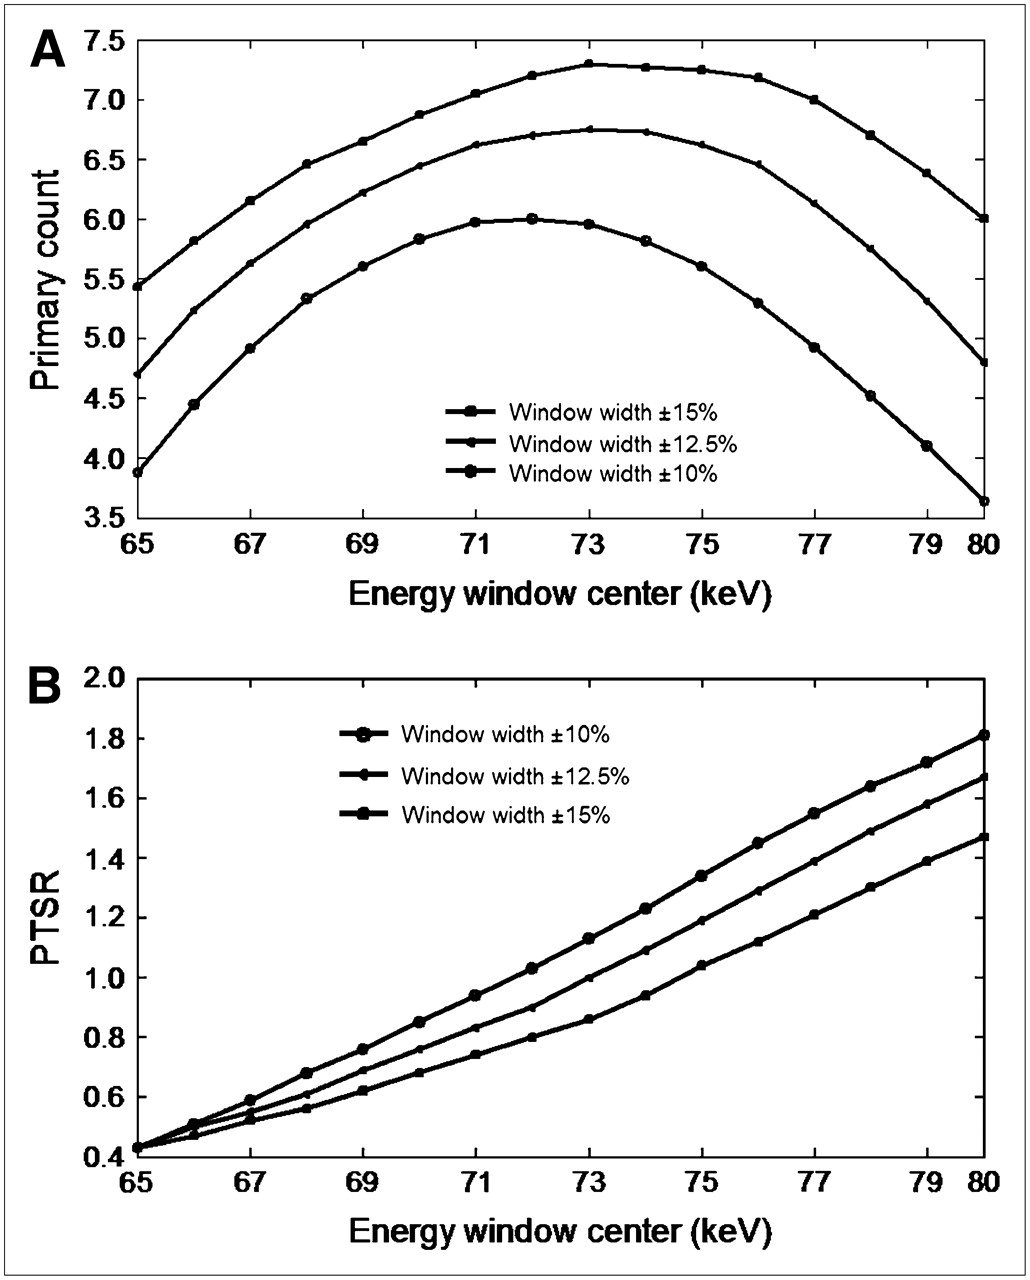
On the basis of the results shown in Figure 2, the imaging window was narrowed to 65–80 keV. To evaluate the different possible window configurations in this range of energy, we performed imaging with 16 different window configurations from 65 keV to 80 keV (1-keV increment) and 3 window widths (±10%, ±12.5%, and ±15%). The primary counts versus the center of the energy window and the ratios of primary photons to scatter photons (PTSRs) versus the center of the energy window were plotted for different window widths (Fig. 3).

Primary counts vs. energy window centers (A) and PTSRs vs. energy window centers (B). Graphs were generated by calculating total counts in images acquired in 48 energy window configurations.
To determine the most suitable energy window, we determined the window configuration in which the primary counts and the PTSRs were simultaneously maximized. To find the optimum point, we first normalized the measures of the primary counts and PTSRs to between zero and one. The corresponding normalized values of the primary counts and PTSRs were summed to provide the index of selection. The maximum value of the index was assumed to be the desired point, and the corresponding energy window configuration was determined (Fig. 4).
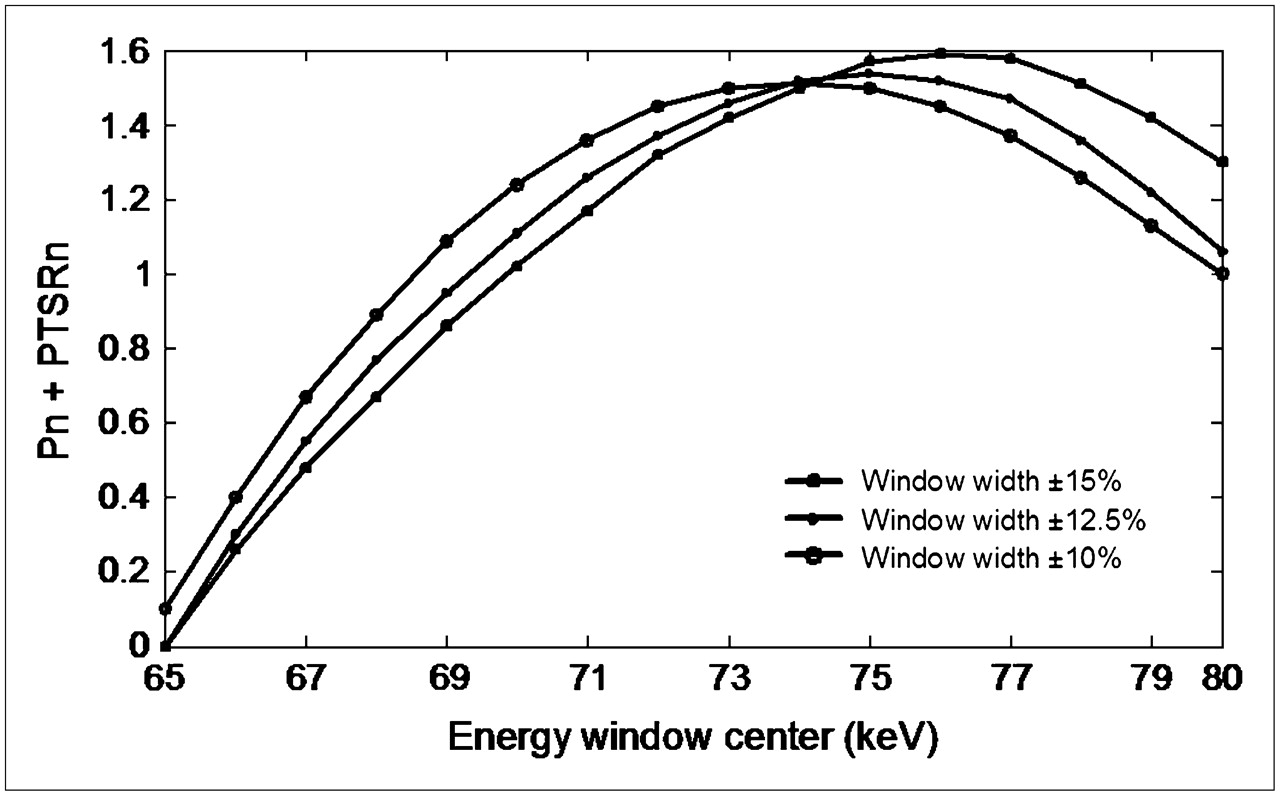
Combination of 2 graphs shown in Figure 3 after normalization. This graph simultaneously represents variations in normalized primary counts (Pn) and normalized PTSRs (PTSRn) vs. energy window centers. Maximum point in graph was assumed to represent optimum window configuration.
On the basis of the results of this simulation study, window configurations of 75 ± 15% keV and 77 ± 15% keV were determined as the potential optimum configurations.
The images acquired in these windows, those acquired in the window of 73 ± 15% keV (yielding the highest primary counts), and those acquired in the conventional on-peak window (67 ± 10% keV) were transformed to an interfile format and processed by use of the InterViewXP software package (Mediso). The images were reconstructed by use of filtered backprojection with the default processing protocols of the system. The total counts, the PTSRs, the myocardium-to-wall defect contrast, and the myocardium-to-cavity contrast were calculated as quantitative parameters for the comparisons.
Contrast was calculated as follows: contrast = (A − B)/(A + B), where A and B represent the average count in the myocardial wall and the average count in the defect area (or ventricle cavity), respectively. The relative uptake of the myocardium was calculated by use of the bull's-eye images.
Physical Phantom Study
A Jaszczak phantom (Data Spectrum) uniformly filled with approximately 100 MBq of a 201Tl aqueous solution was used as the imaging object. A dual-head SPECT system (Spirit DH-V) equipped with an LEGP collimator was used for simultaneous acquisition of the projection data in the 4 energy window configurations (all including the 167-keV photopeak). A total of 128 views in a 128 × 128 matrix size were acquired over 360° of rotation. The SPECT data were reconstructed by use of filtered backprojection as described earlier. To reduce the random fluctuation attributable to noise, data for 4 similar consecutive slices were summed.
Identical line profiles were plotted over the images, and corresponding line profile counts were generated. The average of the peaks (maximum values) and the average of the valleys (minimum values) were determined for calculation of the image contrast.
Clinical Study
Seven patients (5 men and 2 women) who were referred for myocardial perfusion SPECT and who had a known defect, as diagnosed by angiographic data, were selected. Imaging was performed in accordance with a routine protocol; however, 3 extra images were acquired simultaneously in the energy windows of 73 ± 15% keV, 75 ± 15% keV, and 77 ± 15% keV. Projection data were collected in a 64 × 64 matrix size by use of a dual-head SPECT system (Spirit DH-V) equipped with an LEGP collimator. A total of 32 views of 60 s were acquired over 180° from left posterior oblique to right anterior oblique. The images were reconstructed as described earlier. The total counts in the projection data, the myocardium-to-defect contrast, and the myocardium-to-cavity contrast in short-axis and horizontal long-axis slices were calculated.
Four nuclear medicine physicians independently evaluated the images and selected the image that was most consistent with the results of the angiography.
RESULTS
Simulation Study
The energy spectra of the primary, the scattered, and the total photons in the range of 58–90 keV are plotted in Figure 2. Considering the relative abundance of the 201Tl x-ray photons, it is clear that the photons having energies of less than 68 keV (the crossing point of the primary and the scatter spectra) were most likely to be scattered photons rather than primary photons. The majority of the photons below 68 keV originated from the higher-energy photons that lost energy because of Compton scattering in the patient's body or the collimator. This finding indicates that the conventional energy window setting (67 ± 10% keV) is not the most suitable configuration for 201Tl imaging and that the center of the energy window should be set at a higher energy.
The total primary counts and the PTSRs versus the window centers (65–80 keV) for the 3 window widths (±10%, ±12.5%, and ±15%) are plotted individually in Figure 3. To determine the point at which both the primary counts and the PTSRs were optimized, we combined the corresponding curves.
To combine the curves, we normalized the measures of the primary counts and the PTSRs to 0–1 and then summed the corresponding normalized curves. The new measure was considered to be the parameter that simultaneously involved the primary counts and the PTSRs. Variations in this new parameter versus the energy window centers are shown in Figure 4. The curve representing the window width of ±15% had a plateau peak in the range of 75–77 keV. Therefore, the center of the optimum energy window was assumed to be in this range, and the window width was assumed to be ±15%.
Another candidate considered as a potentially suitable window configuration for 201Tl imaging was 73 ± 15% keV. On the basis of the results of the simulation study, this window corresponded to the maximum primary counts irrespective of the scatter photons (Fig. 3).
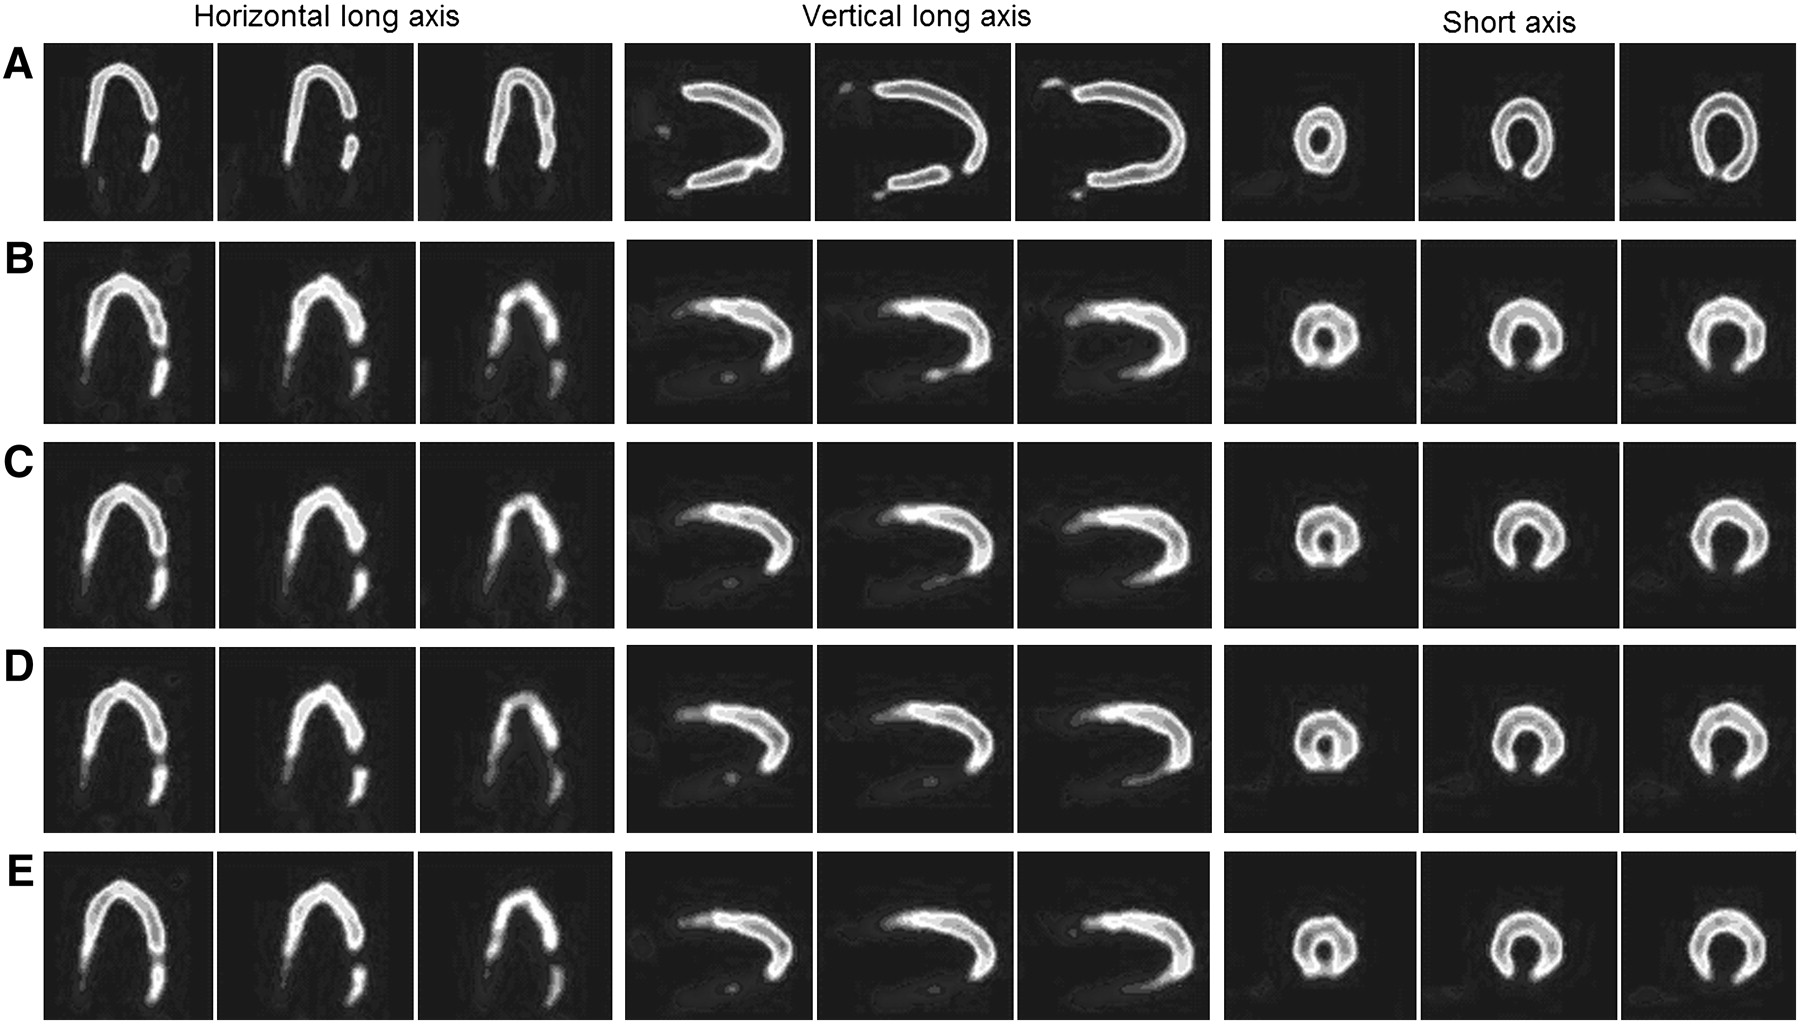
To determine the best of the 4 windows investigated, we compared the images acquired in these windows. The reference image in this comparison was that of the NCAT activity distribution. It was converted to planar images (similar to raw SPECT data) by use of software developed within MATLAB, version 7.0.4 (MathWorks). All of the images were transformed into an interfile format, transferred to the SPECT system, and reconstructed under the same conditions as those described earlier. The slice that included the defect and 2 adjacent slices are shown in Figure 5.

From top to bottom, 3 consecutive slices of cardiac region in NCAT phantom that was used as reference in simulation study (A), images acquired in window of 67 ± 10% keV (B), images acquired in window of 73 ± 15% keV (C), images acquired in window of 75 ± 15% keV (D), and images acquired in window of 77 ± 15% keV (E). From left to right, 3 standard views: horizontal long axis, vertical long axis, and short axis.
The total counts, the PTSRs, the myocardium-to-defect contrast, and the myocardium-to-cavity contrast were calculated as quantitative parameters. The myocardium-to-defect contrast was calculated by use of the counts in the ROIs drawn over the normal myocardial wall and the defect area. The average of the calculated parameters for each image is shown in Table 1.
Quantitative Parameters Derived from Simulated Images
On the basis of the results shown in Table 1, all of the investigated window configurations yielded higher PTSRs and better contrast than the conventional window configuration. Except for the window of 77 ± 15% keV, which showed a negligible reduction in sensitivity (3% fewer counts), other windows showed better sensitivity than the conventional window.
On average, the window configuration of 77 ± 15% keV yielded better results but at the cost of a negligible reduction in sensitivity. The images acquired in this window showed the most similarity to the reference images in terms of the universal image quality index (24).
Phantom Study
Two slices of the Jaszczak phantom acquired in different energy windows are shown in Figure 6. The total counts in the raw projection data and the average contrast calculated from the images acquired in different energy window configurations are shown in Table 2. It is clear that the images acquired in the window of 77 ± 15% keV had the highest contrast, in agreement with the results of the simulation study. The total counts (sensitivity) in this window configuration were 5% higher than those in the conventional window configuration, whereas in the simulation study, they were 3% lower.

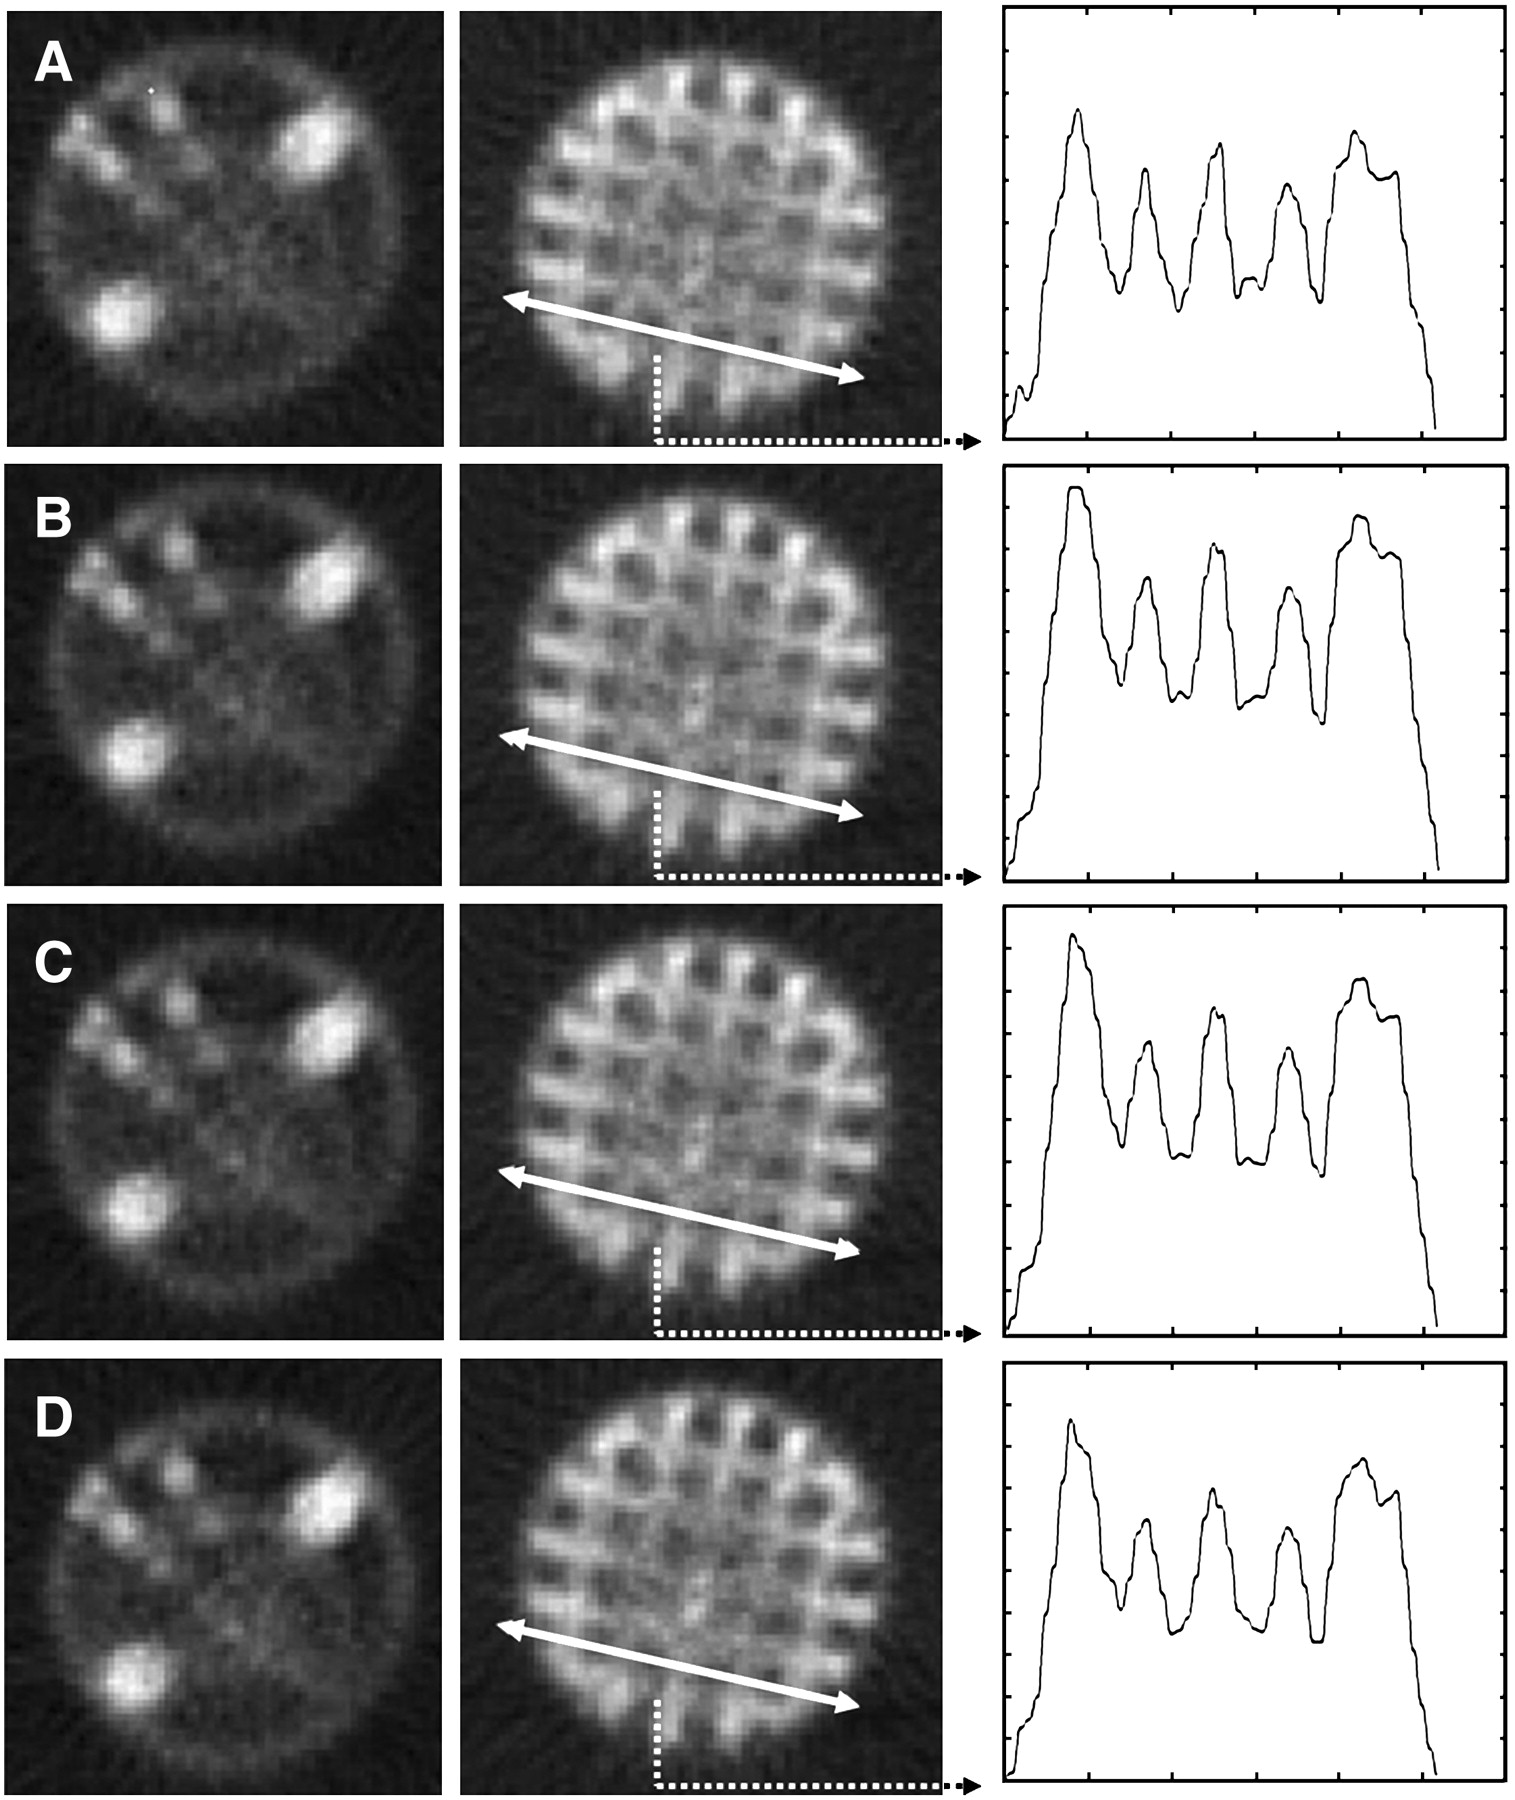
Reconstructed Jaszczak phantom images acquired in different energy window configurations: 67 ± 10% keV (A), 73 ± 15% keV (B), 75 ± 15% keV (C), and 77 ± 15% keV (D). Left image was used for visual inspection, and next was used for quantitative evaluation. Identical line profiles were used for calculation of average counts at peaks and valleys to calculate image contrast.
Quantitative Parameters Derived from Jaszczak Phantom Images Acquired in Different Energy Windows
Four nuclear medicine physicists evaluated the images and selected the one with superior quality. Two physicists selected the images acquired in the window configuration of 77 ± 15% keV. One physicist selected the image acquired in the window configuration of 73 ± 15% keV, and the other selected the image acquired in the window configuration of 75 ± 15% keV. None of the physicists selected the image acquired in the conventional window configuration.
Clinical Study
Two adjacent slices acquired in different energy windows for one of the patients are shown in Figure 7 (3 standard views). The averages of the total counts (sensitivity) and the contrast calculated from the images of the patients are shown in Table 3.

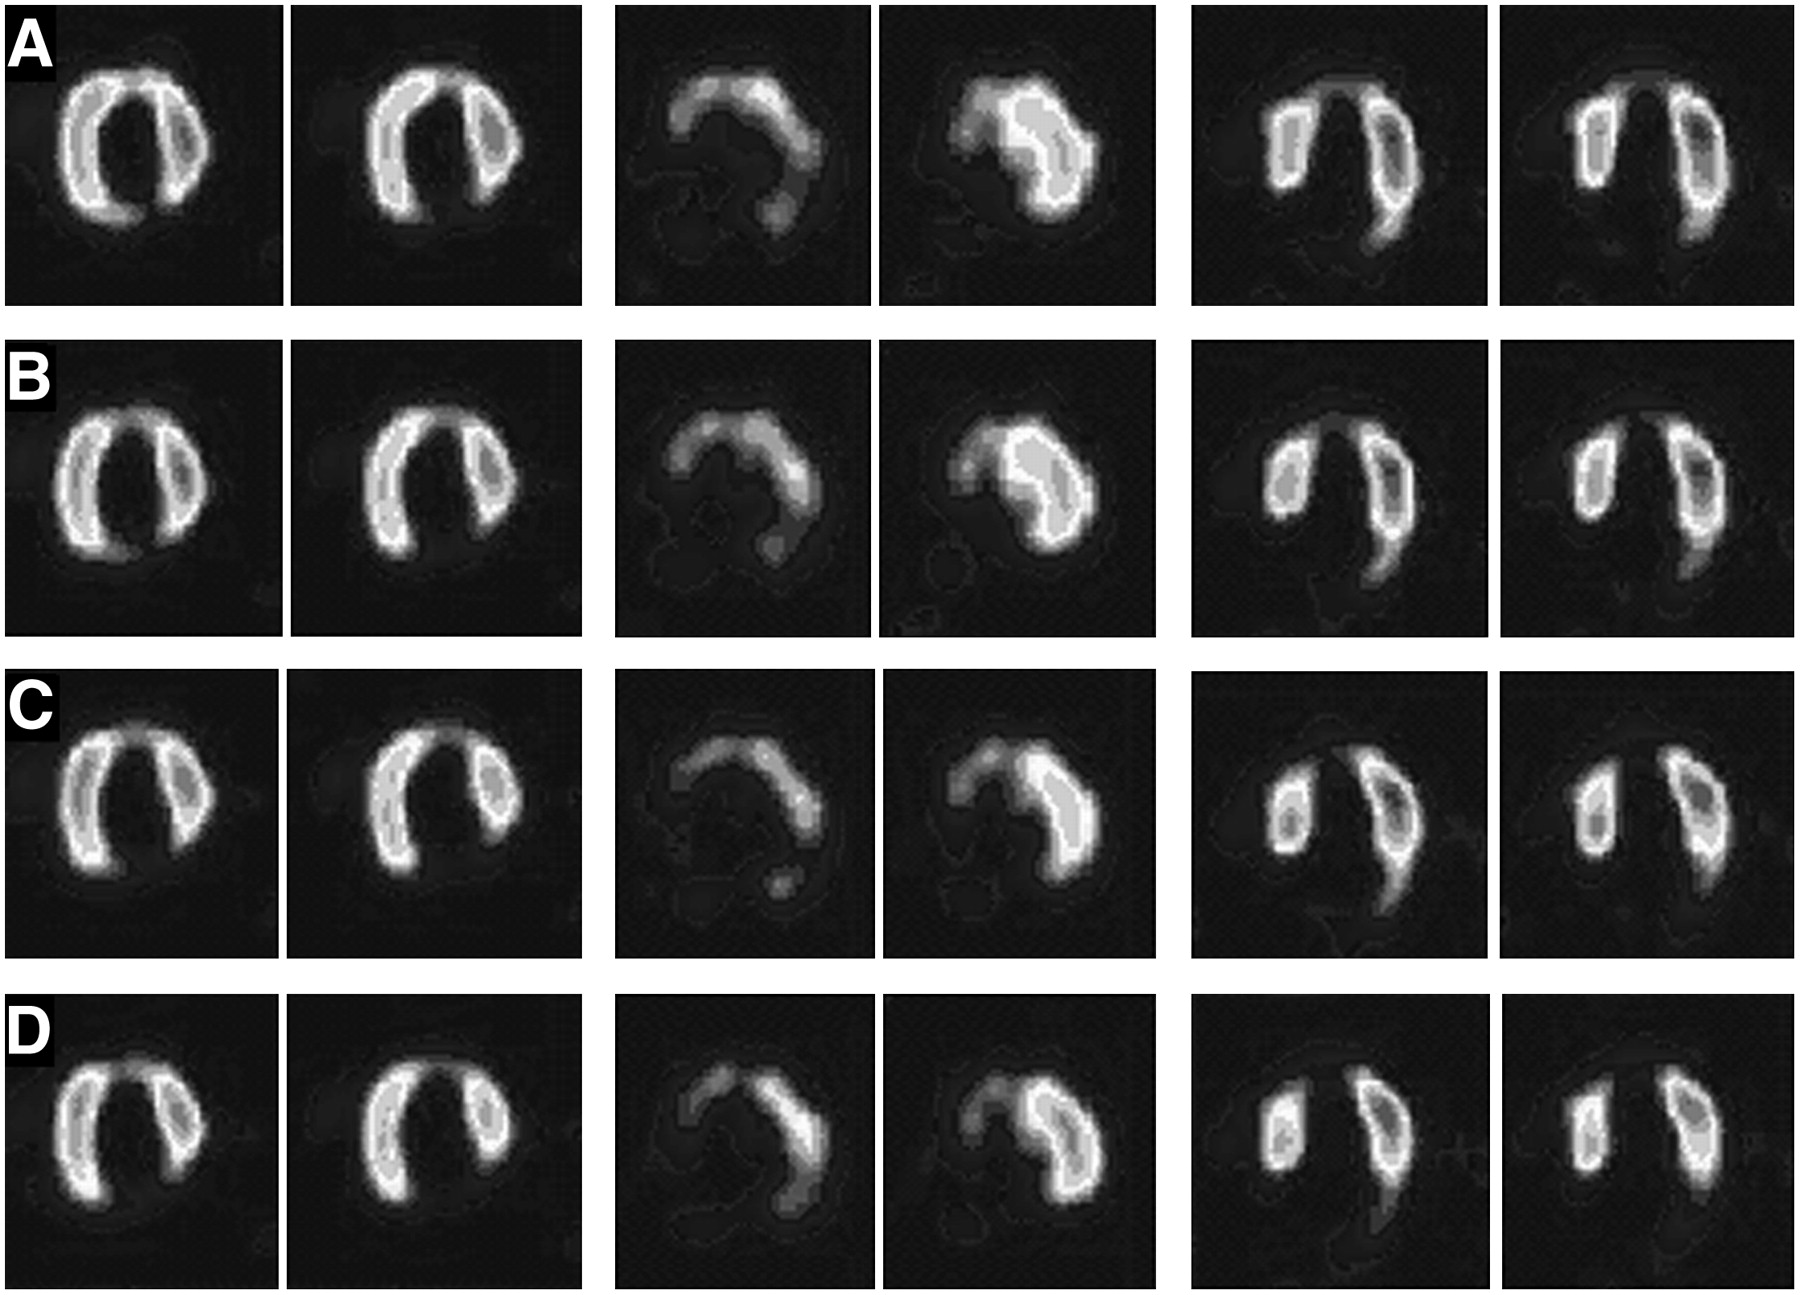
Two adjacent slices from patient images acquired in window of 67 ± 20% keV (A), window of 73 ± 15% keV (B), window of 75 ± 15% keV (C), and window of 77 ± 15% keV (D). From left to right, 3 standard views (see legend to Fig. 5).
Averages of Parameters Derived from Clinical Images Acquired in Different Energy Windows
Four nuclear medicine physicians evaluated the patients' images acquired in different energy window configurations and assigned a score (0–3) to each image, depending on how much it confirmed the results of angiography. The average scores are shown in Table 3.
Considering all of the factors, the conventional window configuration of 67 ± 10% keV was the worst of the windows evaluated, both quantitatively and qualitatively. However, in the energy window of 77 ± 15% keV, considerable increases in the myocardium-to-defect contrast (1.541 ± 0.368) and the myocardium-to-cavity contrast (1.171 ± 0.099) were observed. A negligible increase in the total counts in the images acquired in this window configuration was also observed. The clinical study also confirmed that the window of 77 ± 15% keV is the suitable configuration for 201Tl heart imaging.
DISCUSSION
Scattered photons are among the main causes of contrast- and resolution-degrading factors in SPECT (25). The primary method for dealing with scattered photons is the use of a pulse-height analyzer, which rejects scattered photons on the basis of their energy (26). Therefore, the correct energy window setting is an important issue in nuclear medicine data acquisition (27). An accurate energy window setting is more important for 201Tl imaging than for imaging with the other radiopharmaceuticals used in nuclear medicine. The photons emitted during 201Tl disintegration are mostly x-rays having a relatively broad energy spectrum. Moreover, the administration of a low dose of 201Tl results in low counting rates and poor statistics compared with those of the other radioisotopes used in nuclear medicine (14).
Conventionally, the center of the energy window for 201Tl imaging is set over the peak of the x-ray spectrum, which is usually at about 68 keV (5–18). The width of the window is usually set to ±10% or ±15%. In other words, the x-rays of 201Tl are implicitly considered to be monoenergetic γ-rays of 68 keV. From the physical point of view, this presumption is not quite valid because of the complex combination of primary and scattered photons in the x-ray spectrum (28).
The aim of the present study was to investigate the optimum energy window configuration for 201Tl imaging. We tried to find the window configuration in which the PTSR would be maximized at the same time that sensitivity was preserved. This investigation was performed in 3 stages: Monte Carlo simulation, Jaszczak phantom study, and clinical study. A similar investigation was previously performed (28); however, the phantom used in that study was a point source of activity in a cylinder filled with water as attenuation material.
Because 201Tl is mainly used for heart imaging, in the present study we simulated the process by using the latest version of the SimSET Monte Carlo simulator (version 2.6.2.6) as a virtual SPECT system (23) and the NCAT phantom to model the torso and its organs with a realistic activity distribution and a realistic attenuation map (19,20). The number and distribution of the primary and scattered photons in the simulation study were similar to those in a typical clinical study (21). Moreover, the results of the present study were also evaluated with data from some real patients.
It was shown that the conventional symmetric energy window (68 ± 10% keV) was a less optimal choice for 201Tl imaging and that the optimum energy window must be one of the following configurations: 73 ± 15% keV, 75 ± 15% keV, and 77 ± 15% keV.
In the simulation study, the downscatter of the 135- and 167-keV γ-photons into the 201Tl x-ray spectrum (68–82 keV) was ignored. The lead x-ray produced in the collimator because of the collision of higher-energy γ-rays was also ignored. Because of the relatively small abundance of high-energy photons (2.5% and 9.5%), considerable error in the results of the simulation did not occur. Moreover, the large change in energy corresponded to a large deflection angle or multiple scattering and therefore even less relative abundance.
The small difference observed between relative counts recorded in the proposed and the conventional window configurations in the simulation study and the physical phantom study was partially due to ignoring the high-energy γ-rays.
In all 3 steps of this investigation, the conventional symmetric energy window (68 ± 10% keV) was found to be a less optimal choice, whereas the window of 77 ± 15% keV was proven to be the best choice.
CONCLUSION
We described a method of generating realistic simulated images with the NCAT digital torso phantom and the SimSET SPECT Monte Carlo simulator. Images were acquired in different energy window configurations. Evaluation of the acquired images showed that the conventional symmetric energy window configuration (68 ± 10% keV) was not a suitable configuration for 201Tl cardiac imaging. Further analysis showed that the asymmetric window configuration of 77 ± 15% keV yielded images of superior quality compared with the conventional window configuration.
Footnotes
-
COPYRIGHT © 2008 by the Society of Nuclear Medicine, Inc.
References
- Received for publication May 19, 2007.
- Accepted for publication September 2, 2007.


Jump to section
Related Articles
Cited By...
- No citing articles found.