


Abstract
Collimators are used for the improvement of information about the positions of sources by limiting the incidence direction of γ-rays and characteristic x-rays to detectors. In this study, we attempted to improve the spatial resolution of 201Tl myocardial SPECT by using simultaneous 3-dimensional distance-dependent resolution correction (DRC) incorporated into the ordered-subsets expectation maximization algorithm. Methods: Simulation was performed with various sizes of balls, and measurement with a line-source phantom was performed at different source–detector distances. Imaging of a hot-rod phantom, the defect area of a myocardial phantom, and the myocardial thickness and cardiac lumen in a human study by 201TlCl myocardial SPECT was evaluated before and after DRC. Results: We performed simulation by using 5 sizes of balls and found marked improvement in resolution in all x-, y-, and z-axis directions. In the line-source phantom, when the radial distance was very long (30.5 cm), the correction effects were slightly low. However, when the distance was similar to the clinically used rotation radius (22.5 cm), the correction effects were good in the hot-rod and myocardial phantoms and in the human study. Conclusion: DRC markedly improved the spatial resolution of SPECT images, suggesting that this method is useful for the quantification of infarcted areas by myocardial SPECT.
- 3-dimensional distance-dependent resolution correction
- ordered-subsets expectation maximization algorithm
- transmission CT
Isotopes used for myocardial SPECT are affected by attenuation and scatter because their photon energy is relatively low. Collimators used for SPECT imaging are designed to maintain resolution with increasing distance from the collimator surface and to eliminate photons that do not approach the collimator surface in an orthogonal, perpendicular direction. Even so, scatter from the patient that is orthogonal to the collimator surface and a loss of resolution with distance are still detected because more holes are exposed to the radiation as the distance from the collimator surface increases.
Methods for correction of the 3-dimensional resolution of SPECT images have been reported (1–10), but only a few methods have been used clinically. Moreover, Maniawski et al. (2) demonstrated that varying the distance from the source of the activity to the detector produced significant artifacts on 201TlCl cardiac SPECT images because of varying spatial resolution. In this study, we attempted to improve quantification by 201TlCl myocardial SPECT by using transmission CT (TCT) with a 99mTc external source for attenuation correction (AC) (11,12), the triple-energy window (TEW) method for scatter correction (SC) (13), and incorporation of 3-dimensional distance-dependent resolution correction (DRC) (10) of each slice into the ordered-subsets expectation maximization (OSEM) algorithm (14).
MATERIALS AND METHODS
Theory
The OSEM algorithm is an iterative image reconstruction method that has been developed for speeding up the convergence of the maximum-likelihood expectation (15). The equation used for resolution correction in this study is as follows: Eq. 1Here,
  denotes the reconstruction value of pixel j by the kth approximation, yi denotes the projection data obtained by measurement on detector coordinate i, Cij denotes the probability of the incidence of photons generated from pixel j into detector i, and k denotes the number of iterations. Photons generated from pixels are considered to enter the detector according to the point-spread function (PSF), which depends on the source–detector distance, and the spread of photons can be determined with the PSF obtained by imaging of the point source (9,10). This function should be interpreted as being the response of the whole detector system, including the collimator.
To introduce this function into Equation 1, the following 3 hypotheses were considered: The distribution of blur by the detector can be approximated with the gaussian function, the relationship between the full width at half maximum (FWHM) of the PSF and the source–detector distance is given by a linear approximation, and the distance from the PSF to the x-axis is the same as that to the y-axis. With the collimator used in this experiment, the relationship between the FWHM of the PSF and the source–detector distance used Maeda et al. (10). The relationship between the FWHM and the rotation radius is given by the following equation: Eq. 2An a value of 0.0053772 cm and a b value of 0.37 cm were used in Equation 2 for a low-energy, high-resolution collimator.
The initial value for λj in Equation 1 was assumed to be unity, and resolution correction was incorporated into the equation. Because photon radiation enters the detector according to the PSF, which depends on the source–detector distance, it is regarded as bk and approximated from the gaussian function by which Cij is multiplied. bkij expresses the center of blur distribution. According to the gaussian function, the positions of γ-ray generation at distances to pixels x and y are regarded as rx and ry, respectively. The gaussian function is given by the following equation: Eq. 3where σ denotes the SD (range of blurring), μ denotes the mean, and x denotes a variable. The percentage of photon radiation emitted from a point that enters the detector can be calculated by determining the distance between the point (μ) on the detector at which photon radiation enters vertically and an arbitrary point (x) on the detector. The SD σ is given, by use of the FWHM determined from the PSF, by the following equation:
 Eq. 4Because the FWHM that depends on the source–detector distance (d) is used, the gaussian function that depends on the distance from the detector is obtained.
The TCT system used was GCA-9300A/UI (Toshiba Medical Systems). The focal length, radial distance, and field of view of the cardiac fanbeam collimator were 80.2, 22.5, and 24.1 cm, respectively. The radial distance and field of view of the parallel-beam collimator were the same as those of the fanbeam collimator. The TCT data were acquired with an external 99mTc γ-ray source, which was a sheet made from bellow tubes filled with 740 MBq of 99mTc. Each tube had an inner diameter of 0.1 cm and was made of fluorocarbon resin embedded in an acrylic rectangular board measuring 25.0 × 10.0 cm (12). The SPECT data were acquired with 201TlCl. Therefore, for AC, it was necessary to convert the attenuation coefficient for 99mTc to that for 201Tl. Because the attenuation coefficients for water at 201Tl (74 keV) and 99mTc (140 keV) energies are 0.184 and 0.153 cm−1, respectively, and the ratio between them is approximately 1.2, the AC for 201Tl was estimated from that for 99mTc by multiplying it by 1.2.
SC was performed with the TEW method (13). The acquisition window widths were set at 47% for the main window and 7% for the subwindow at 74 keV for 201Tl and at 20% for the main window and 7% for the subwindow at 140 keV for 99mTc (12,16).
The images obtained from the phantom and human studies were evaluated before and after DRC.
Simulation
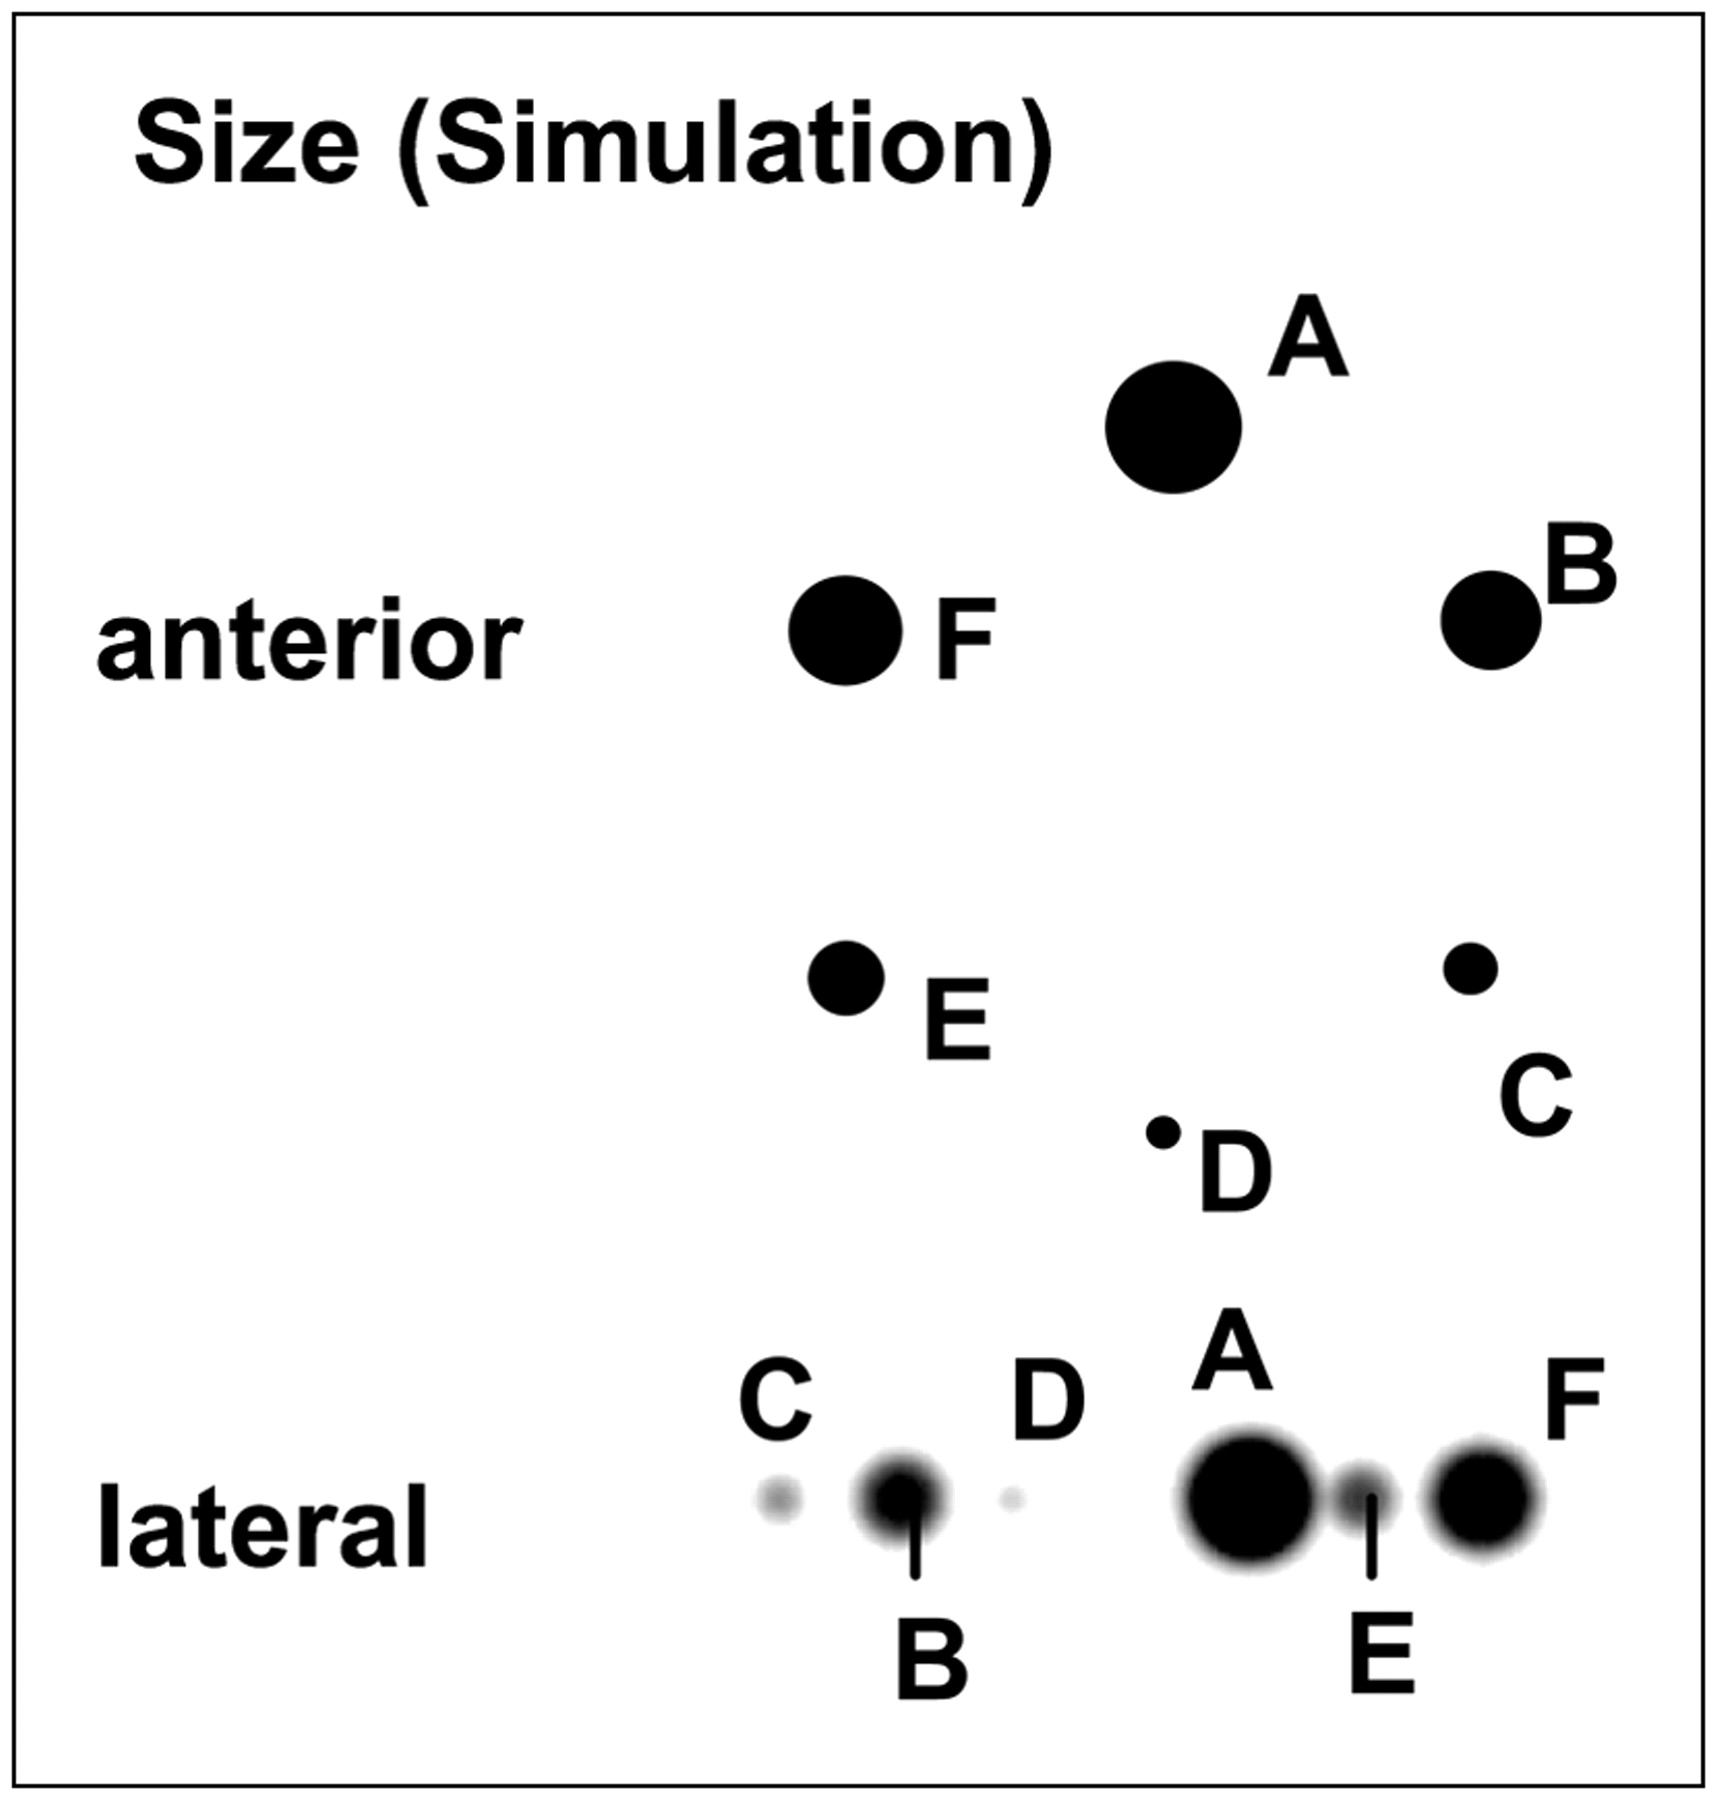
Projections were simulated by use of the radon transform (17,18) at a SPECT value of 50 with 201Tl ball phantom sizes of 5.58, 4.65, 3.72, 2.79, 1.86, and 0.93 cm (90.9, 52.6, 26.9, 11.4, 3.4, and 0.4 cm3, respectively) (Fig. 1); the effects of the aperture of the parallel-beam collimator were added. The program was implemented with Visual C++6.0 (Microsoft Inc.) and a personal computer (Pentium IV, 2.2 GHz, 256 megabytes of memory).

Reconstruction image for ball simulation with balls of various sizes.
The sizes of the x-, y-, and z-axes in each ball were determined with the FWHM of profile curves.
Phantom Study
Data were obtained at rotation radii of 14.5, 18.5, 22.5, 26.5, and 30.5 cm (Fig. 2) by use of a 201Tl line-source phantom with a diameter of 0.1 cm. In the line-source phantom, the central, radial, and tangential system resolutions were evaluated with the FWHM. It is the average of all of the line sources.
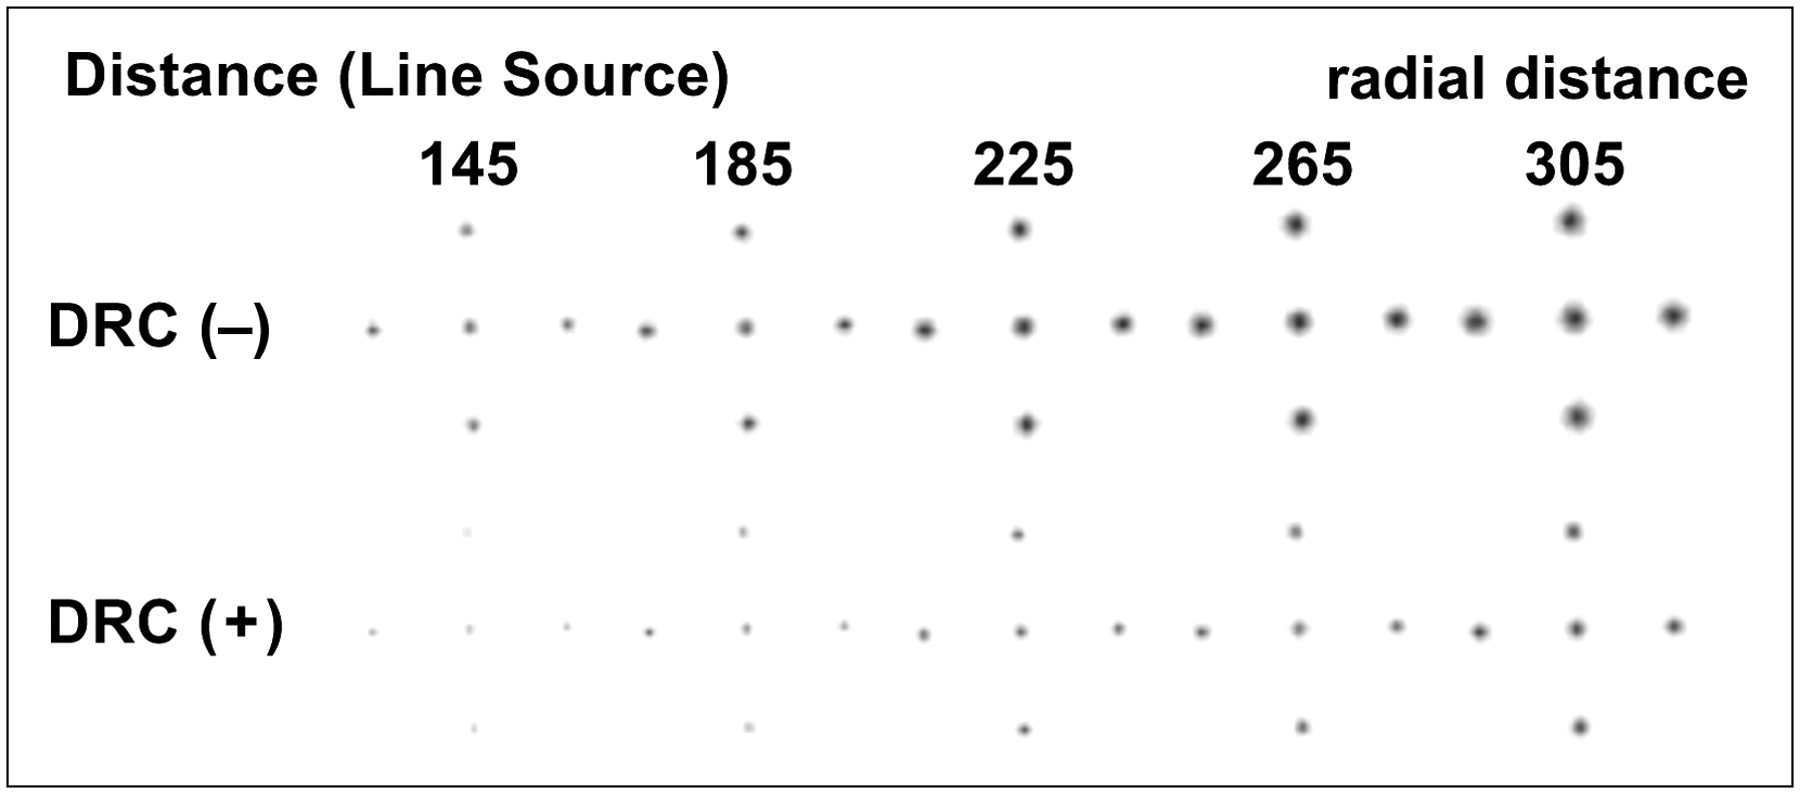
Reconstruction image for line-source phantom in which radial distances were changed. DRC (−) = before DRC; DRC (+) = after DRC.
An amount of radioactivity of 201TlCl the same as the clinical count was used to fill a phantom with hot rods. This cylinder phantom was 20.0 cm tall and had a 20.0-cm diameter (AZ-660; Anzai-Sogyo). The hot rods of this phantom were 2.0, 1.5, 1.0, and 0.8 cm in diameter and were placed at equal intervals. Contrast on the SPECT images was evaluated with a profile curve indicated by the arrow on the scheme in Figure 3 (top).
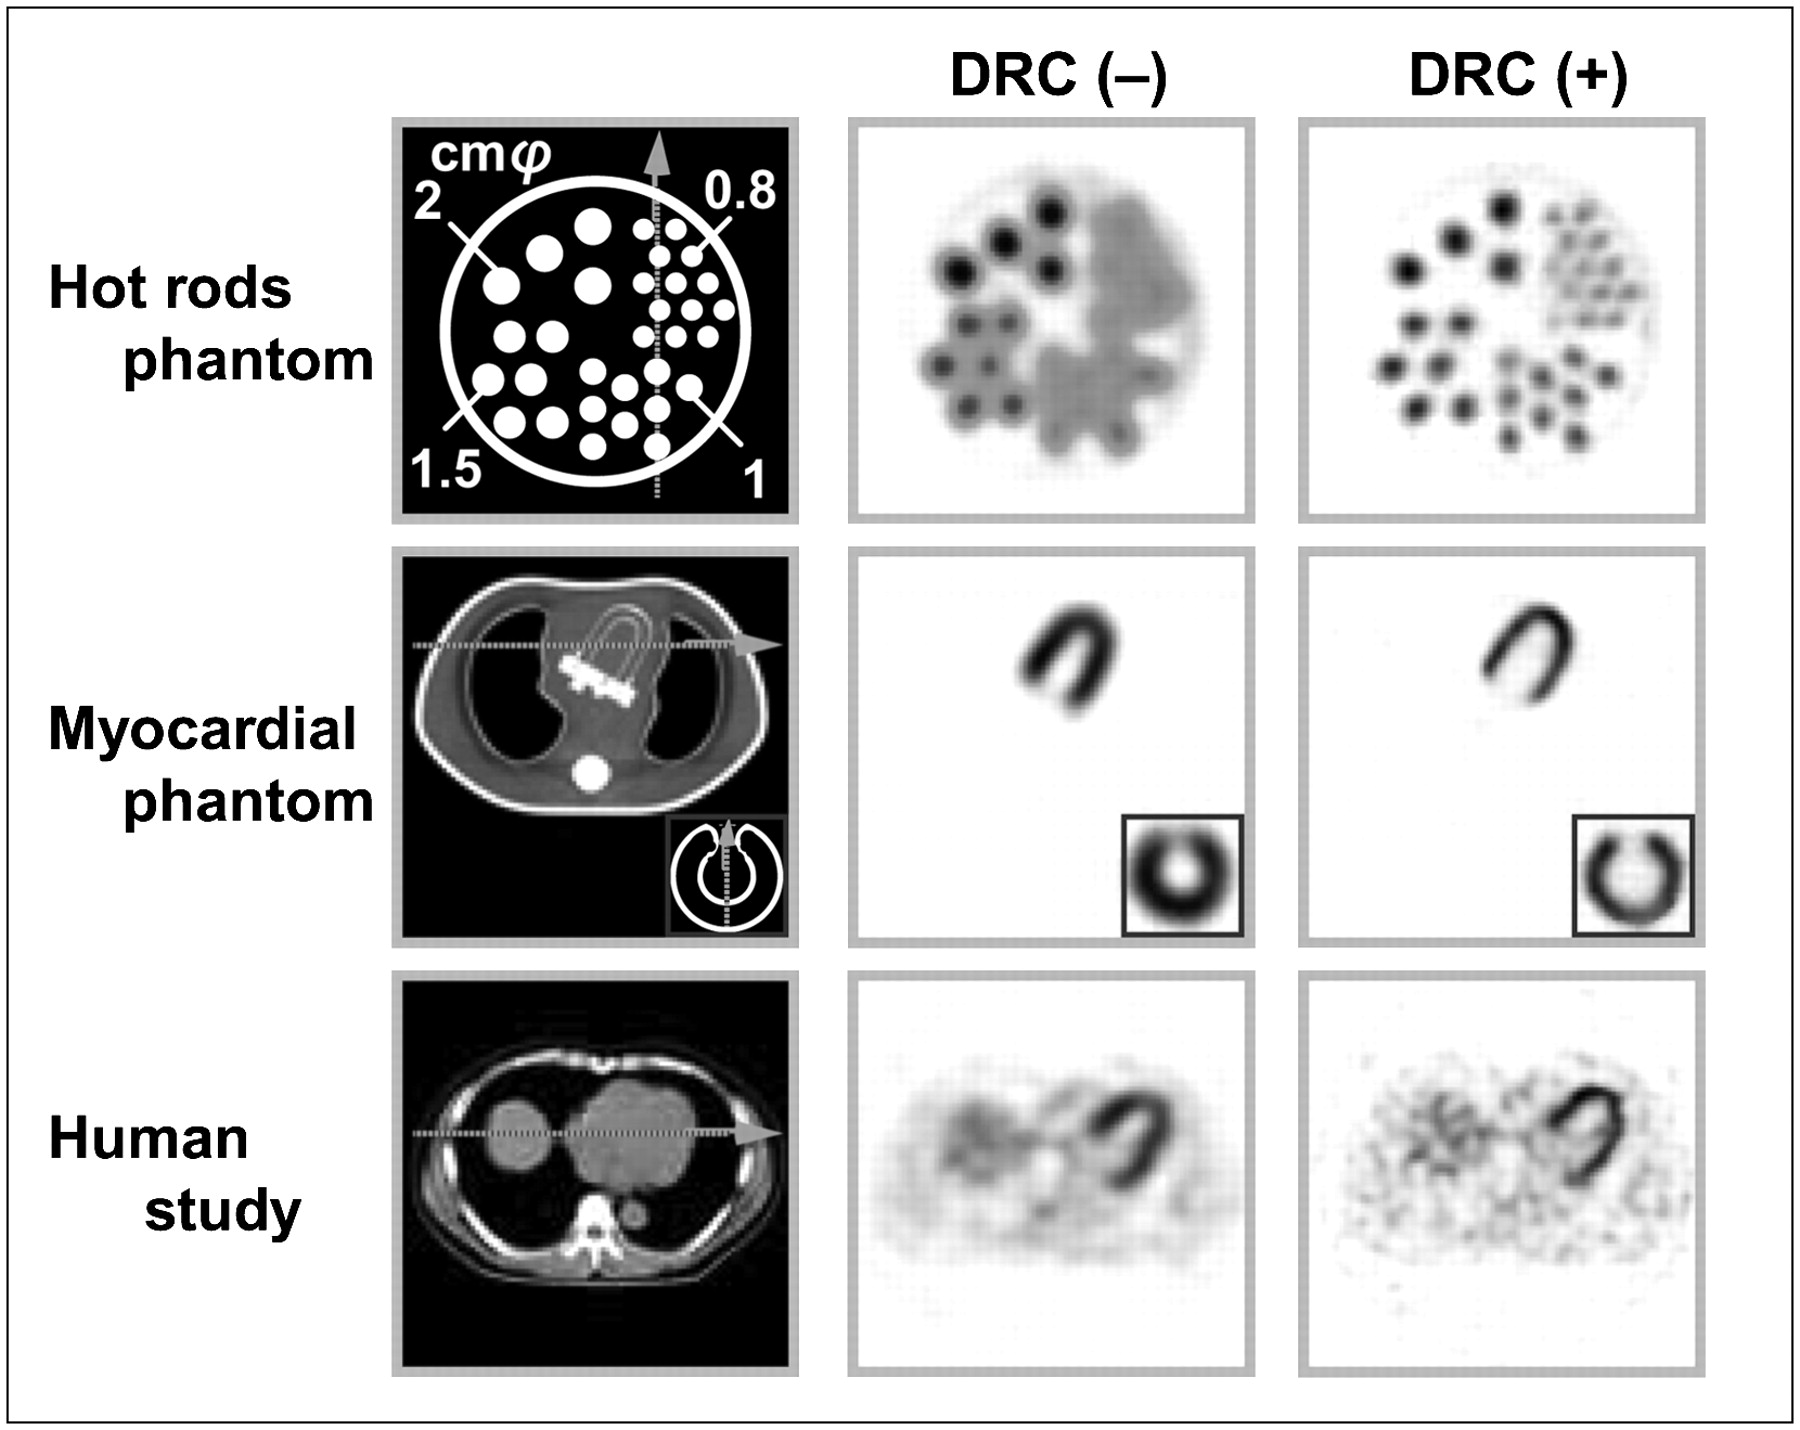
Emission CT images before DRC (−) and after DRC (+). Hot-rod phantom, myocardial phantom, and human study are shown from top to bottom. Schemes are shown at left.
In the myocardial phantom (Data Spectrum Corp.), a defect area (rectangle measuring 15.0 × 15.0 × 10.0 cm) was established on the anterior wall, and transaxial and short-axis images were reconstructed. Contrast in the myocardium and the defect area on the anterior wall on the CT images was evaluated by use of the profile curve indicated by the arrow on the scheme in Figure 3 (middle).
Each phantom was injected with 201TlCl at 92.5 kBq/mL (9.25 kBq/mL injected into the chest region of the myocardial phantom). The rotation radius was 22.5 cm, except for the line-source phantom.
Human Study
Imaging was a rest study performed for a healthy subject (50-y-old man) at 15 min after the intravenous injection of 111 MBq of 201TlCl. Contrast in the myocardium on the transverse images was evaluated by use of a profile curve indicated by the arrow on the scheme in Figure 3 (bottom). The rotation radius was 22.5 cm.
SPECT System and Acquisition Parameters
The SPECT system used was GCA-9300A/UI (Toshiba Medical Systems) equipped with 1 cardiac fanbeam collimator and 2 parallel-beam collimators (low energy, high resolution). The data processor used was GMS-5500A/PI (Toshiba Medical Systems).
The TCT and SPECT data were acquired simultaneously by use of a matrix of 128 × 128 and the step-and-shoot mode (30 s per projection angle) at an interval of 6° (60 projection angles for 360°) (18). The pixel size was 0.32 cm. The counts per pixel in the TCT projection data were about 75 in the myocardial phantom and the myocardial area in the human study and were greater than 120 on the blank scan.
After the AC scan, the attenuation coefficient maps were generated from TCT data by use of filtered backprojection. The data were reconstructed by use of a Butterworth window ramp filter with a cutoff of 0.44 cycles per centimeter and an order of 8. Subsequently, the projection data acquired by use of 2 detectors with parallel-beam collimators were summed, and they were images from the same rotation angle for each detector. The SPECT images were reconstructed from these summed projection data by use of the OSEM algorithm with or without DRC. The numbers of subsets and iterations were 5 and 10, respectively (19). Fanbeam data were not included in the SPECT image reconstruction.
RESULTS
Simulation
Figure 1 shows the images for the ball simulation, and Table 1 shows the measurements for FWHM before and after DRC. Errors on the x-, y-, and z-axes were improved by less than 3%–10% in all balls.
Measurements of FWHM Before and After DRC in Ball Simulation
Phantom Study
The SPECT images are shown in Figure 3, and the measurements for FWHM before and after DRC are shown in Table 2. The lines were markedly thinned by DRC, but the improvement was insufficient in measurements with a long source–detector distance. The improvement was highest at the center, and a slight distortion in the central direction was observed in the radial and tangential regions.
Measurements of FWHM Before and After DRC in Phantom Study
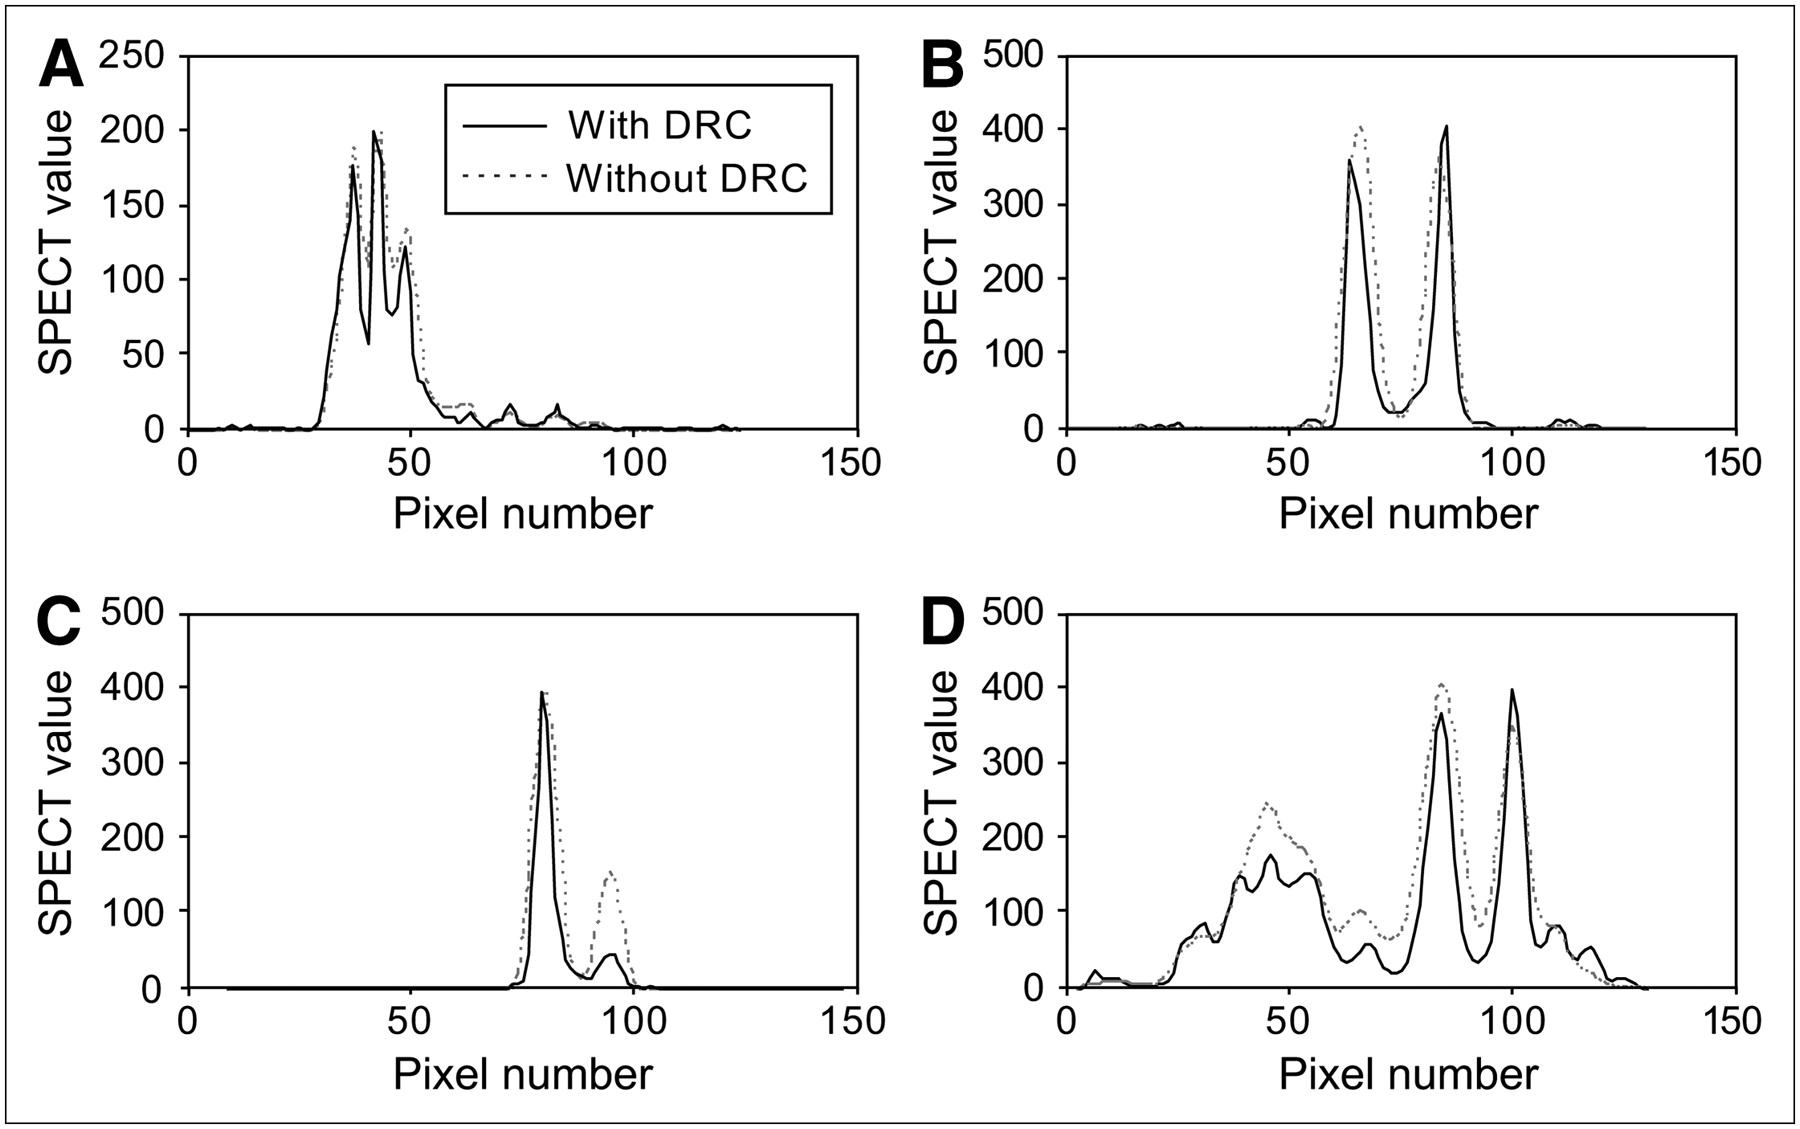
In the hot-rod phantom study (Fig. 3, top), the spatial resolution of the hot rods was clearly improved by DRC, and the hot rods with radii of 0.8 and 1.0 cm could be observed. Although the true size of the scheme was 1.5 cm, when the DRC for SPECT was measured (FWHM), it was only 1.2 cm (Fig. 4A).

Circumferential profile analysis at dotted line in each scheme. (A) Hot-rod phantom study. (B) Myocardial phantom study (transverse). (C) Myocardial phantom study (short axis). (D) Human study.
In the myocardial phantom (Fig. 3, middle), the thickness of the myocardium was clearly reduced after DRC, and the border of the myocardial wall and the cardiac lumen were clearly observed on the transverse image (Fig. 4B). Imaging of the defect area on the short-axis image was also clear (Fig. 4C).
DISCUSSION
Several studies on the spatial resolution of SPECT have shown that the resolution varies with the source–detector distance and the collimator (1–10).
With regard to the correction of resolution with resolution-restorative filters, such as the Winer filter and the Metz filter, because the correction of blurring, which depends on the source–detector distance, is impossible, overestimation or underestimation of the position in a reconstruction image occurs, and the accuracy is low. With regard to correction with the frequency–distance relationship proposed by Edholm et al. (1), the signal at a distance from the center of rotation is concentrated along lines on the 2-dimensional Fourier transform of the sinogram, but 3-dimensional correction including the longitudinal-axis direction is difficult with this method.
With the OSEM method, photon attenuation, scattering, and resolution are introduced into the basic equation, and correction of each factor is possible. Yokoi et al. (9) and Maeda et al. (10) performed phantom studies by methods without TCT and found that the maximal error was 7%–10% of preset levels. Similar results were reported by Formiconi et al. (20), and clinical effects were considered low.
On the basis of those earlier studies, we attempted to improve quantification in simulation, hot-rot phantom, myocardial phantom, and human studies by 201TlCl myocardial SPECT with the TEW method for SC, a TCT external source for AC, and DRC.
In the simulation and phantom studies, FWHM was very good, with an error range within 10% of the measurements. However, in the line-source phantom, the system resolution showed limited correction with increases in the radial distance. In addition, according to the profile curve in Figure 4A, although there must be 5 peaks, the hot-rod phantom profile curve identified only 3 main peaks. This finding may have been attributable to the pixel size or partial-volume effects (21) because 1 pixel was 0.32 cm. However, in the human study, there were few errors, indicating that the data acquisition conditions were clinically appropriate.
These results indicate that the resolution of SPECT was related to the contributions of attenuation, scatter, and DRC. However, although the amount of correction that is possible changes with the model, filters, and other items, the results of the present study suggest that the accuracy of imaging of small infarction lesions will be clinically improved.
CONCLUSION
We attempted to improve resolution with 201Tl as a tracer, TCT with an external 99mTc γ-ray source for AC, the TEW method for SC, and simultaneous resolution correction introduced into the OSEM algorithm. This method was shown to be very useful for the improvement of SPECT image quality.
Acknowledgments
We thank Kenzo Ide, Ryosuke Ueda, Yuki Yoshii, and Masaya Suzuki (Nihon Medi-Physics Co., Ltd.) for their technical support.
Footnotes
-
COPYRIGHT © 2007 by the Society of Nuclear Medicine, Inc.
References
- Received for publication November 15, 2005.
- Accepted for publication November 28, 2006.


Jump to section
Related Articles
Cited By...
- No citing articles found.