


Article Figures & Data
Figures
- FIGURE 1.
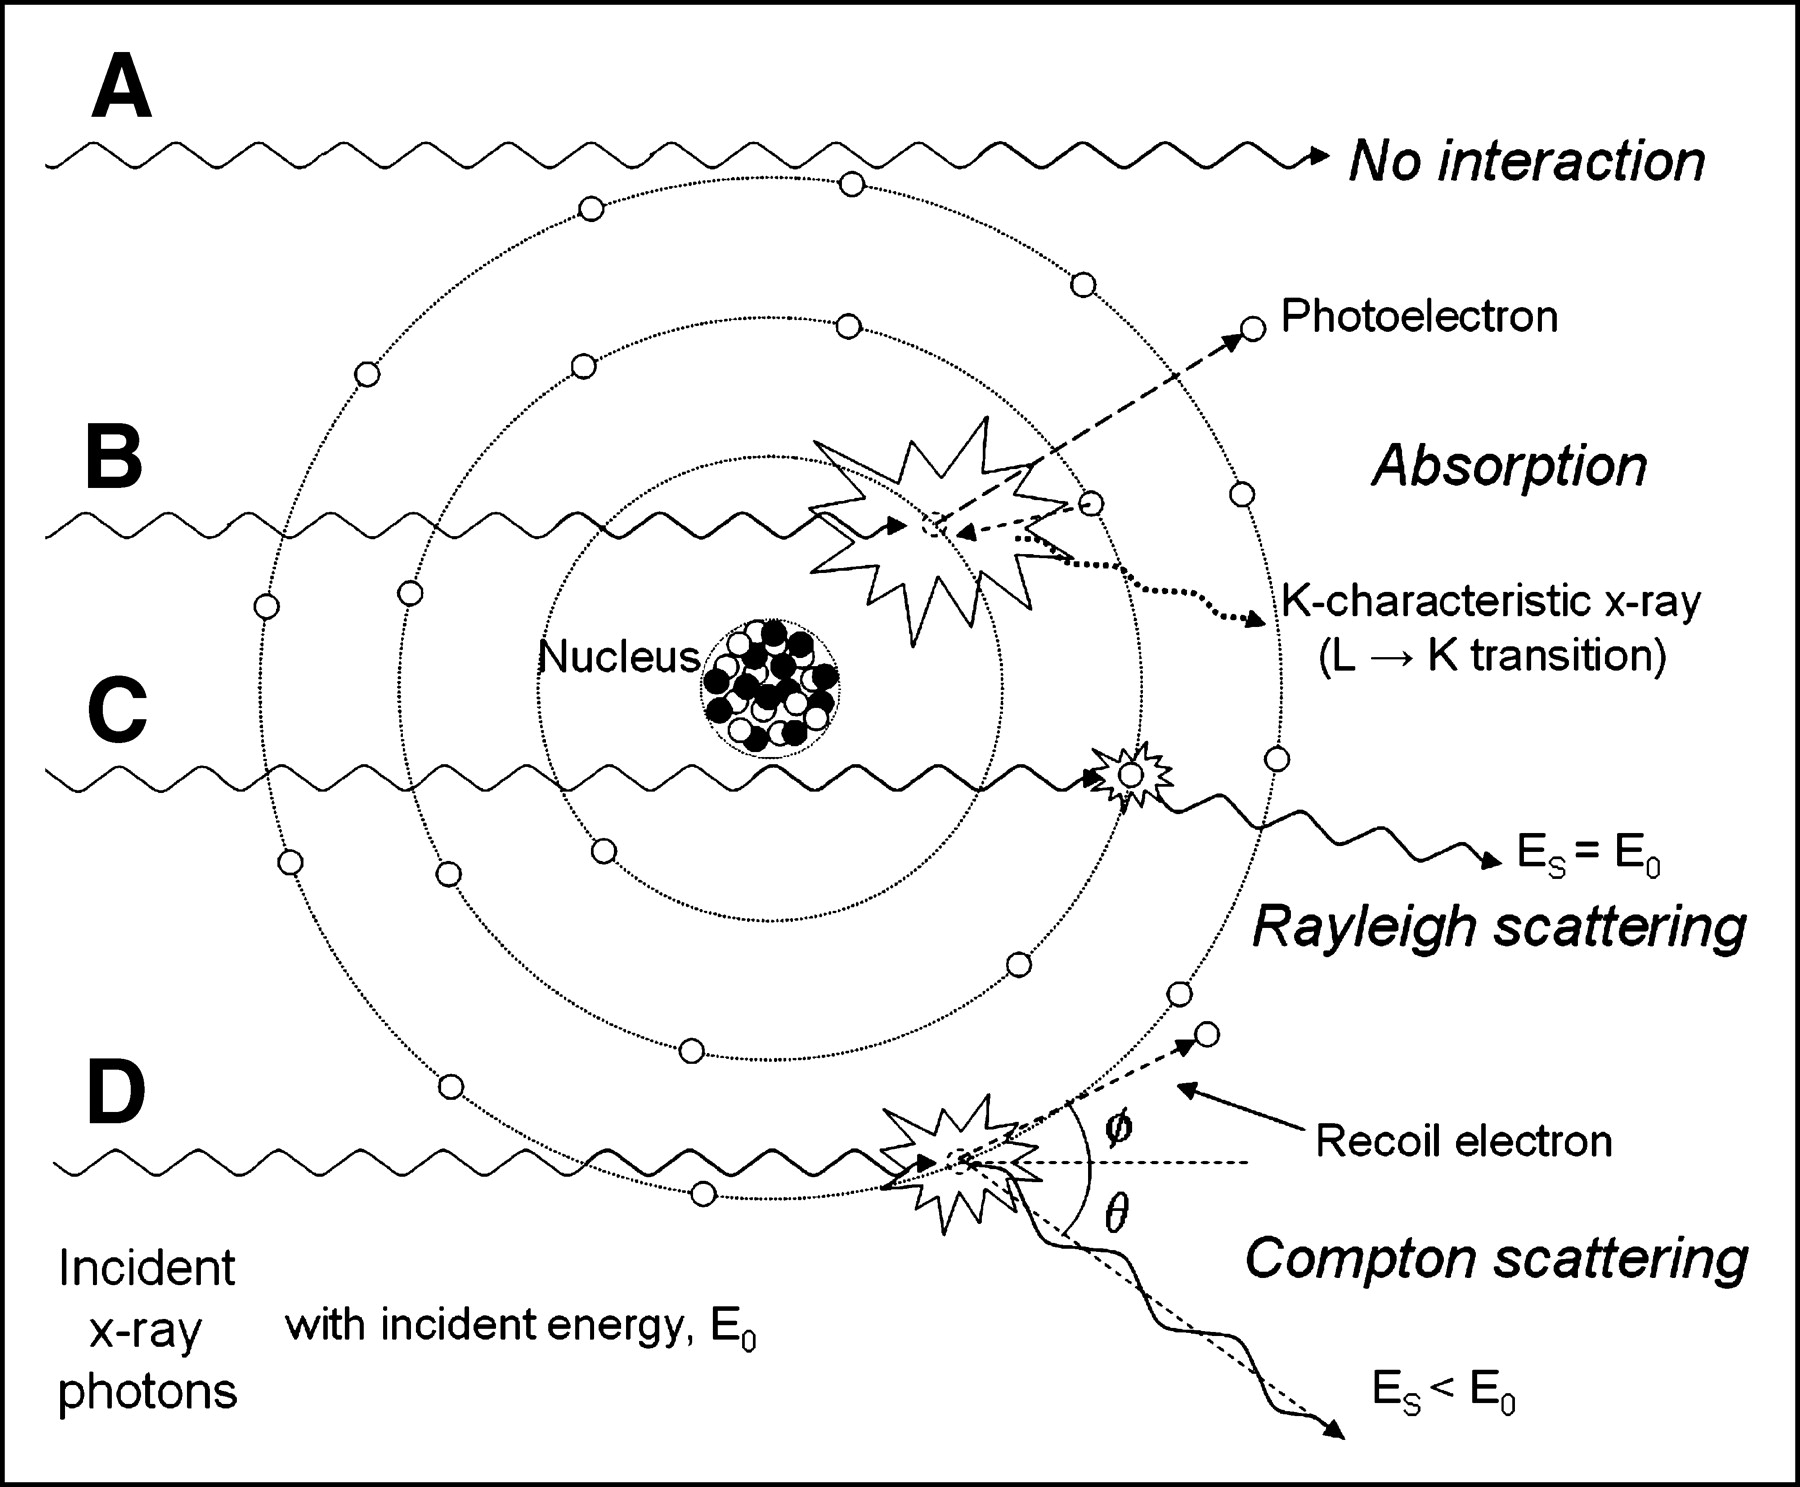
Illustrative summary of x-ray and γ-ray interactions. (A) Primary, unattenuated beam does not interact with material. (B) Photoelectric absorption results in total removal of incident x-ray photon with energy greater than binding energy of electron in its shell, with excess energy distributed to kinetic energy of photoelectron. (C) Rayleigh scattering is interaction with electron (or whole atom) in which no energy is exchanged and incident x-ray energy equals scattered x-ray energy with small angular change in direction. (D) Compton scattering interactions occur with essentially unbound electrons, with transfer of energy shared between recoil electron and scattered photon, with energy exchange described by Klein–Nishina formula.
- FIGURE 2.
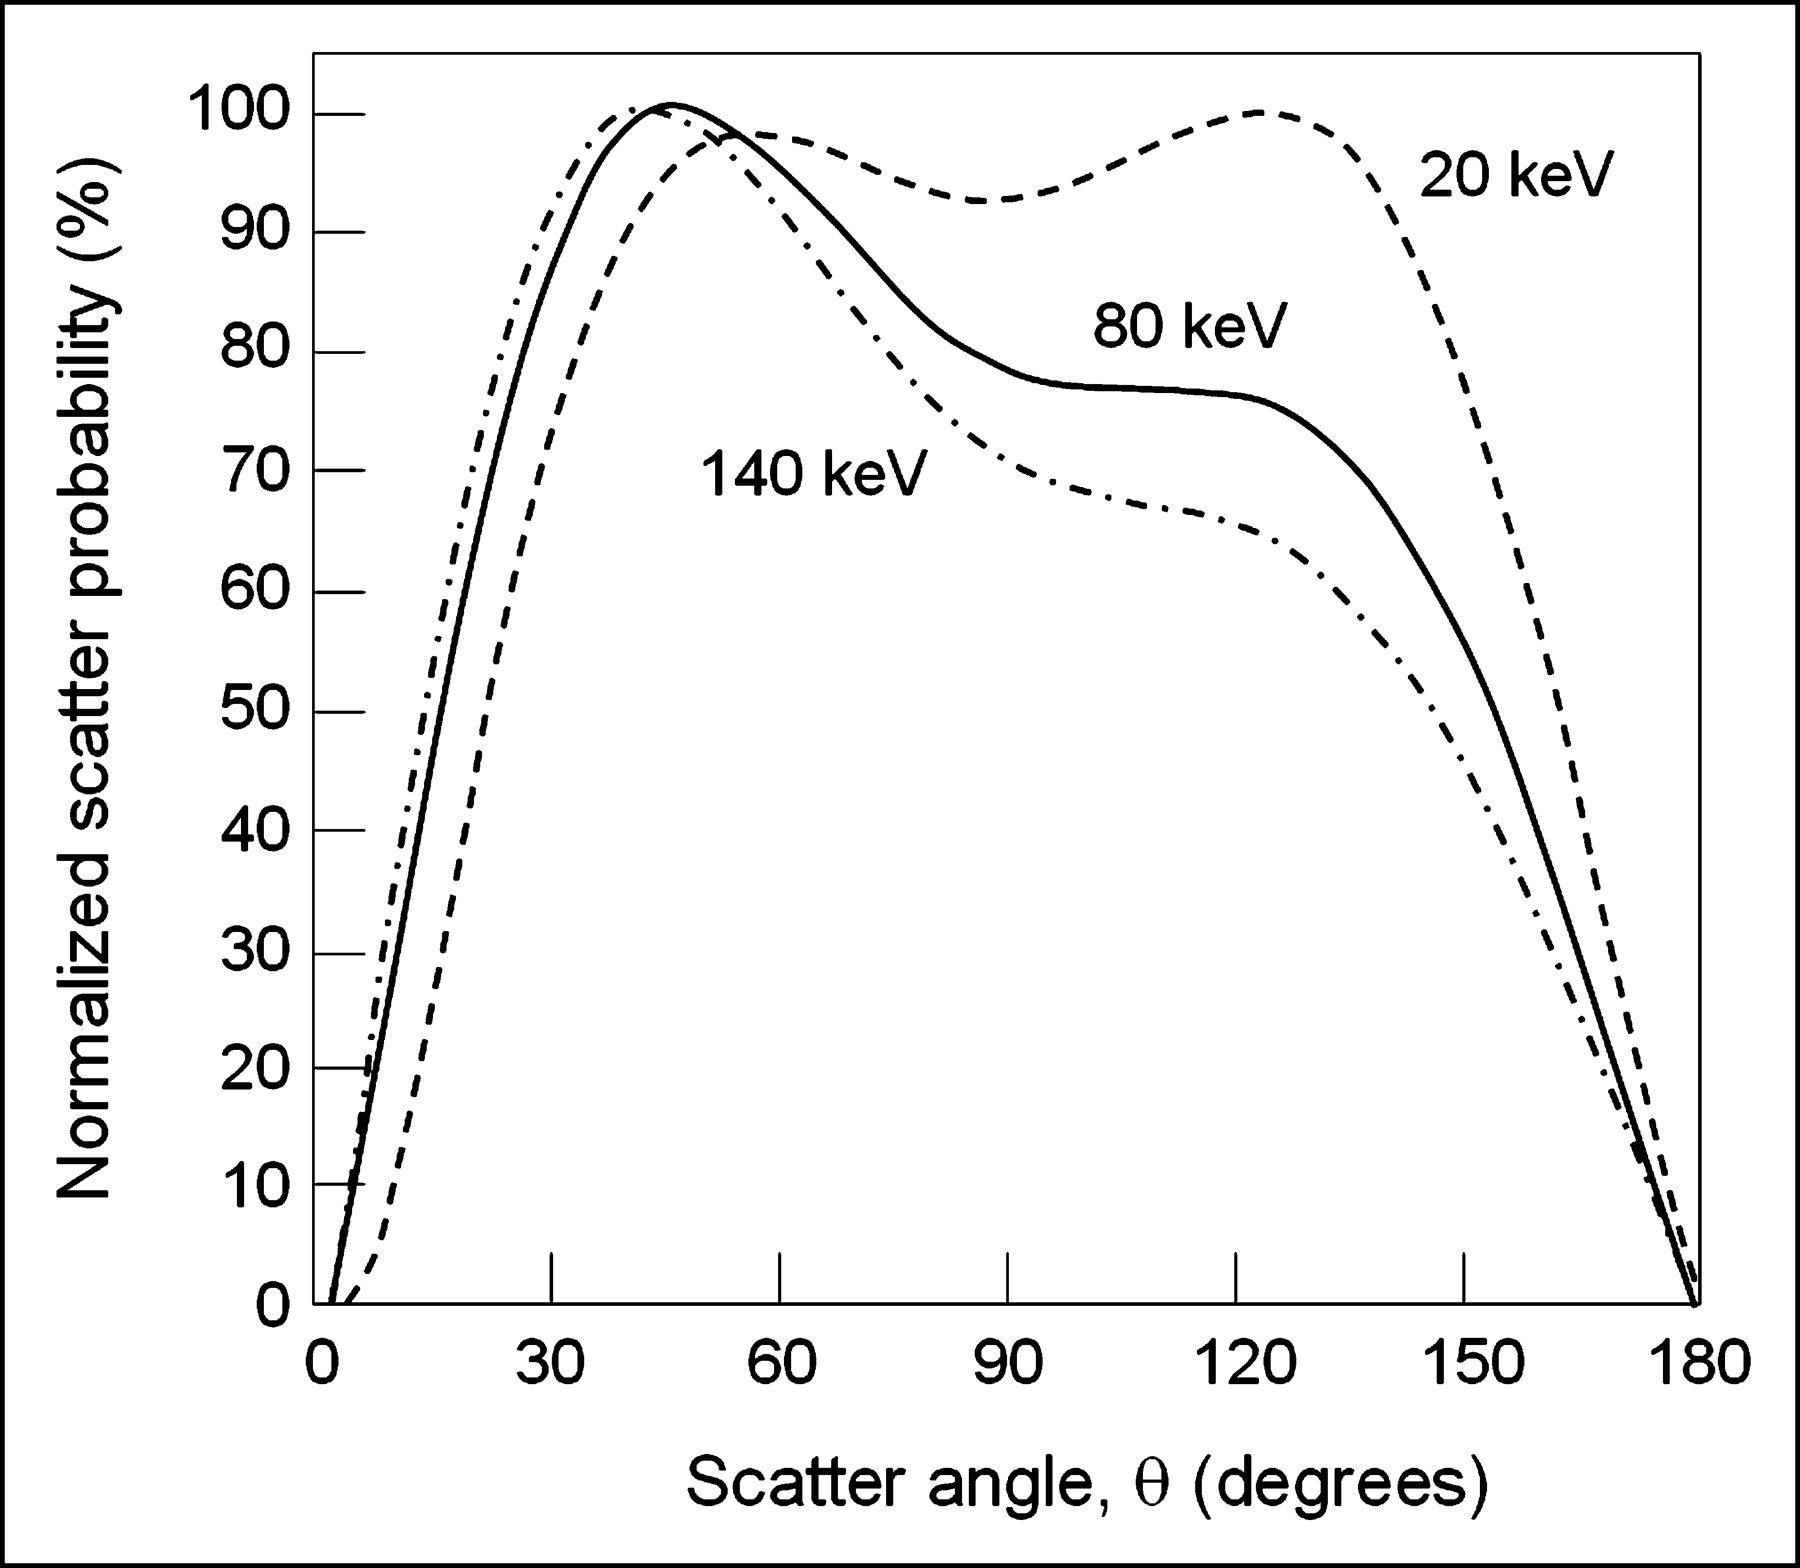
Plot of scatter distribution probability as function of angle relative to incident photon direction. Three energies (20, 80, and 140 keV) show relatively isotropic distribution (in all directions) of scatter at low energies becoming more forward peaked (smaller scatter angle) at high energies.
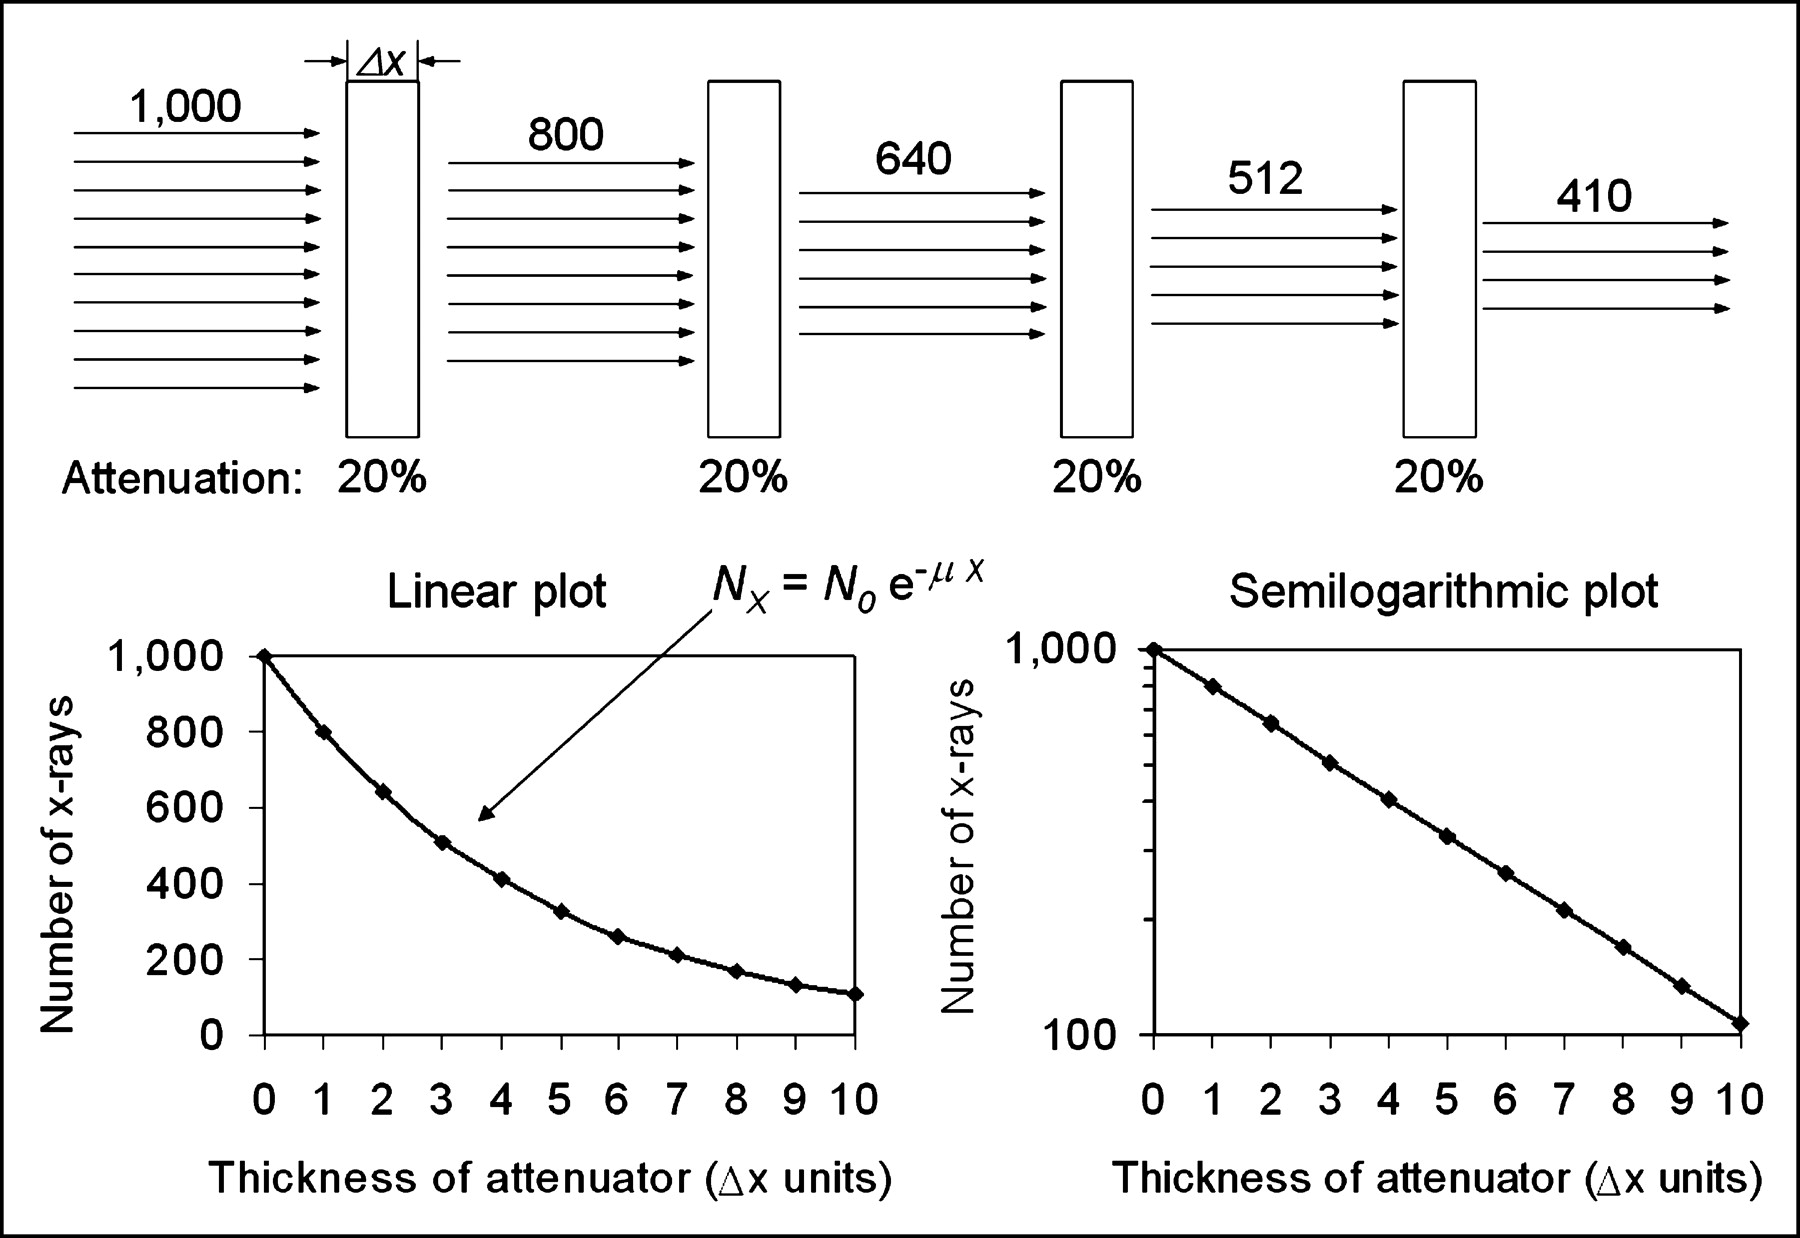
- FIGURE 3.
Monoenergetic x-rays are transmitted through several layers of an attenuator with attenuation coefficient, μ, of 20% per unit thickness. Attenuation occurs exponentially, as illustrated by plot (bottom left) of primary x-rays transmitted as function of attenuator thickness. On semilogarithmic plot (bottom right), exponential curve is straight line for monoenergetic x-ray beam.
- FIGURE 4.
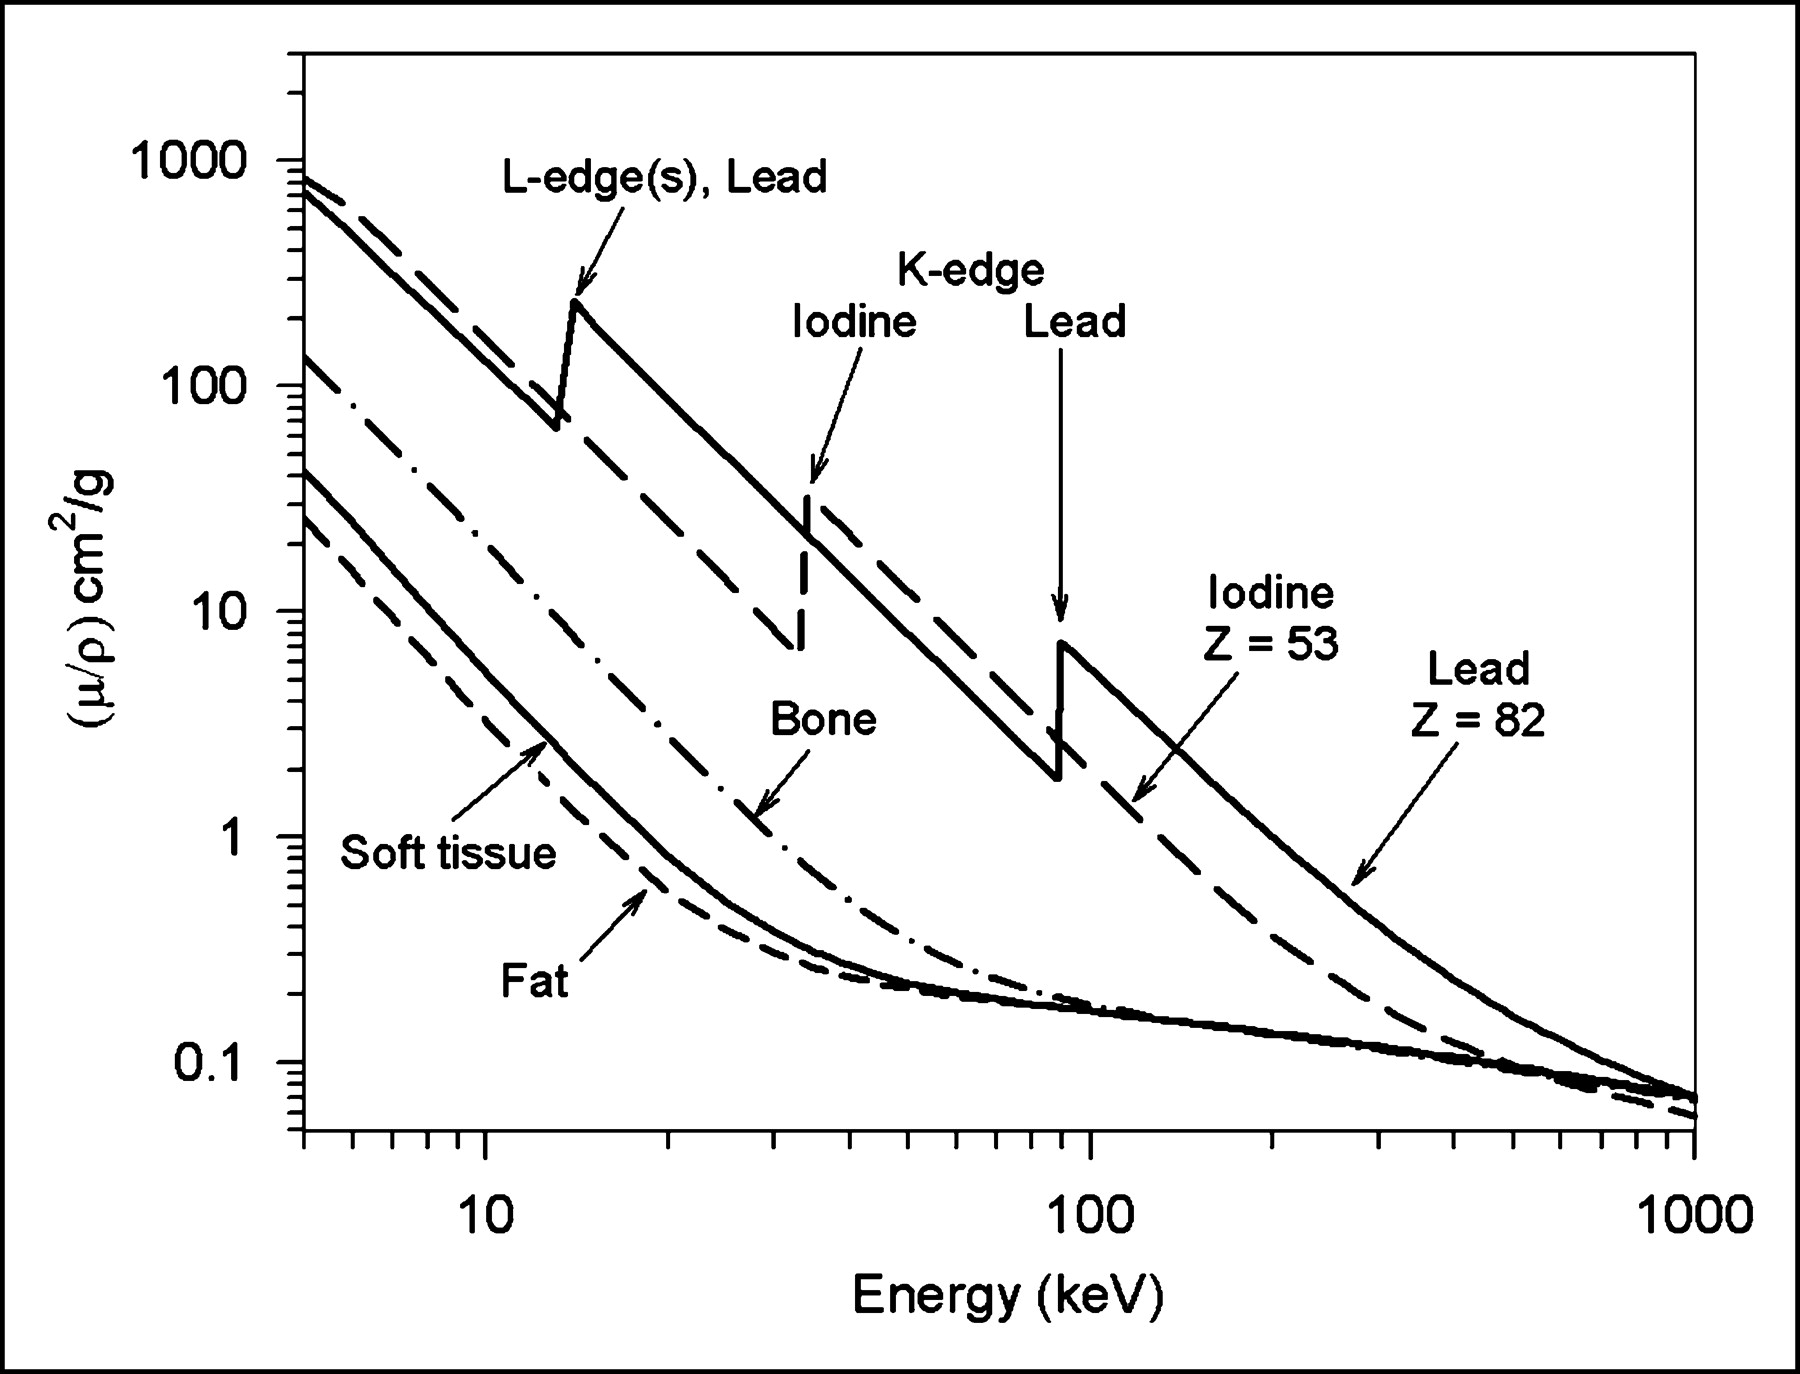
Mass attenuation coefficient (μ/ρ) of several materials encountered in diagnostic x-ray imaging are illustrated as function of energy. From these plots it can be determined that mass attenuation decreases at a rate of approximately 1/E3 for low energy (∼10 to ∼100 keV) and increases as a function of atomic number (Z) of attenuating material as approximately Z3. With higher Z, presence of “absorption edges” results from increased attenuation of x-rays by photoelectric absorption event at energies equal to binding energies of electrons in the specific element.
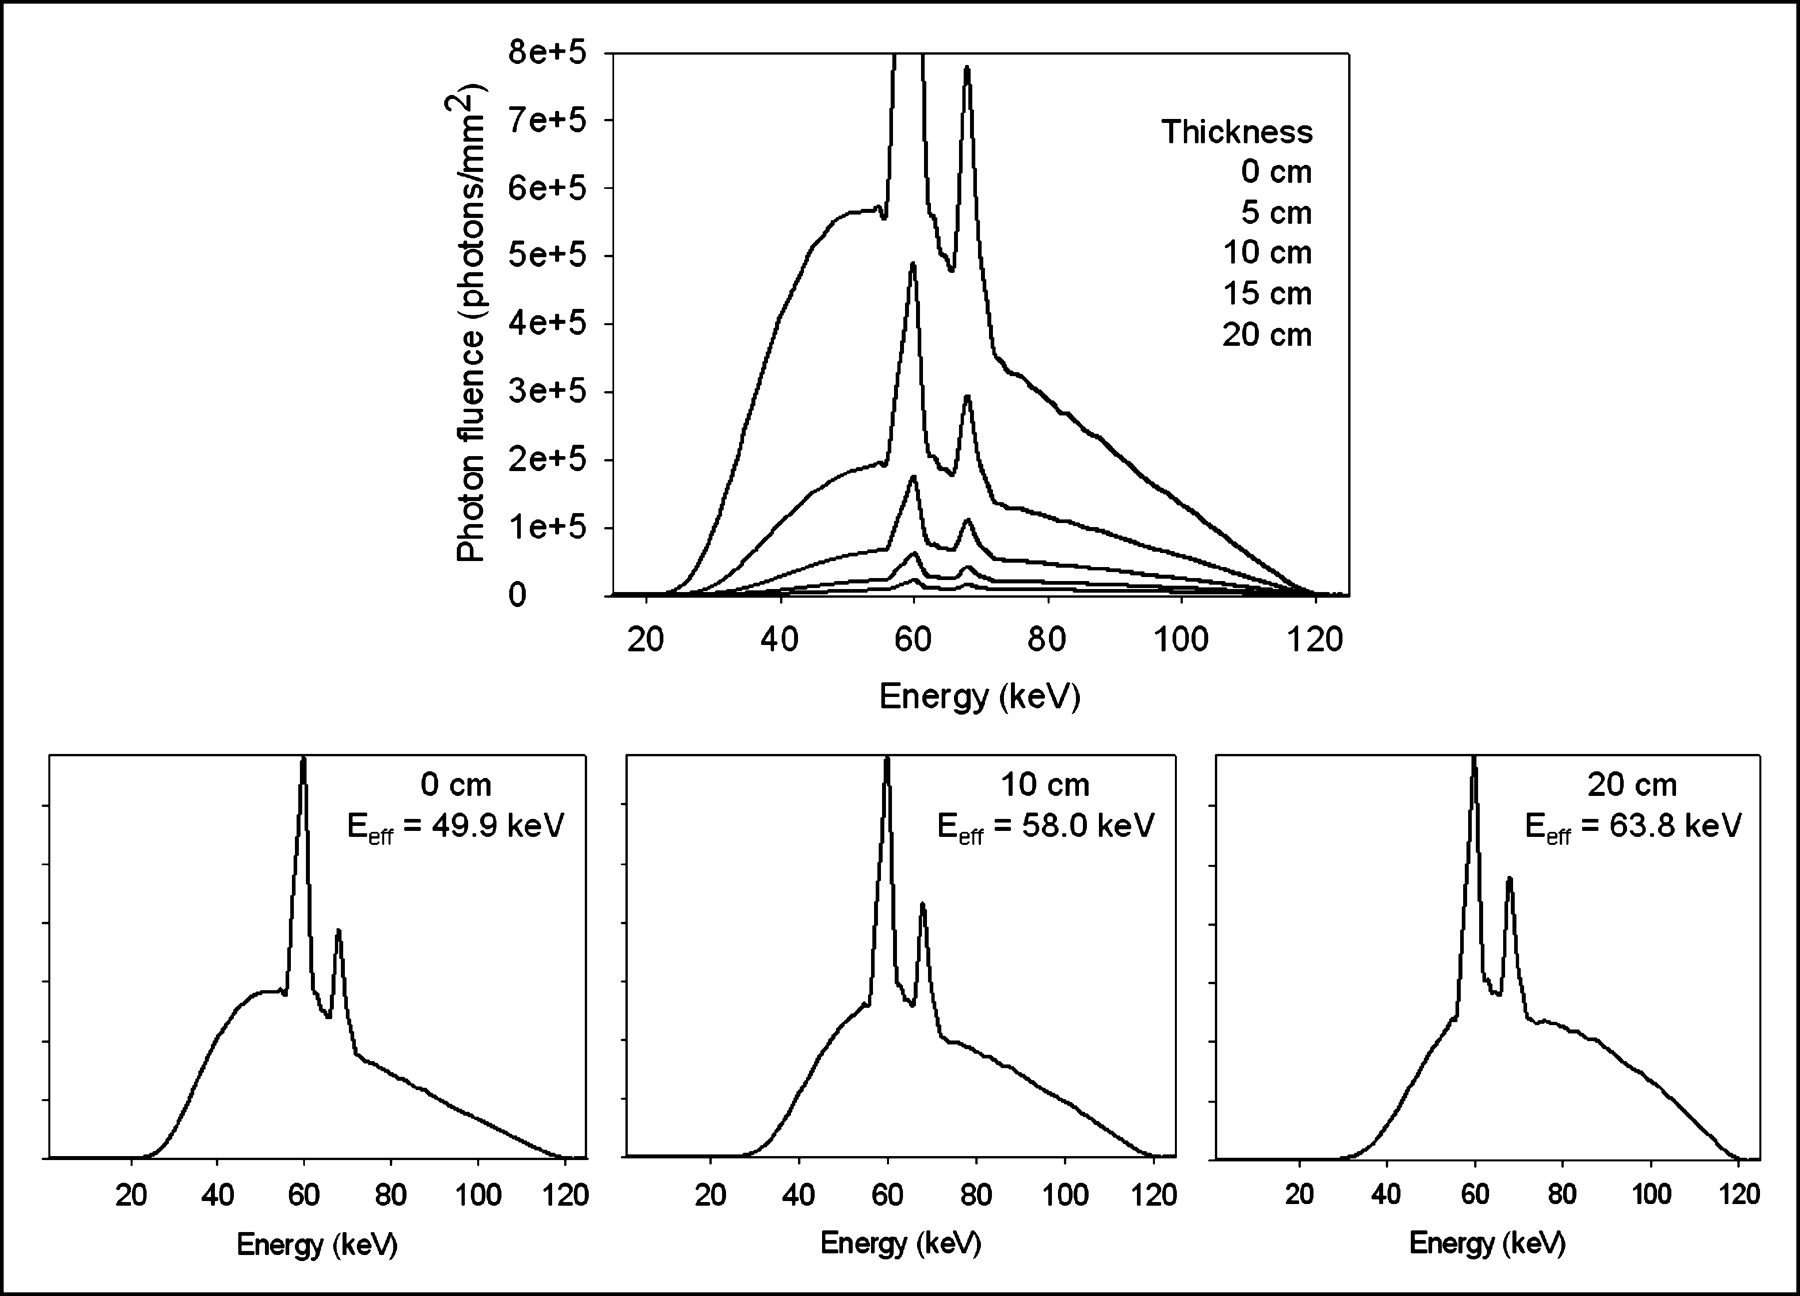
- FIGURE 5.
Transmitted bremsstrahlung spectrum changes its energy distribution and photon fluence as result of x-ray attenuation. (Top) Curve shows 120-kVp spectrum transmitted through 0-, 5-, 10-, 15-, and 20-cm thickness of soft tissue (water), illustrating continually decreased number of photons and shift of spectrum to higher effective energy. (Bottom) Changing effective energy is more clearly shown for each transmitted spectrum normalized to peak transmitted x-ray energy in individual plots.
- FIGURE 6.
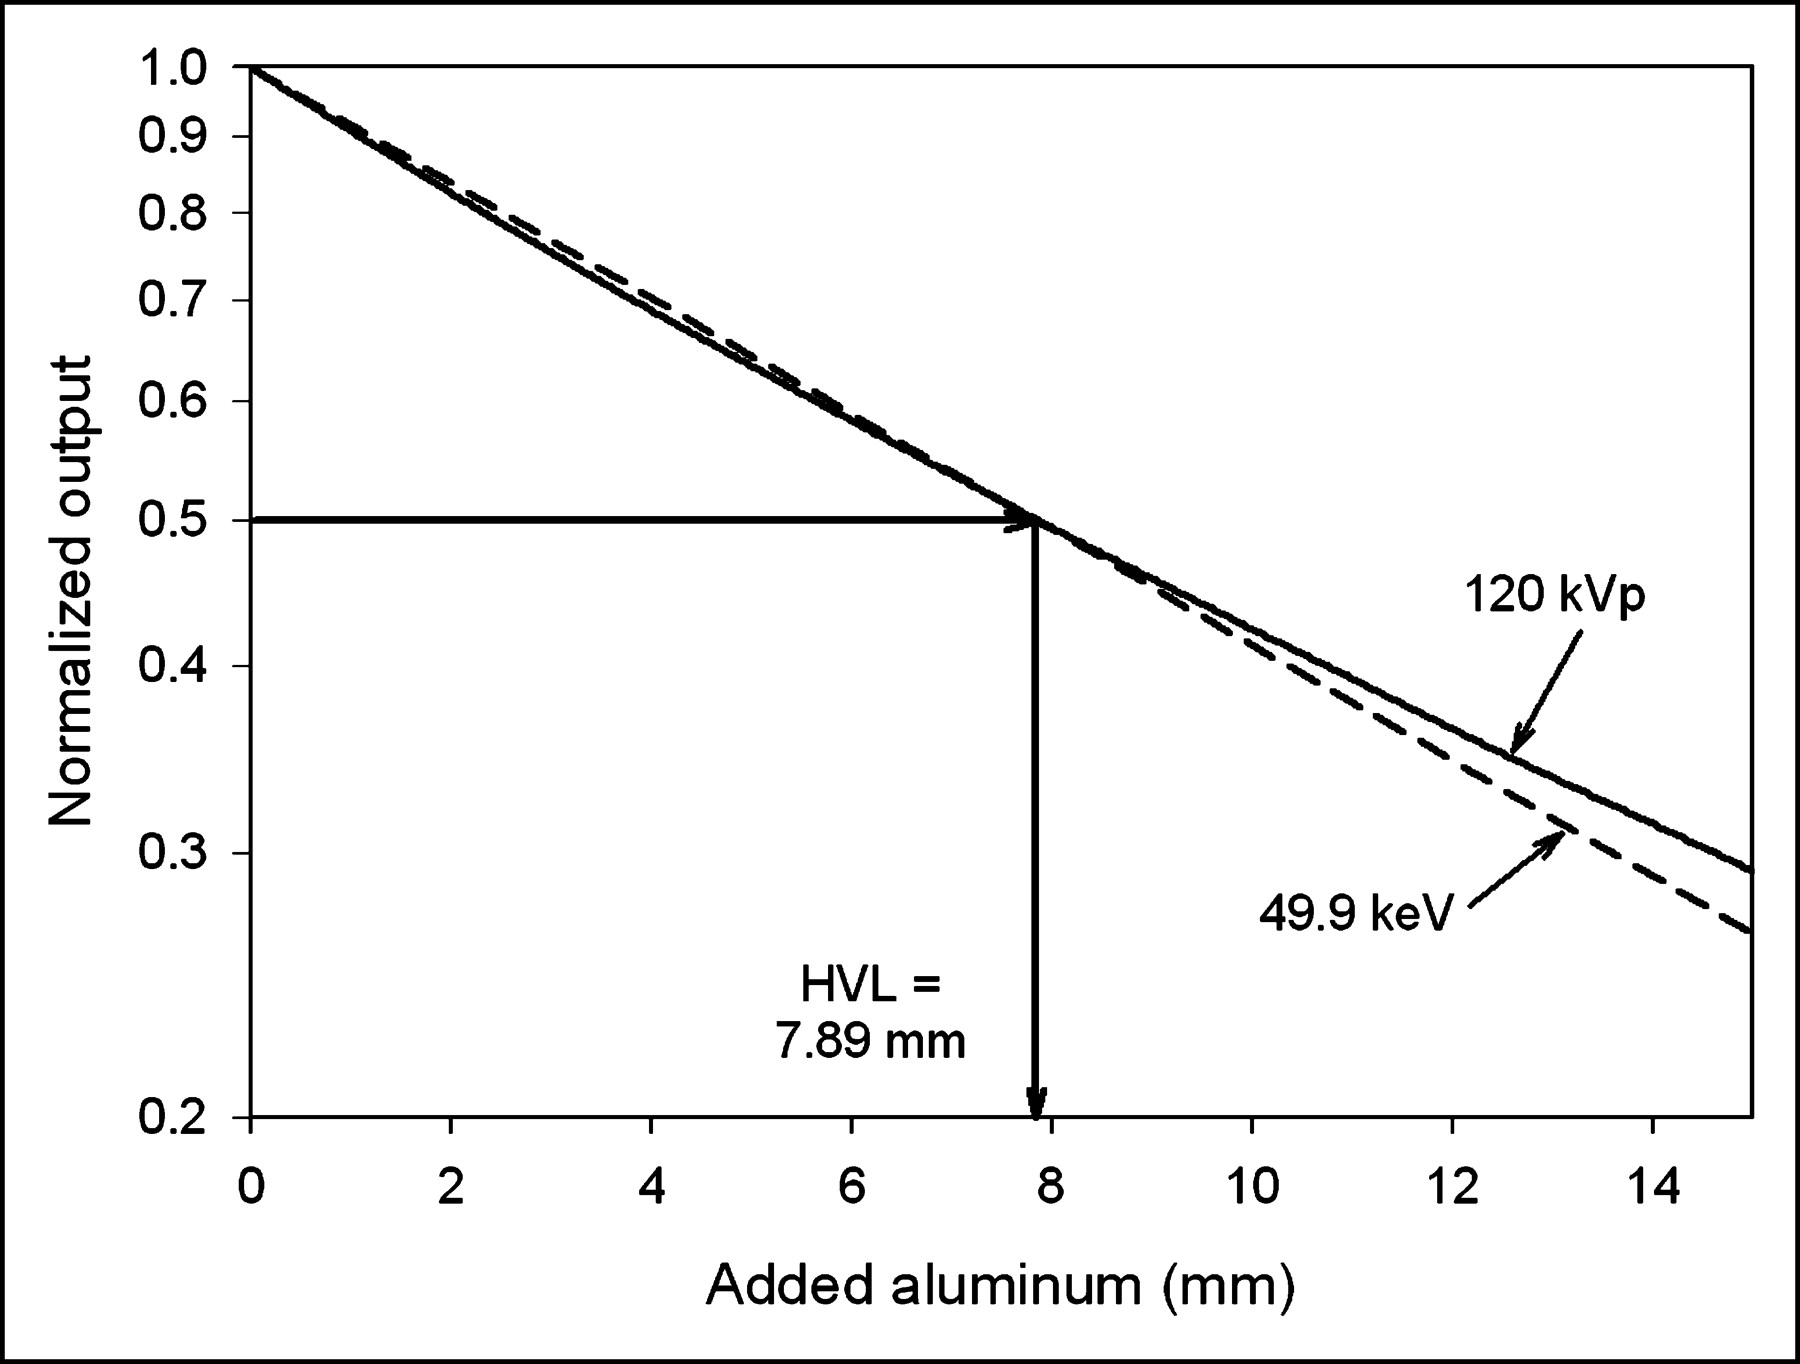
HVL of x-ray beam is thickness of aluminum necessary to reduce incident x-ray intensity by one half and is determined by measuring x-ray transmission as function of attenuator thickness. Depicted in 2 curves is 120-kVp spectrum measurement (solid line) and simulated monoenergetic beam (dashed line) that has same HVL. In this instance, HVL is 7.89 mm Al, and effective attenuation coefficient μeffective (cm−1) = 0.693/HVL = 0.693/0.789 cm = 0.88 cm−1. This linear attenuation coefficient corresponds to “effective” energy of 49.9 keV, determined from known mass attenuation curve of Al vs. energy, and correction for density.
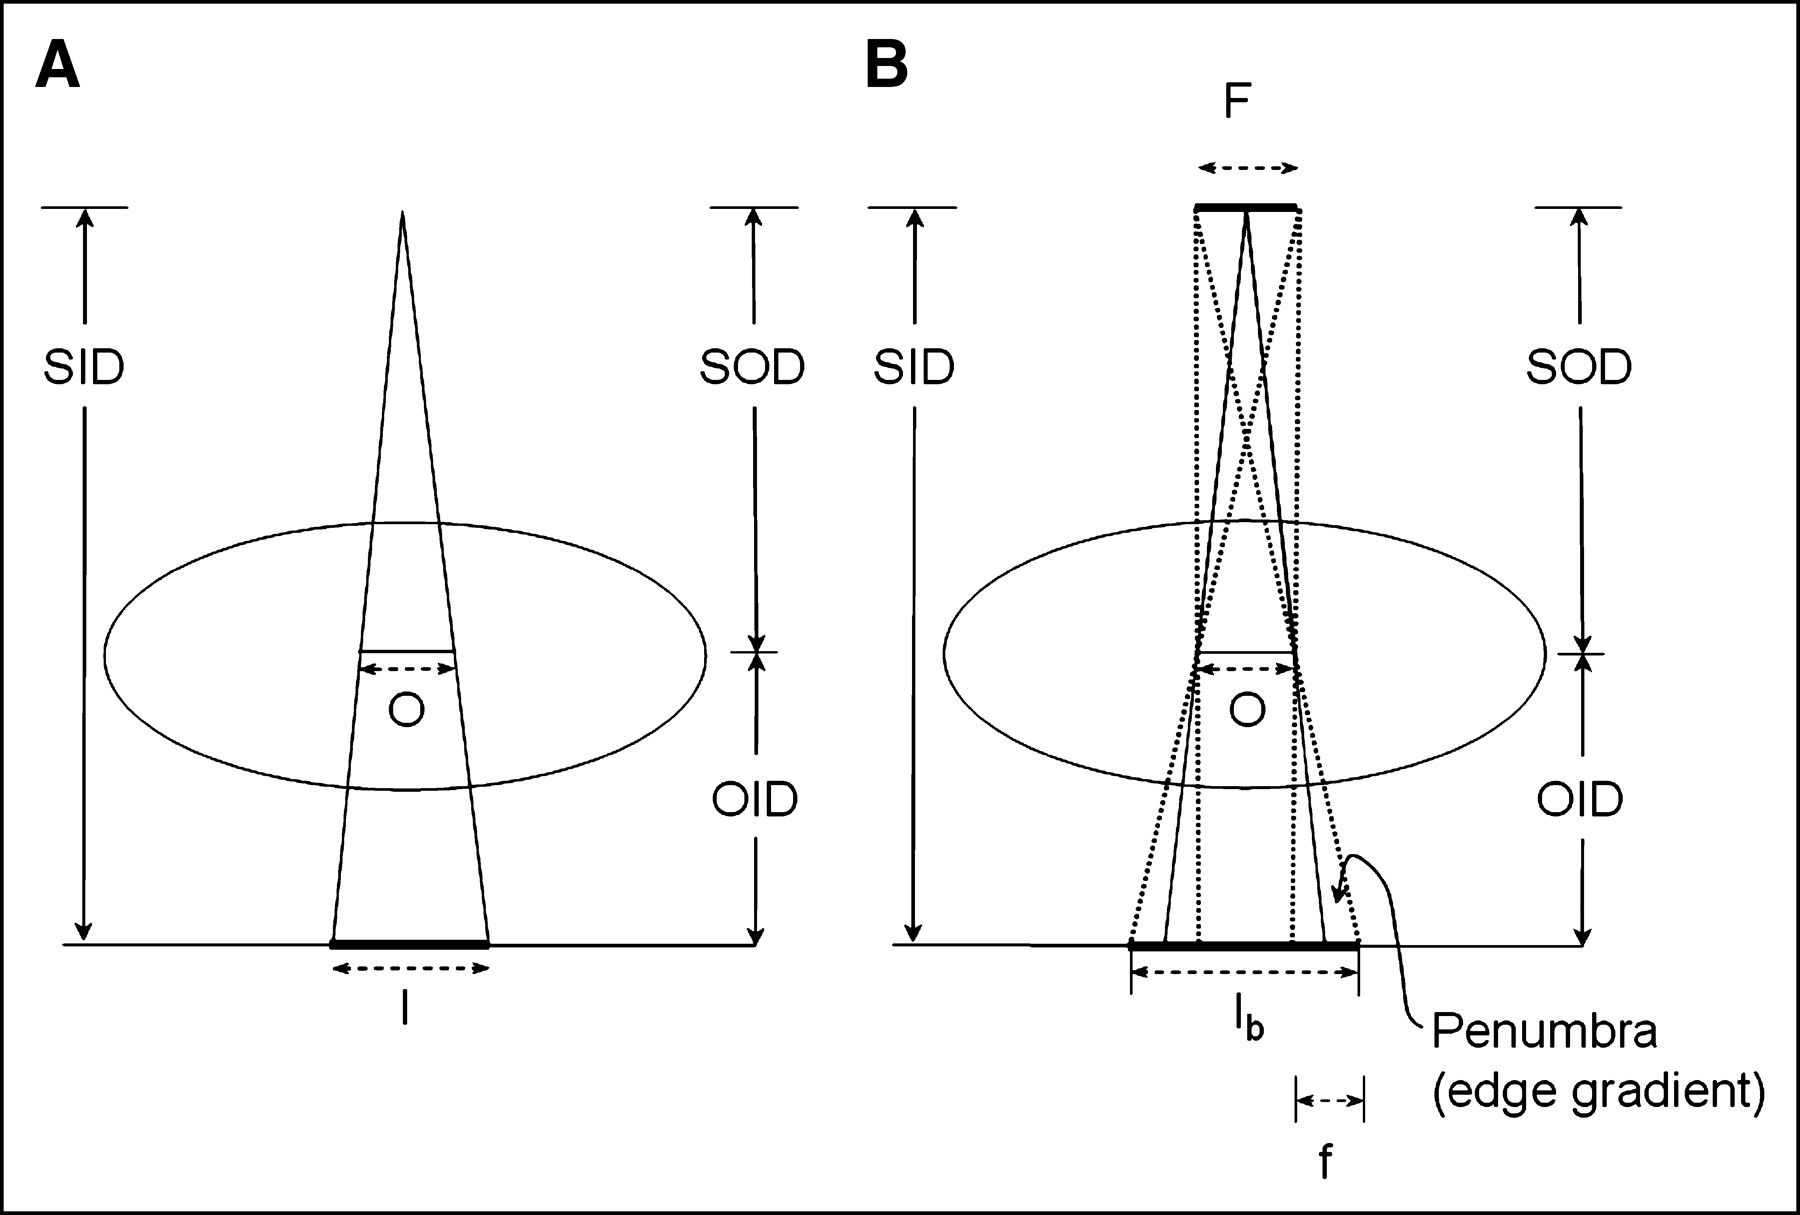
- FIGURE 7.
Image formation process from point source (A) and distributed source (B) and associated geometry terms are illustrated. By comparing similar triangles, it can be shown that M = SID/SOD. In B, blurring of object is caused by focal spot distribution incident on detector. Amount of blur, known as penumbra, increases with magnification for given focal spot size and also increases apparent magnification of object (compare Ib with I). SID = source image distance; SOD = source object distance; OID = object image distance; O = object; I = image; F = focal spot distribution; f = focal spot projection. Magnification is equal to ratio of image size to object size, M = I/O, for point source.
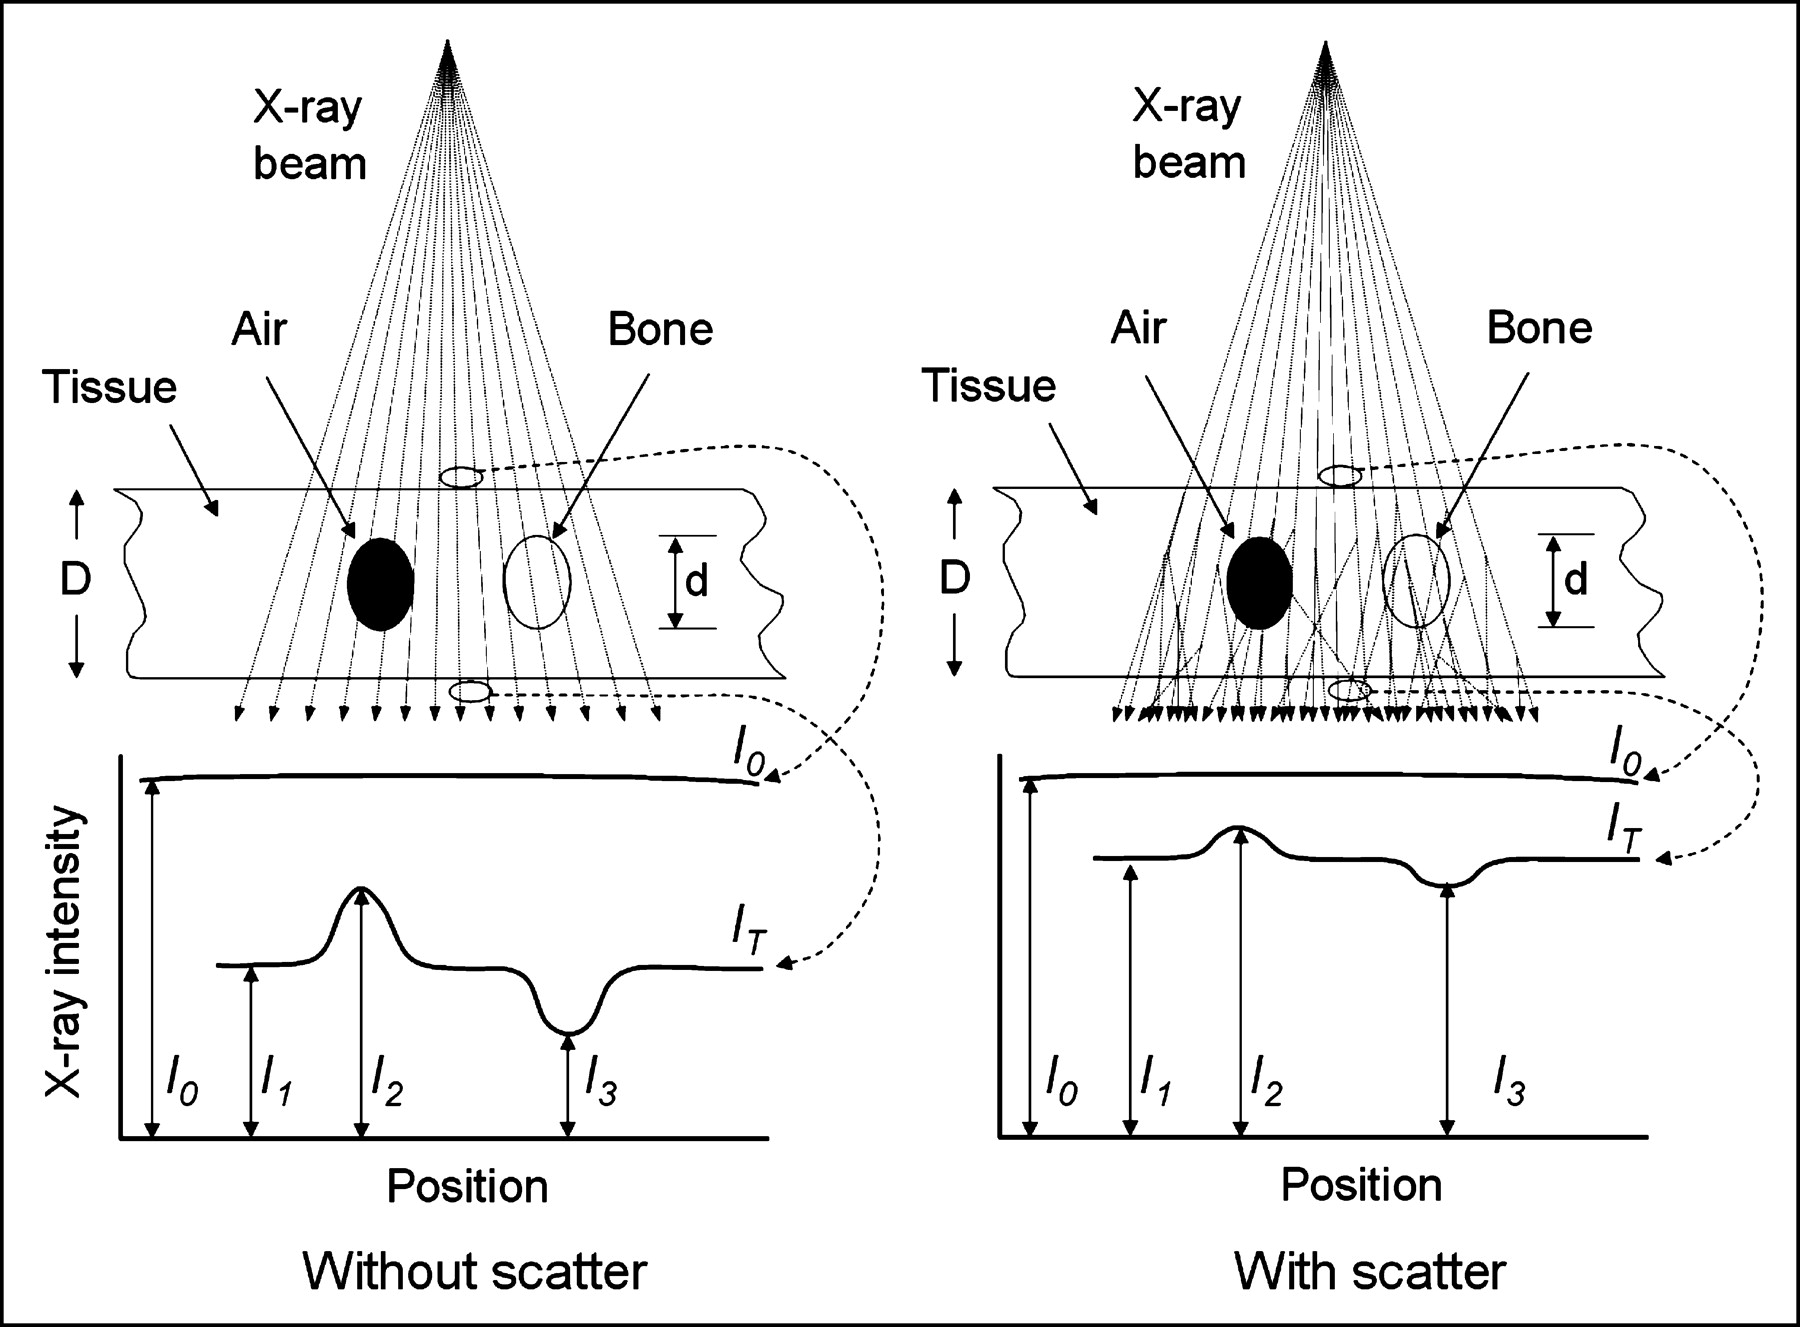
- FIGURE 8.
Ideal projection radiograph is representation of transmitted primary x-ray fluence from point source through object and incident on detector, as depicted on left for a uniform incident fluence, I0, and transmitted I1, I2, and I3 fluences through tissue, air, and bone, respectively. Subject contrast is difference in signals of an object to background—for example, (I1 − I2)/I1 and (I1 − I3)/I1. On right is typical situation in presence of scatter, demonstrating loss of subject contrast and smaller difference between incident and transmitted radiation intensity.
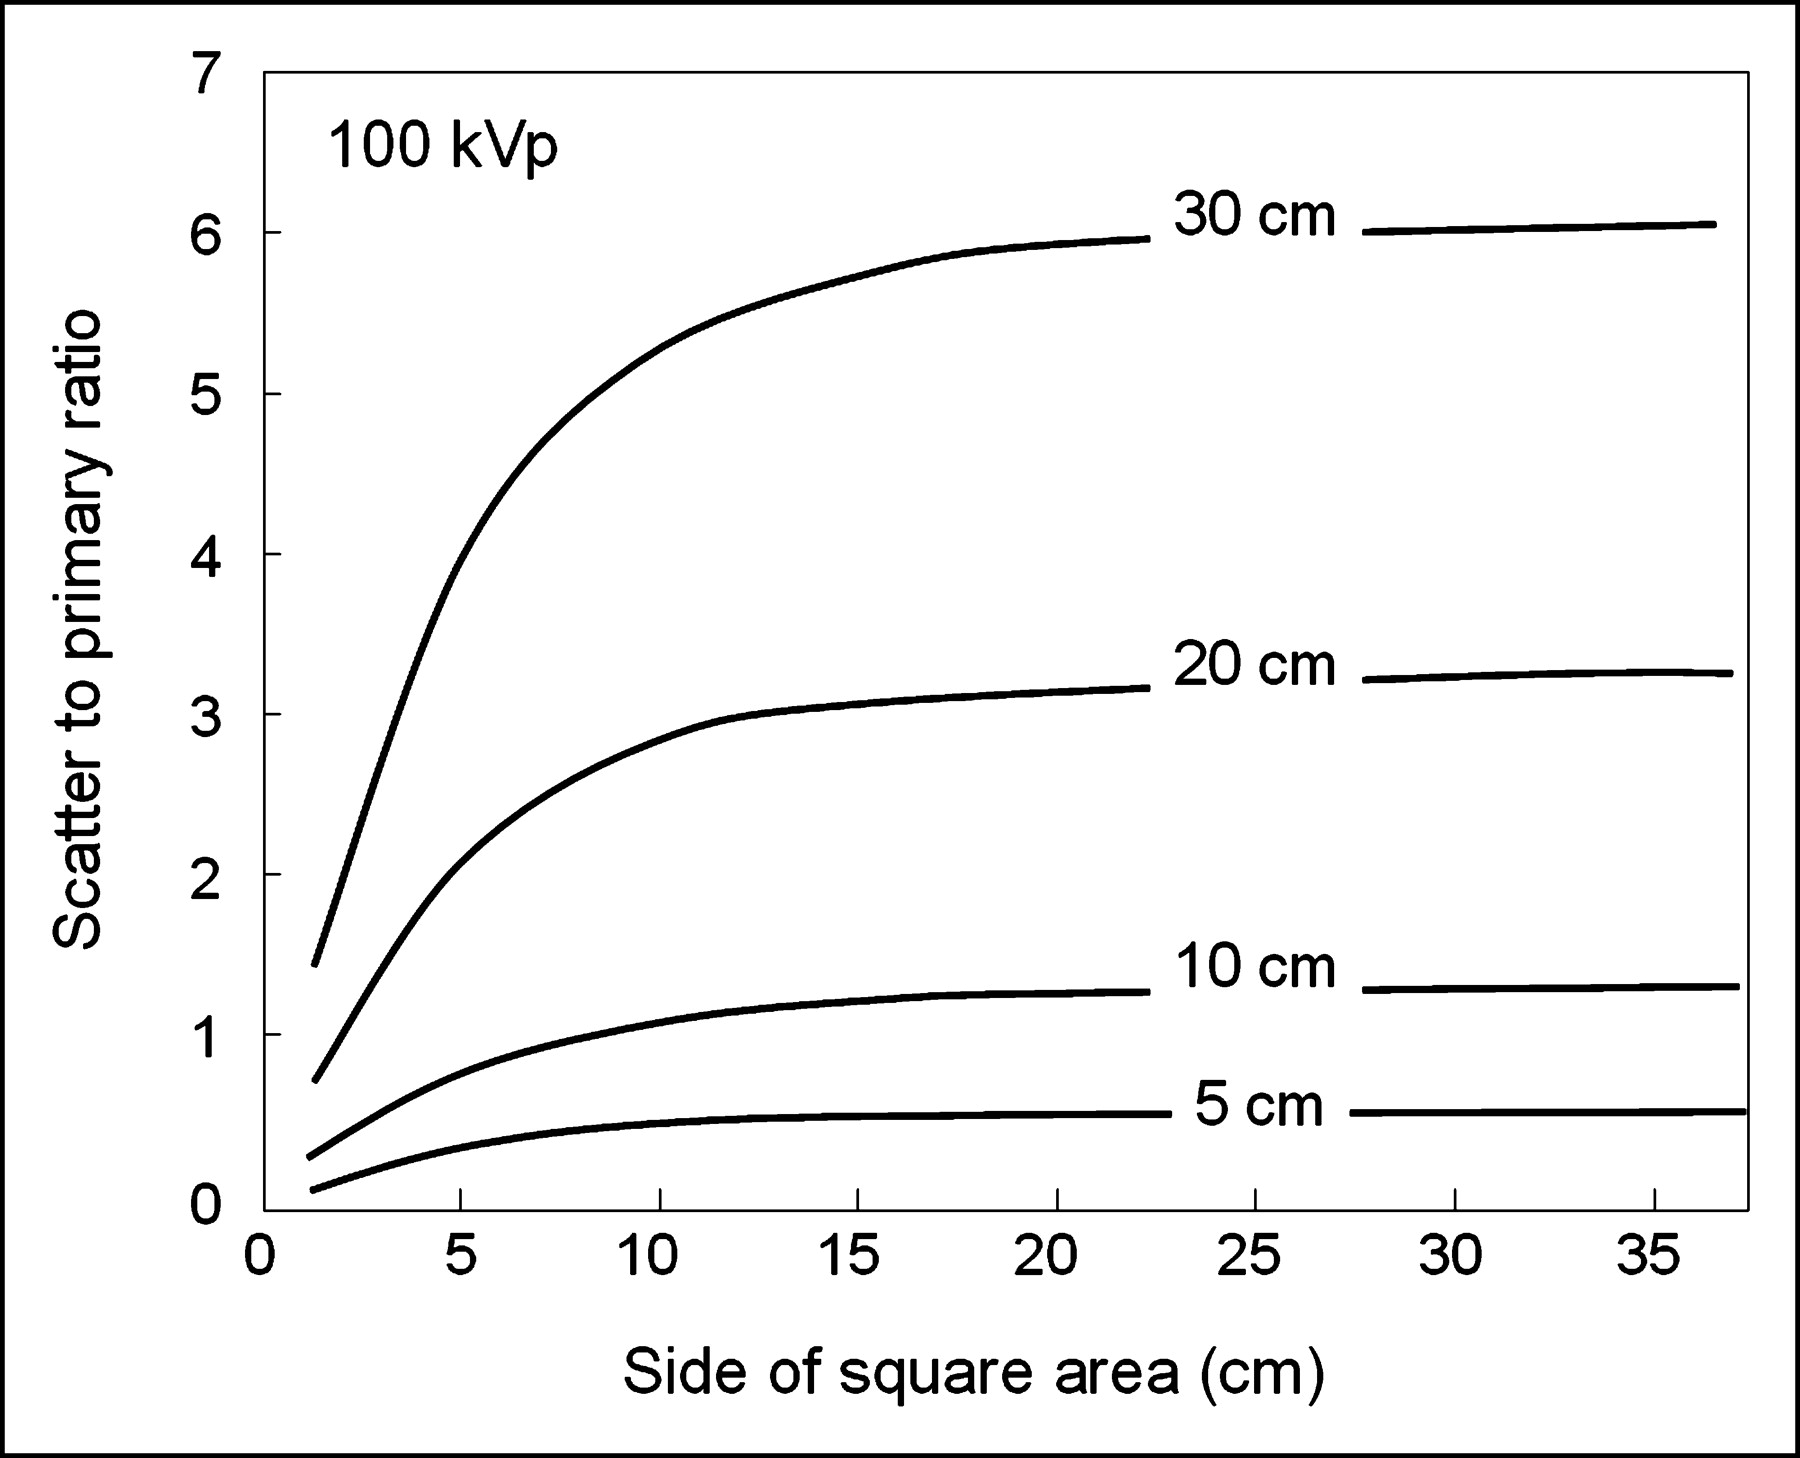
- FIGURE 9.
Scatter-to-primary ratio at 100 kVp as function of area irradiated for 5-, 10-, 20-, and 30-cm thicknesses.
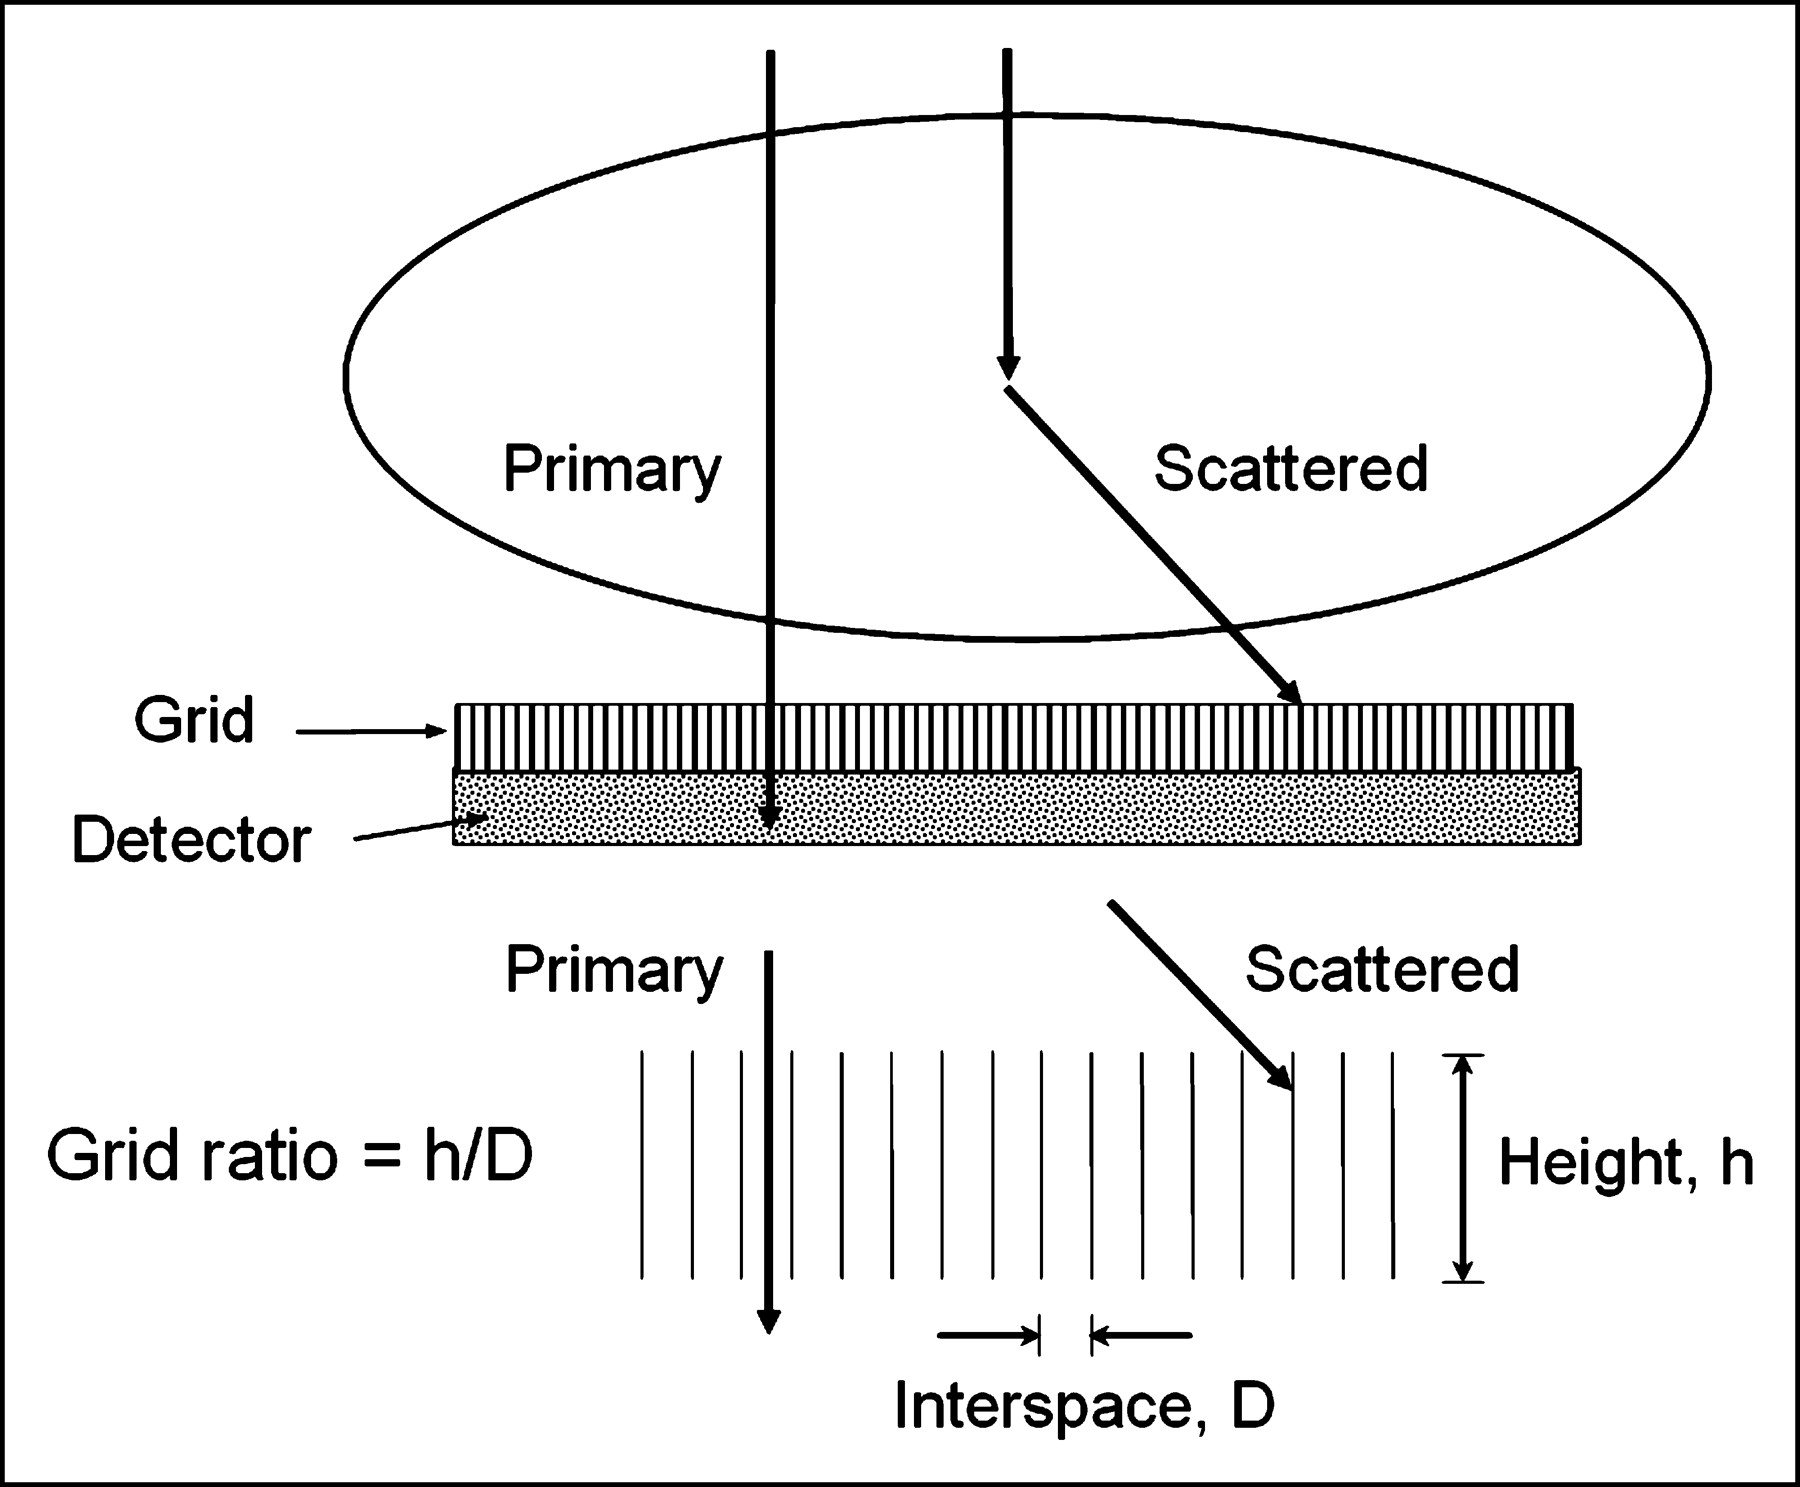
- FIGURE 10.
Antiscatter grid, placed between patient and detector, is typically comprised of thin parallel lead strips separated by low-attenuation interspaces, as shown by cross-section illustration. Scatter is preferentially absorbed in lead strips, whereas primary x-rays will be preferentially transmitted to detector. Grid ratio is measurement of height of lead strips, h, to interspace distance, D. In general, a higher grid ratio achieves better scatter rejection but also causes a higher loss of primary radiation. The penalty of using a grid, known as the Bucky factor, is increase in dose to patient for a given x-ray fluence to detector when grid is used compared with when it is not used. The benefit of using a grid is preservation of subject contrast and improved image quality.
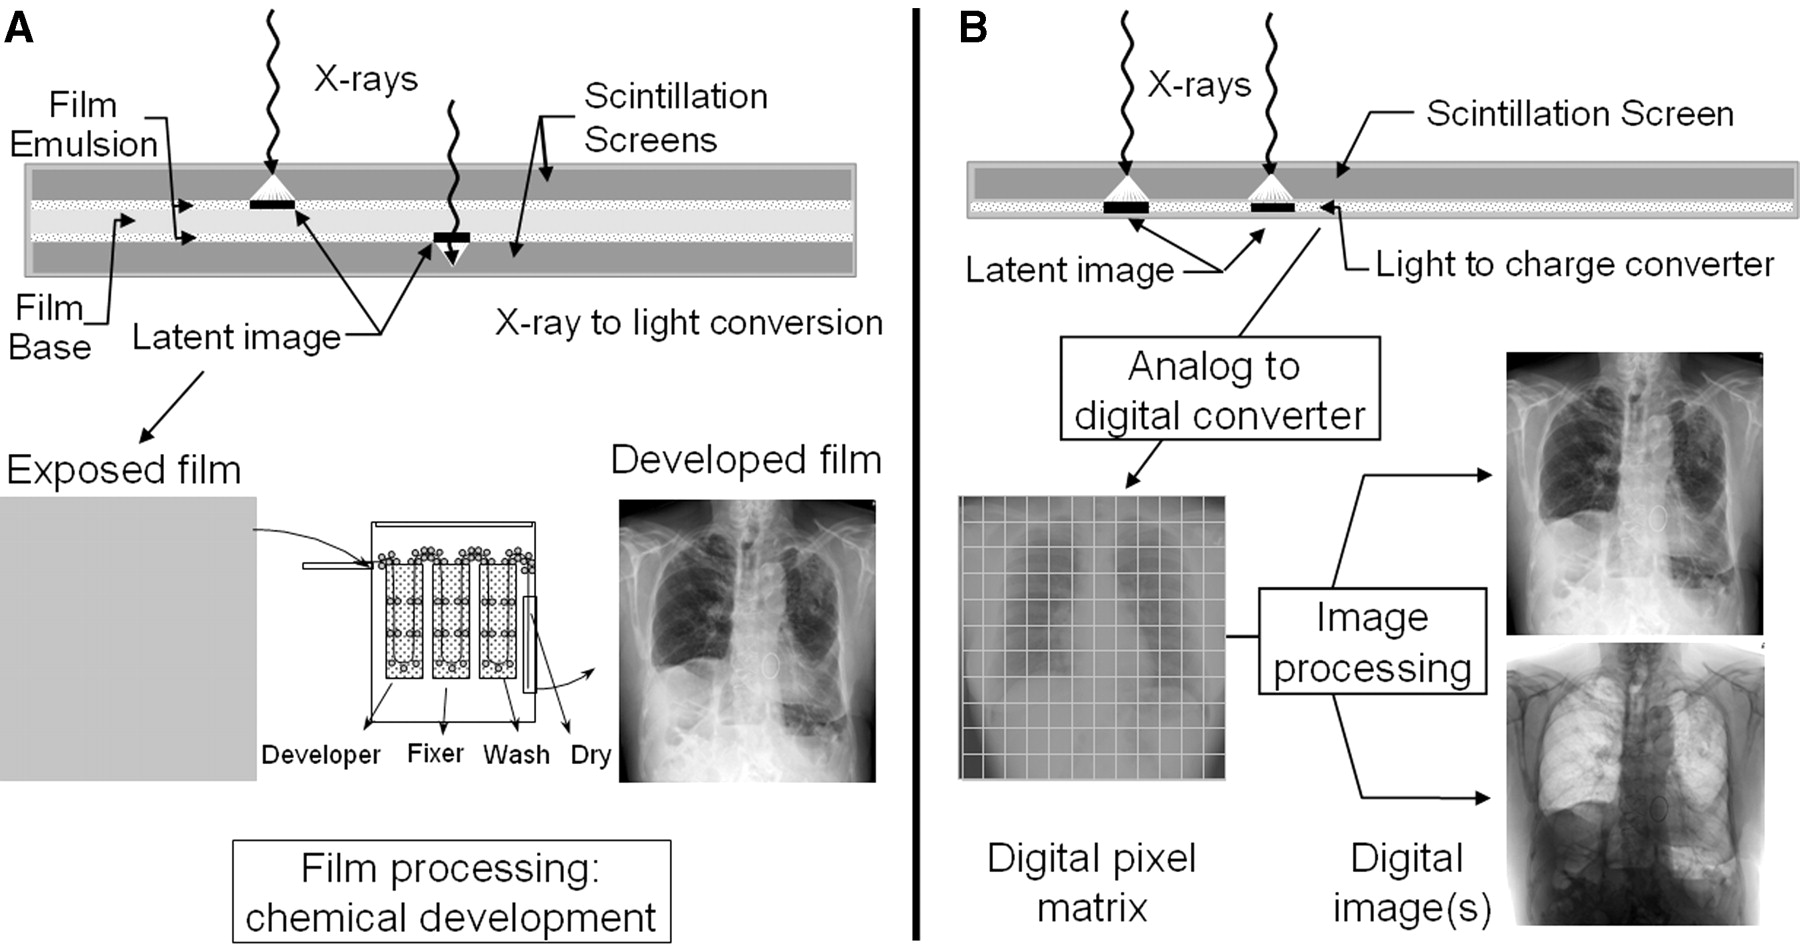
- FIGURE 11.
Analog (A) and digital (B) x-ray image acquisition is depicted. In each situation, x-rays transmitted through patient and grid are detected and converted into a useful signal. Conventional analog image acquisition uses a screen-film cassette, x-rays are converted to light, latent image centers are created on film emulsion, and chemical processing renders the final output image. Because of limited latitude of the film, correct x-ray exposure during acquisition is essential. Digital image acquisition uses a detector with wide-exposure latitude to produce electronic signals that are easily converted to equivalent digital numbers by analog-to-digital converter. Once in electronic form, image processing corrects for under- or overexposure conditions and provides viewing flexibility with computer workstation.
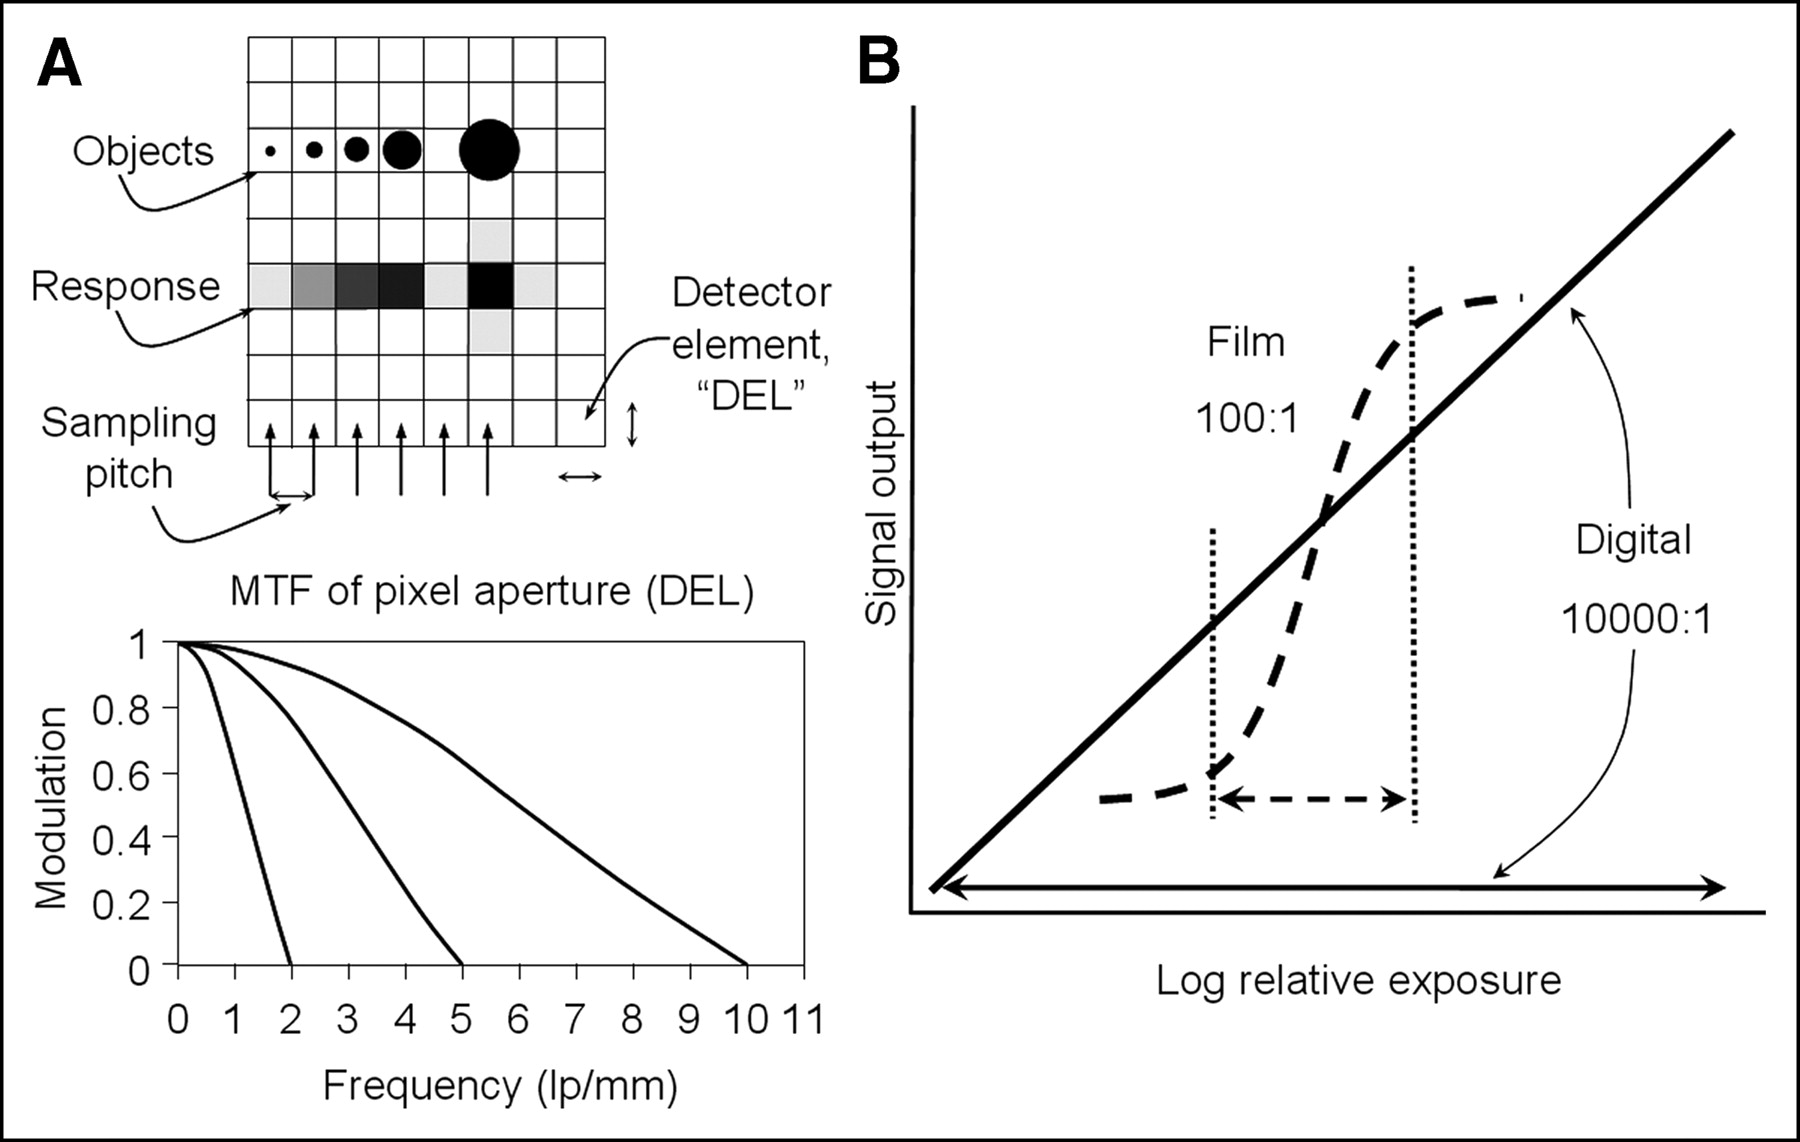
- FIGURE 12.
(A) Digital x-ray image acquisition causes loss of spatial resolution by spread of object information smaller than detector element size, as shown by progressive object sizes of constant signal value and corresponding gray-level rendition. Signal modulation is depicted by MTF curves for 3 different element sizes used in diagnostic imaging. (B) Exposure latitude of film is narrow because of nonlinear response of film emulsion to chemical processing. Exposures below or above linear range of sigmoid response will not generate contrast in image. Digital detector has wide-exposure latitude, allowing various exposure levels, but image postprocessing is required to increase display contrast to appropriate level.
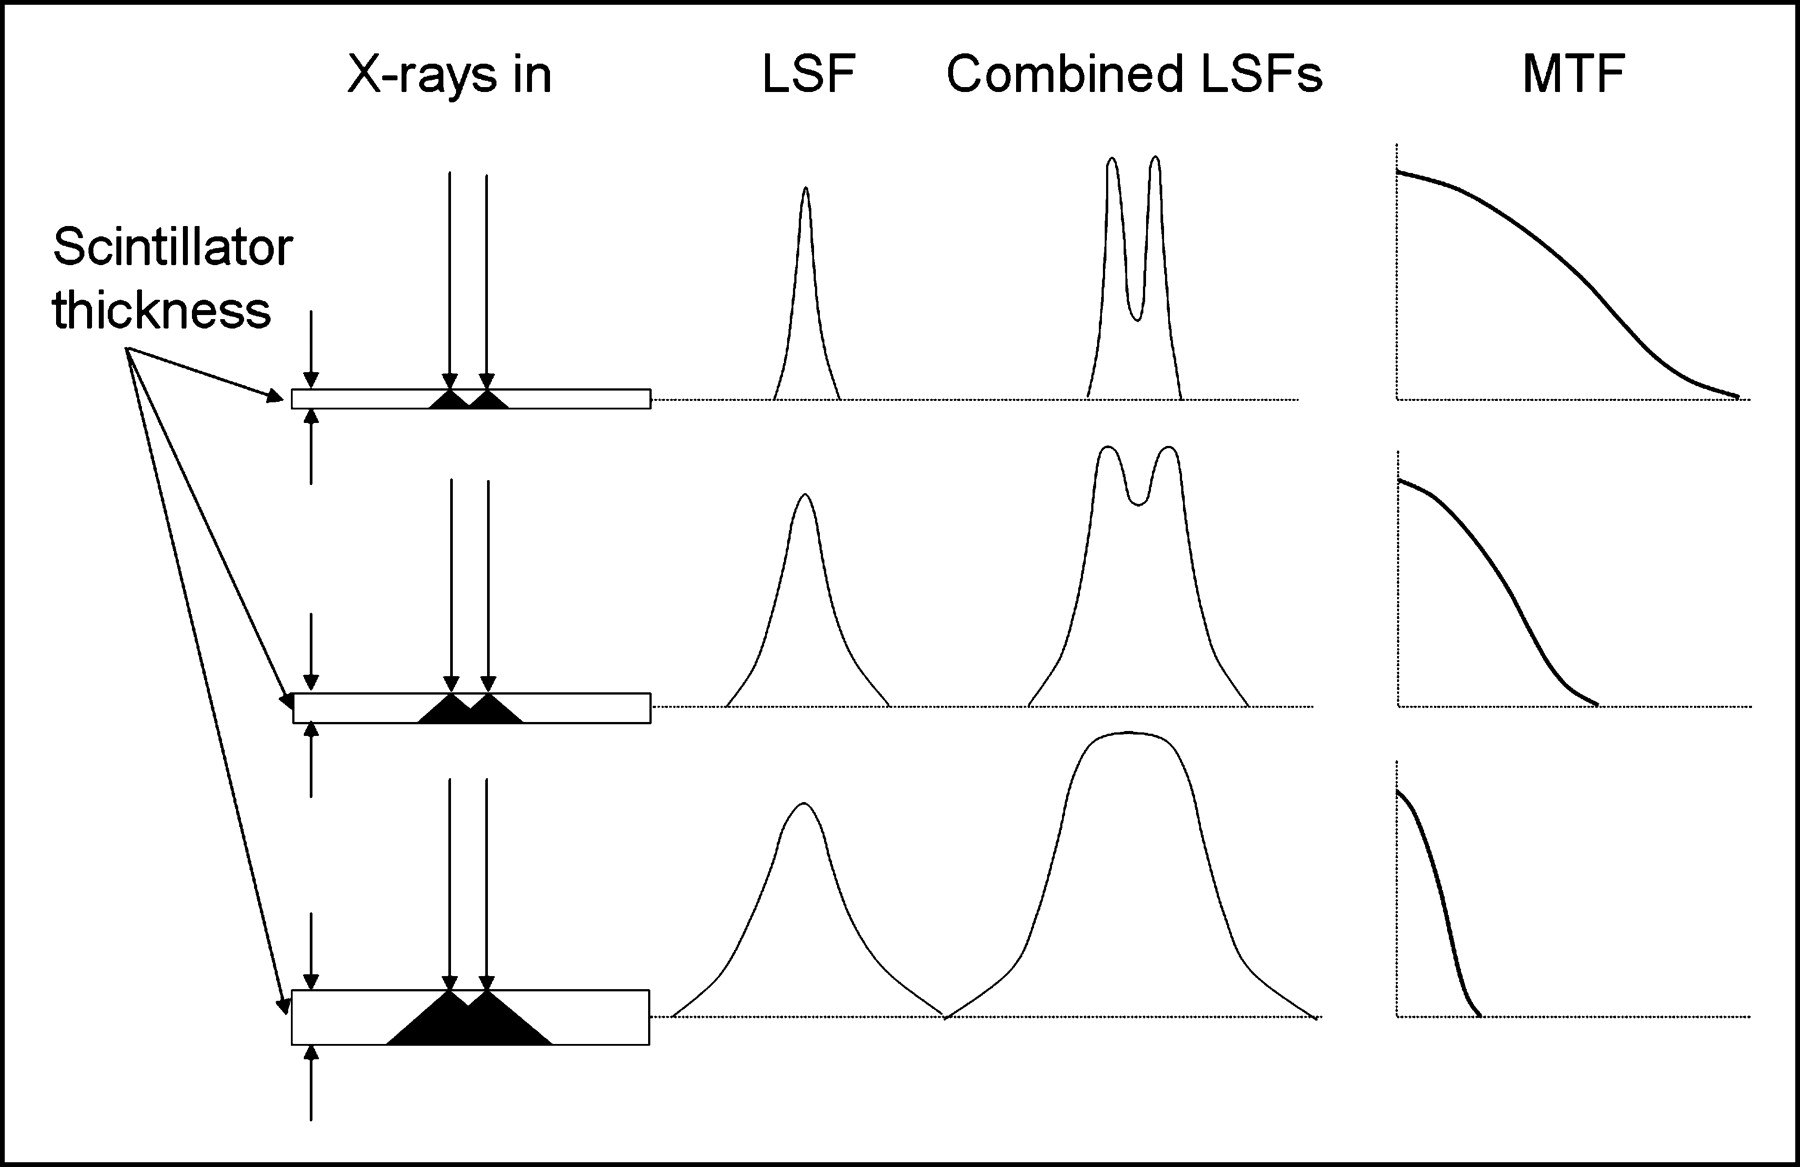
- FIGURE 13.
Spatial resolution degradations are caused by light spread in scintillator. Thin scintillator (top row) has small spread and correspondingly narrow LSF width with good spatial resolution, but poor x-ray detection efficiency. Thick scintillator produces large light spread distribution and broad LSF with poor spatial resolution but good x-ray detection efficiency. Combining LSF responses for x-rays spaced the same distance apart demonstrates how resolution is lost as scintillator thickness increases (Combined LSFs column), where x-axis is specified in units of distance (mm). MTF column shows inverse relationship of LSF and MTF. x-Axis for MTF is specified in units of inverse distance (mm−1).
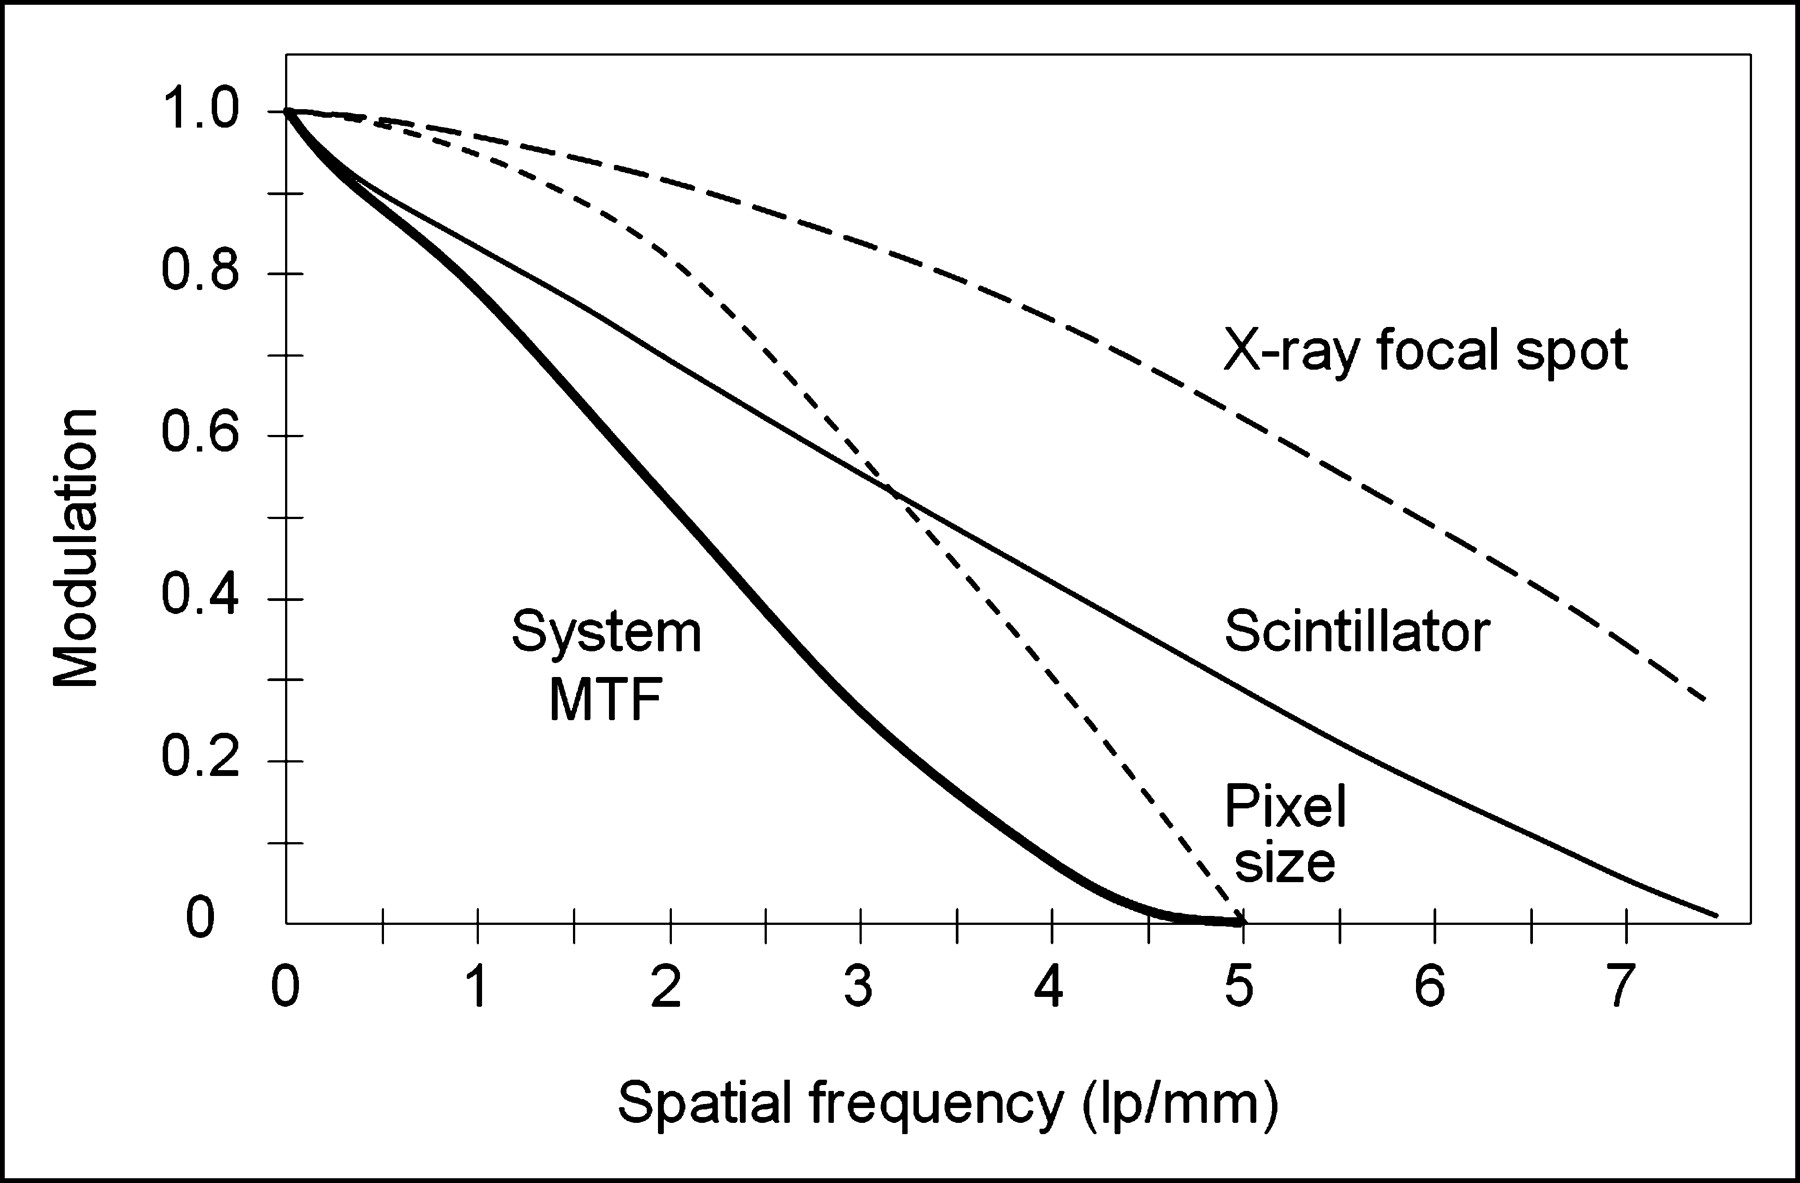
- FIGURE 14.
X-ray system is comprised of many components, each of which can degrade signal during conversion of x-rays into an image. In this example, modulation of signal is affected by focal spot blurring, pixel area averaging, and scintillator light spread as shown by individual MTF curves. Total composite system response is product of individual components at each spatial frequency. Note that total system output can be no better than the weakest component in imaging chain.


Tables
Process Interaction Z, E, ρ effects Comments Photoelectric absorption Photon energy > electron binding energy, photon absorbed, electron ejected from shell with kinetic energy equal to Ephoton − EBE τ ∝ Z3/E3 Atom is ionized; high imparted energy; characteristic radiation is be released; generates maximum differential signal Rayleigh scattering Photon interacts with bound atomic electron without ionization; photon is released in different direction without loss of energy σR ∝ 1/E1.2 No energy absorption occurs; photons mainly scattered in forward direction Compton scattering Photon interacts with “free” electron, ionizes atom; energy of incident photon shared with scattered photon and recoil electron σ ∝ ρ σ ∝ E0* σ ∝ 1/E† Displaced electron energy is absorbed locally; interaction produces attenuation and partial absorption Pair production Photon energy > 1.02 MeV interacts with nucleus and conversion of energy to e−–e+ charged particles; e+ subsequently annihilates into two 511-keV photons π ∝ (E − 1.02 MeV) × Z Probability of interaction increases with increasing energy, unlike other processes


