


Article Figures & Data
Figures
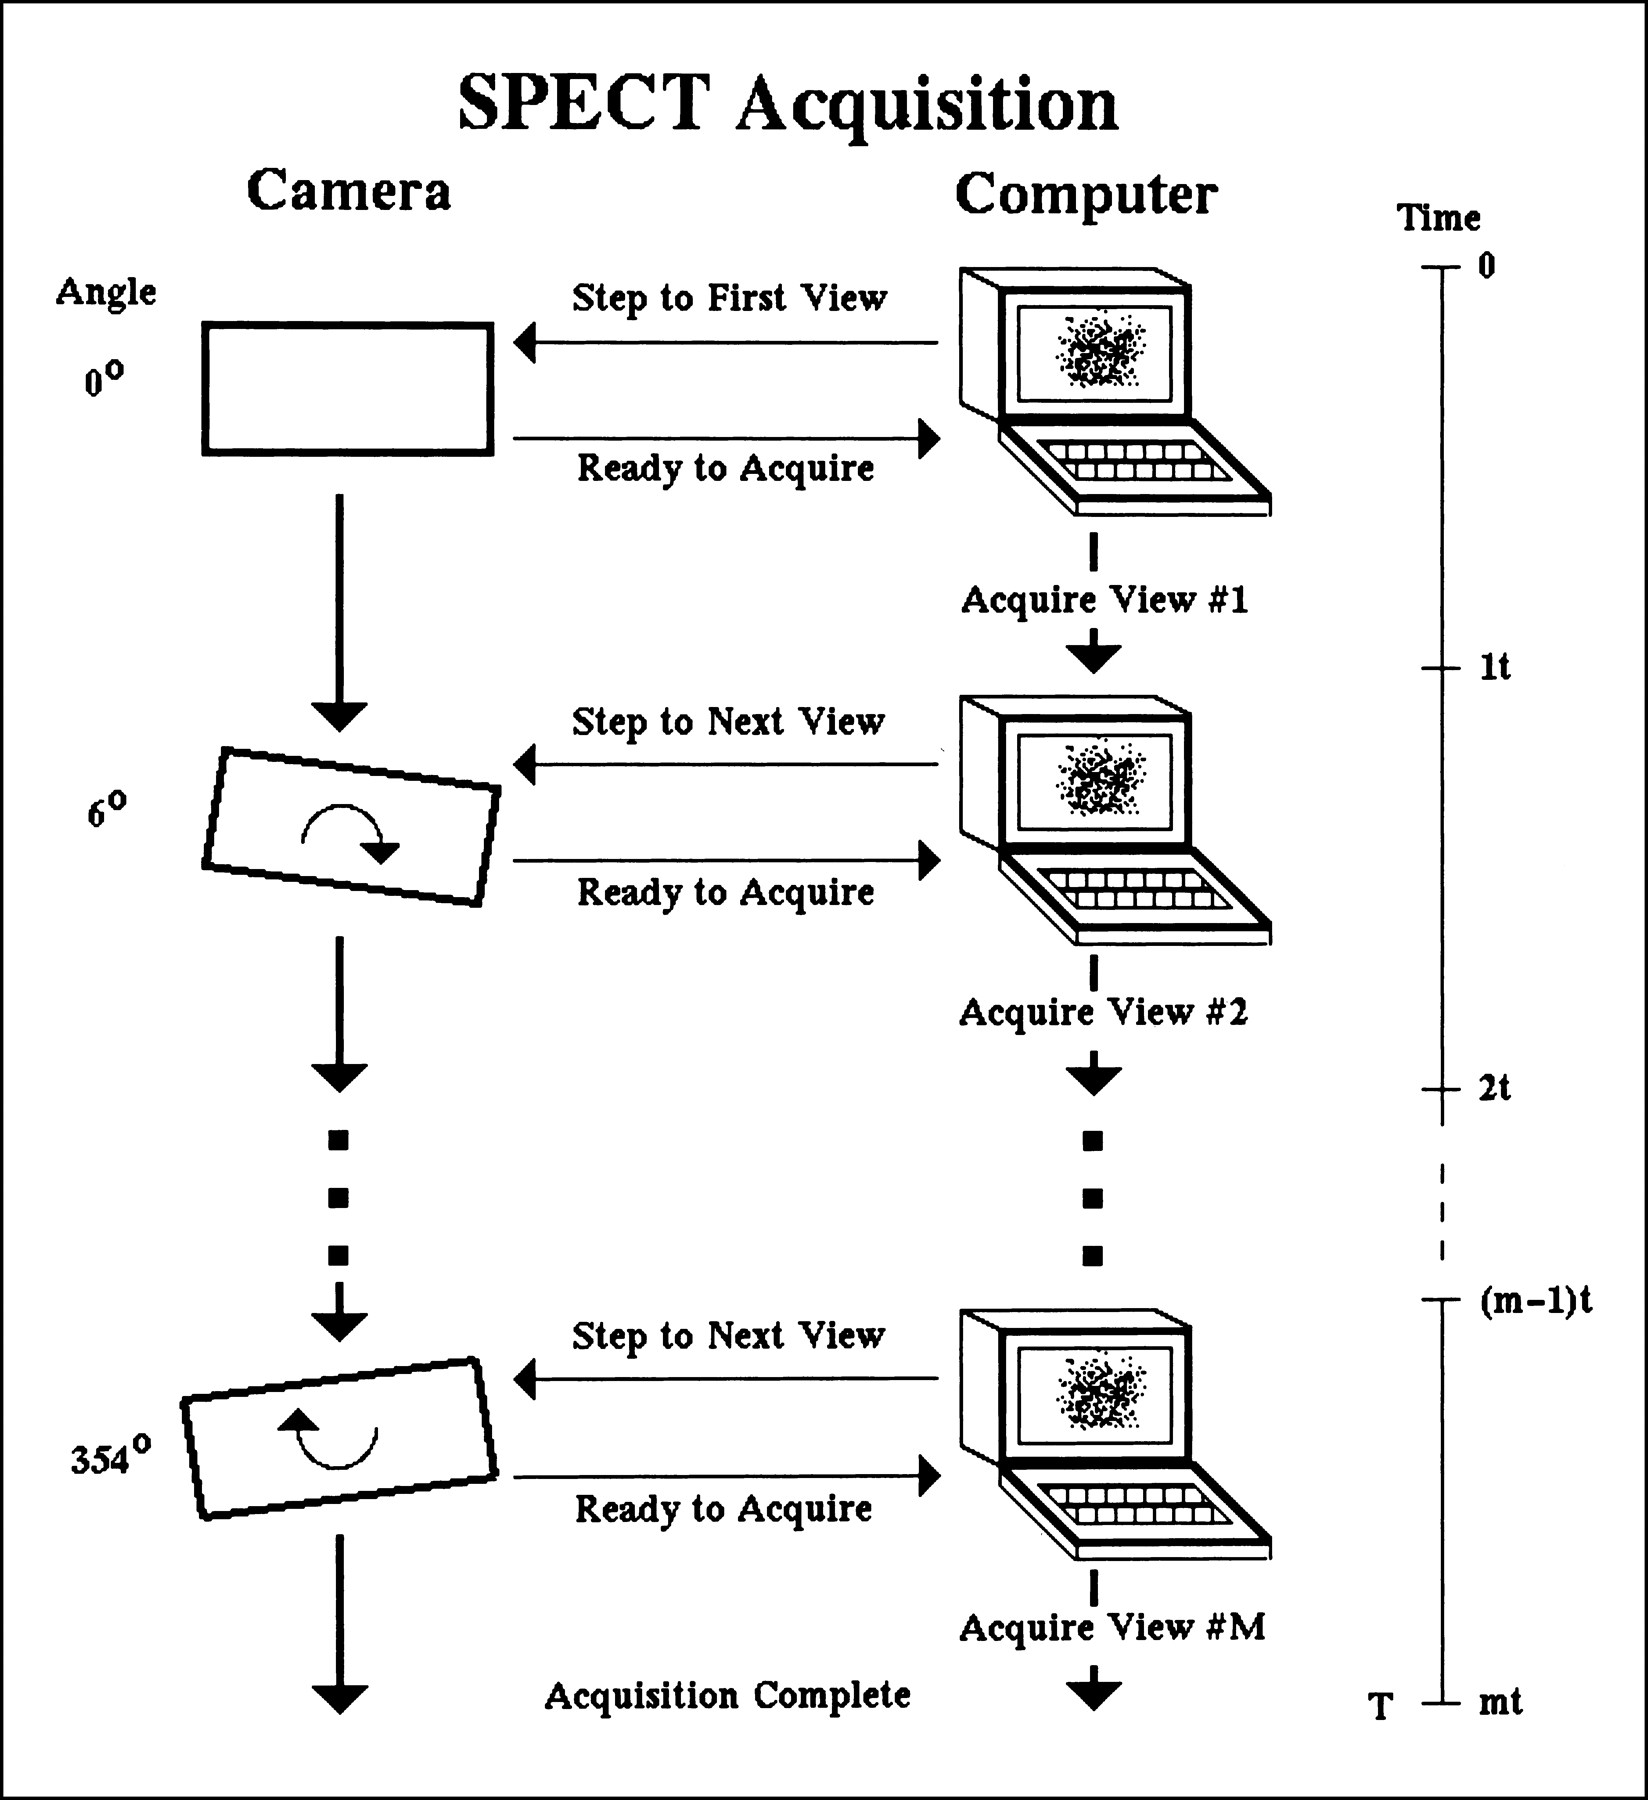
- FIGURE 1.
Schematic diagram of SPECT data acquisition. For each projection view, the computer sends a message to the gamma camera to step to the next viewing angle and, after the camera sends a message back to the computer that it is ready to acquire, the computer acquires the projection image at that angle for a specified time. The actual time t required for each view is the sum of the camera step time plus the projection image acquisition time. The total SPECT study acquisition time is T = mt, where m is the number of views acquired (in this case, 60 views over 360°, at 6° intervals).
- FIGURE 2.
(A) 64 × 64 and (B) 128 × 128 SPECT reconstructions of the central transverse slice from a 99mTc-HMPAO brain SPECT study. Equivalent reconstruction filtering was used (10th order Butterworth, 0.75 Nyquist for 64 × 64 and 0.375 Nyquist for 128 × 128). Not only is the resolution within each slice improved for 128 × 128, with equivalent smoothing, but the slices are only half as thick compared with 64 × 64, leading to improved resolution in the third dimension (i.e., between slices).
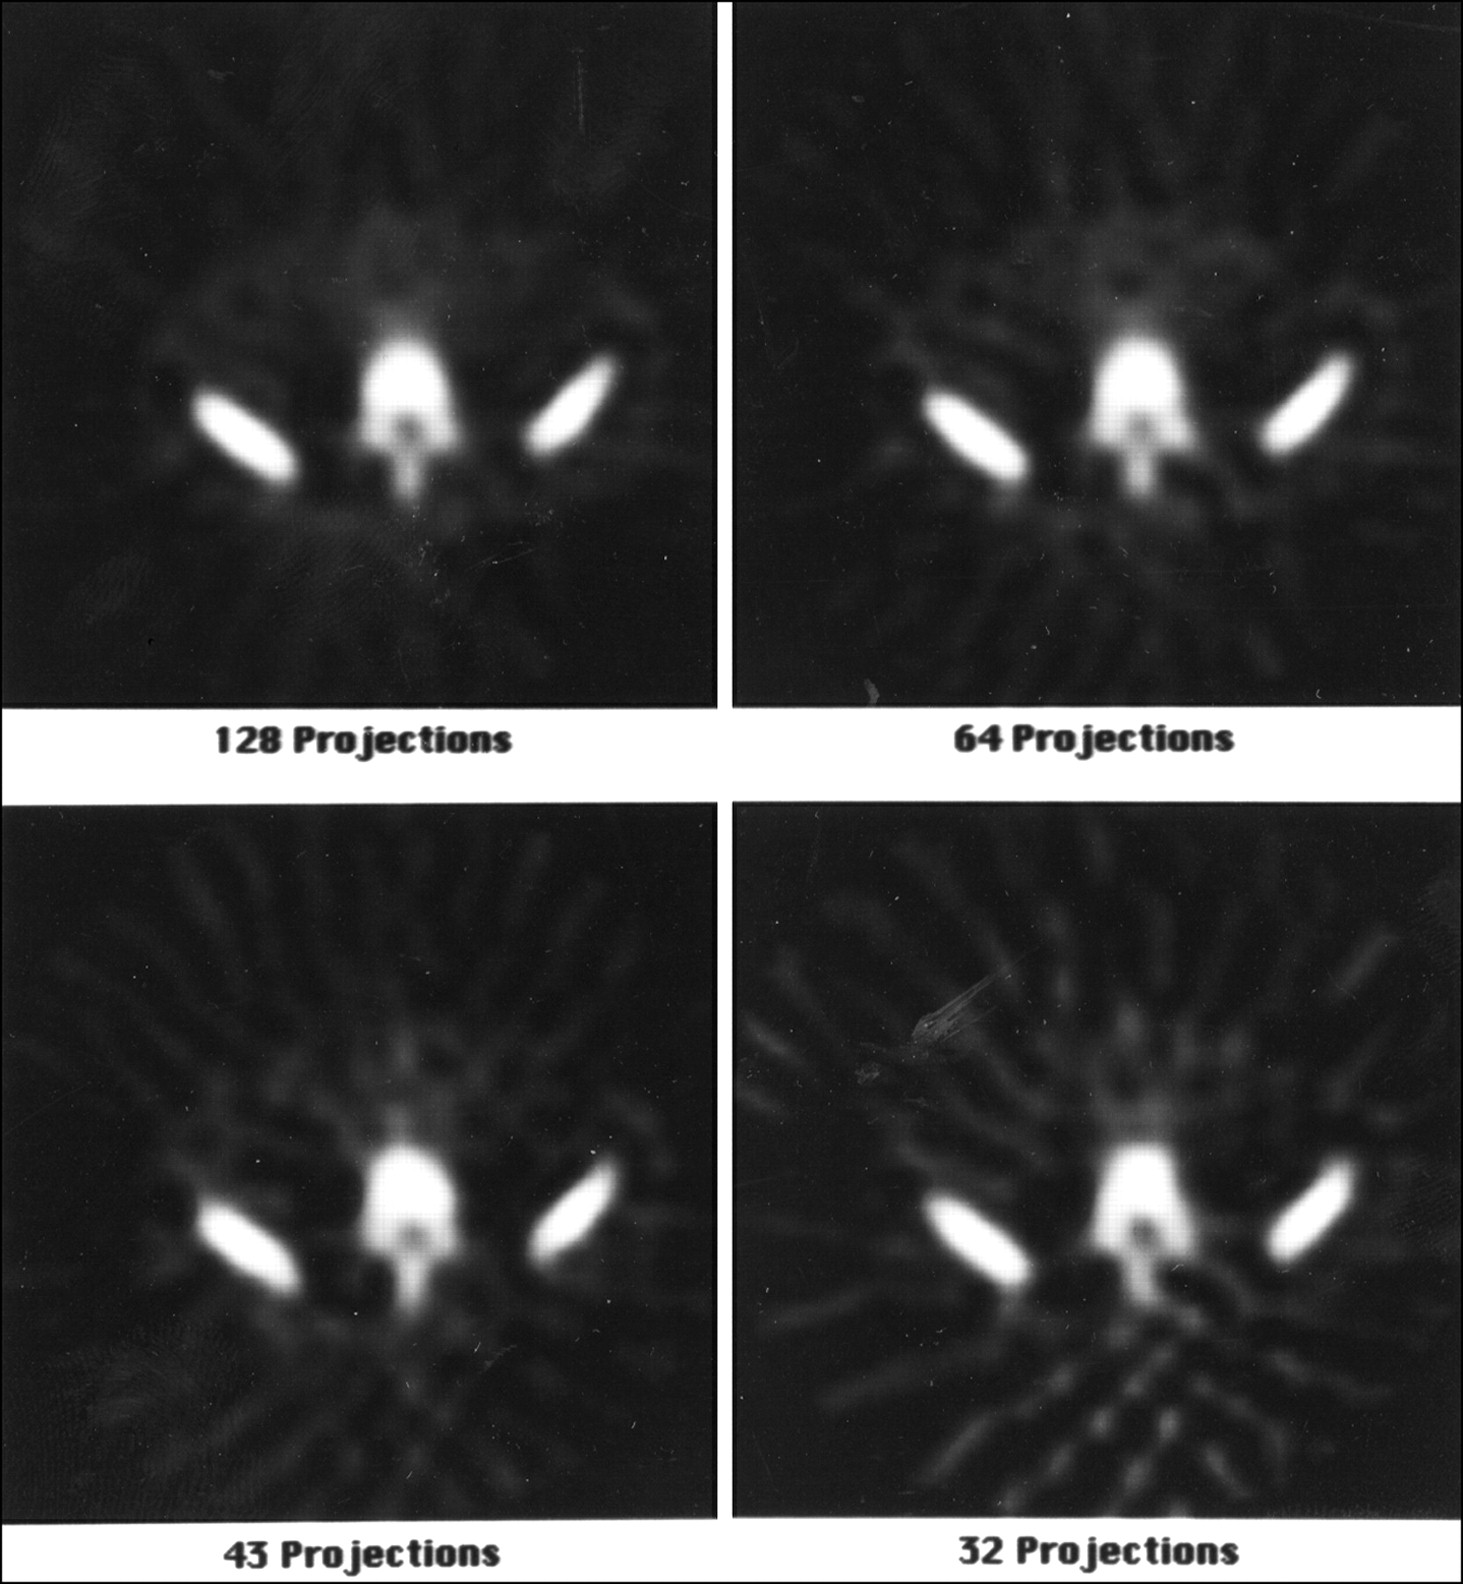
- FIGURE 3.
The effect of the number of angular samples on SPECT reconstruction. A transverse slice is shown, reconstructed from the identical 64 × 64, 128-view projection set and using the identical reconstruction filter (i.e., 0.7 Nyquist, eighth order Butterworth). The number of views used was all 128 (upper left), every second view, or 64 (upper right), every third view, or 43 (lower left) and every fourth view, or 32 (lower right). The 128- and 64-view reconstructions appear quite similar and artifact free. However, note the appearance of streak artifacts in the 43- and 32-view reconstructions (more prominent as the number of angular samples decreases).
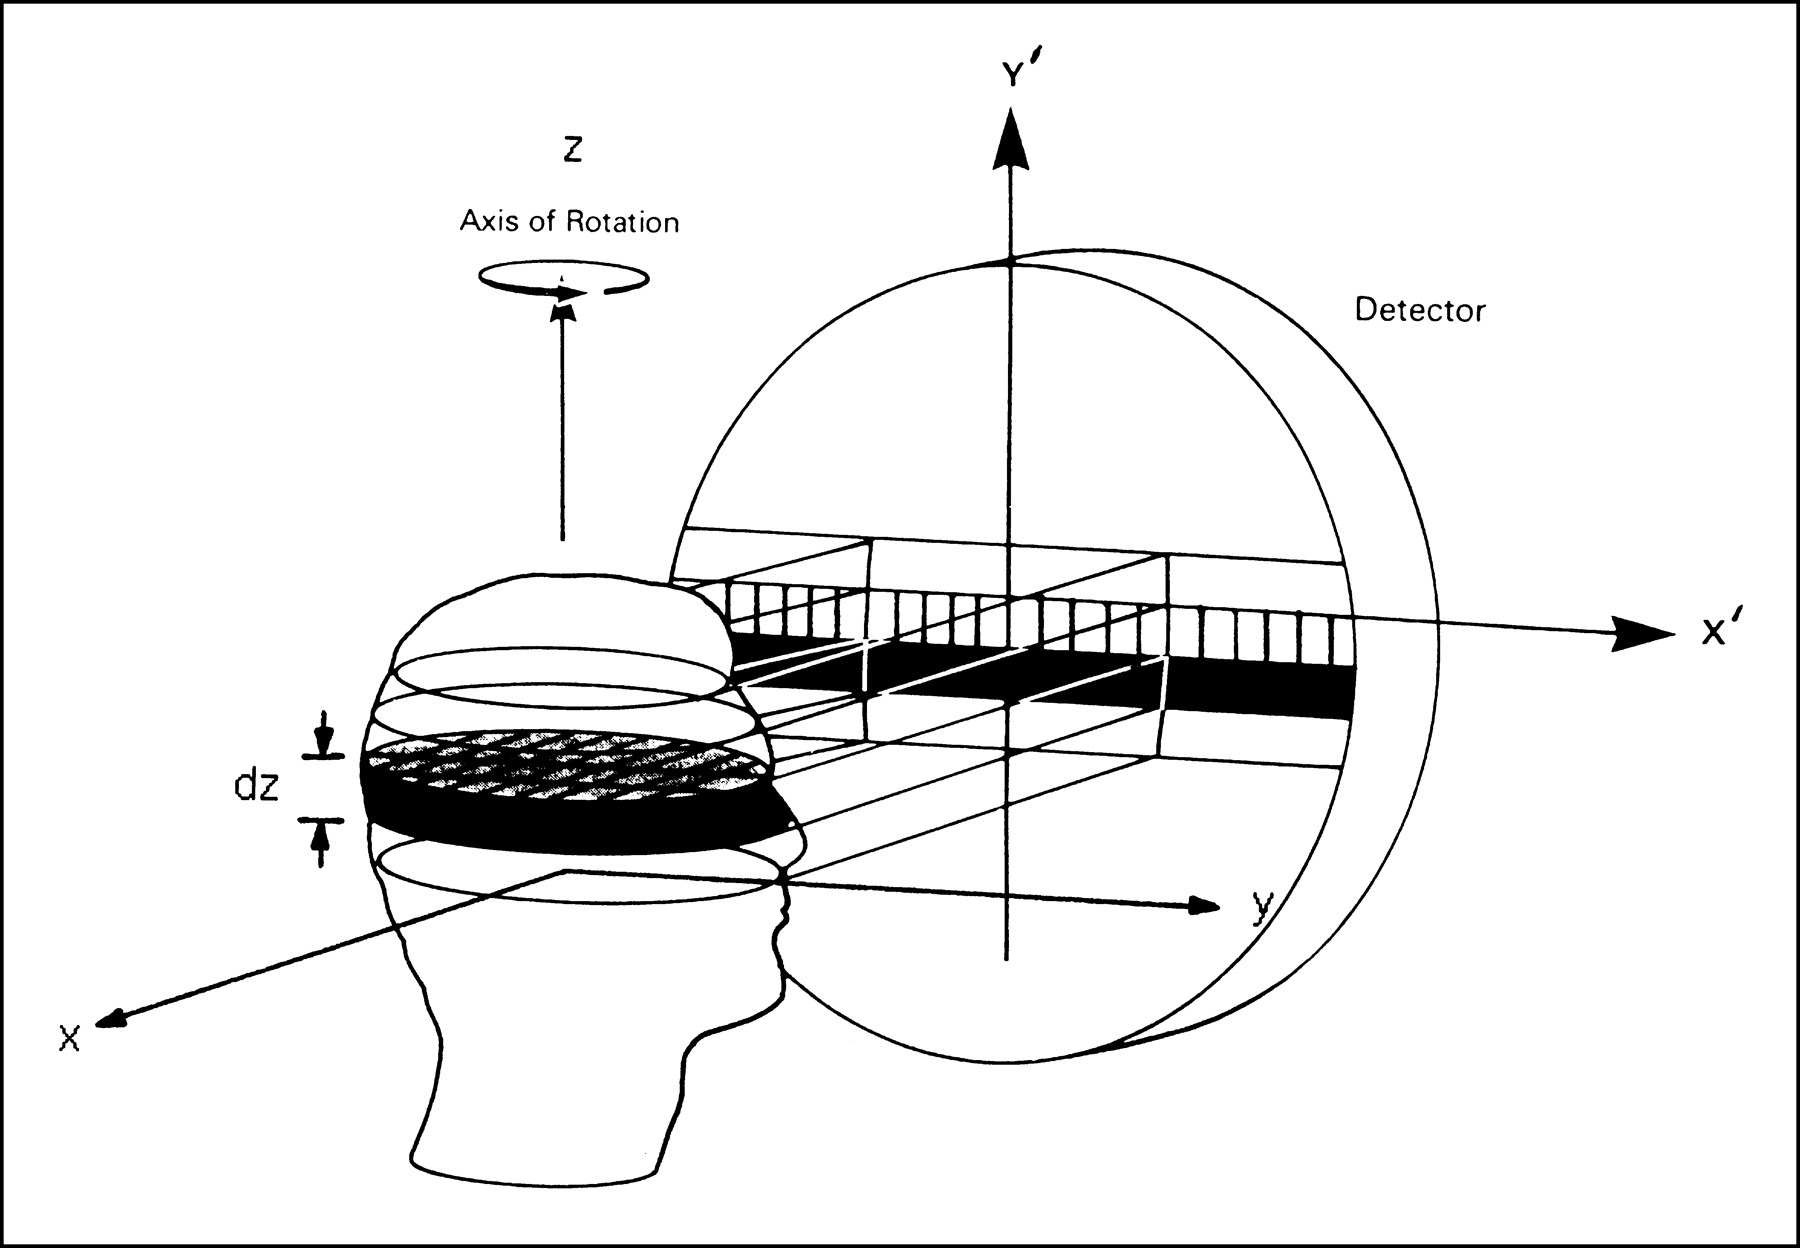
- FIGURE 4.
Diagram of SPECT projection imaging process (radon transform). The gamma camera views the three-dimensional (x,y,z) object as a stack of two-dimensional (x,y) slices of finite thickness dz. The volume elements, or voxels, within each slice (shaded area) are projected onto the gamma camera image as a horizontal row of picture elements, or pixels (along X′, at a particular height along Y′). Projection images at multiple angles around the axis of rotation (z) are acquired to reconstruct the three-dimensional object.
- FIGURE 5.
(A) Original, ideal frequency spectrum of a typical one-dimensional SPECT projection profile of an object. (B) Frequency spectrum, or modulation transfer function (MTF), of the SPECT imaging system (i.e., gamma camera/collimator). (C) White noise frequency spectra for 3 levels of Poisson statistical noise (1 equals the lowest level). (D) The original profile spectrum is multiplied by the SPECT system MTF and the 3 Poisson noise spectra are added, resulting in the 3 final, modified profile spectra. The spatial frequency where the object signal falls to the level of the noise increases as the noise level decreases (i.e., as the acquired counts increase).
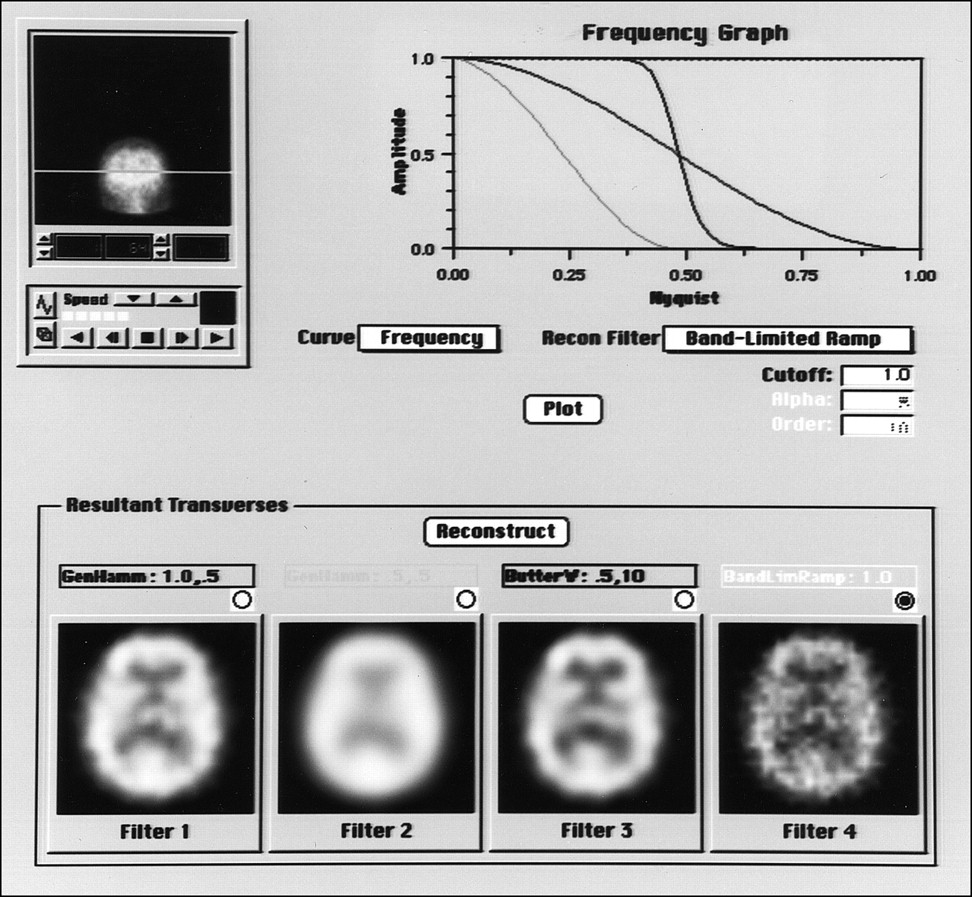
- FIGURE 6.
The effect of the choice of reconstruction filter on image noise/resolution. The 3 filters applied were (upper right): 1.0 Nyquist, 0.5 a Generalized Hamming (medium gray), 0.5 Nyquist, 0.5 a Generalized Hamming (light gray), and 0.5 Nyquist, 10th order Butterworth (dark gray). The corresponding reconstructions of a central slice from a 64 × 64 99mTc-HMPAO brain SPECT study (bottom, left to right) demonstrate the superiority of the Butterworth filter (much better resolution than the 0.5 Nyquist Hamming, yet both better resolution and less noise than the 1.0 Nyquist Hamming).
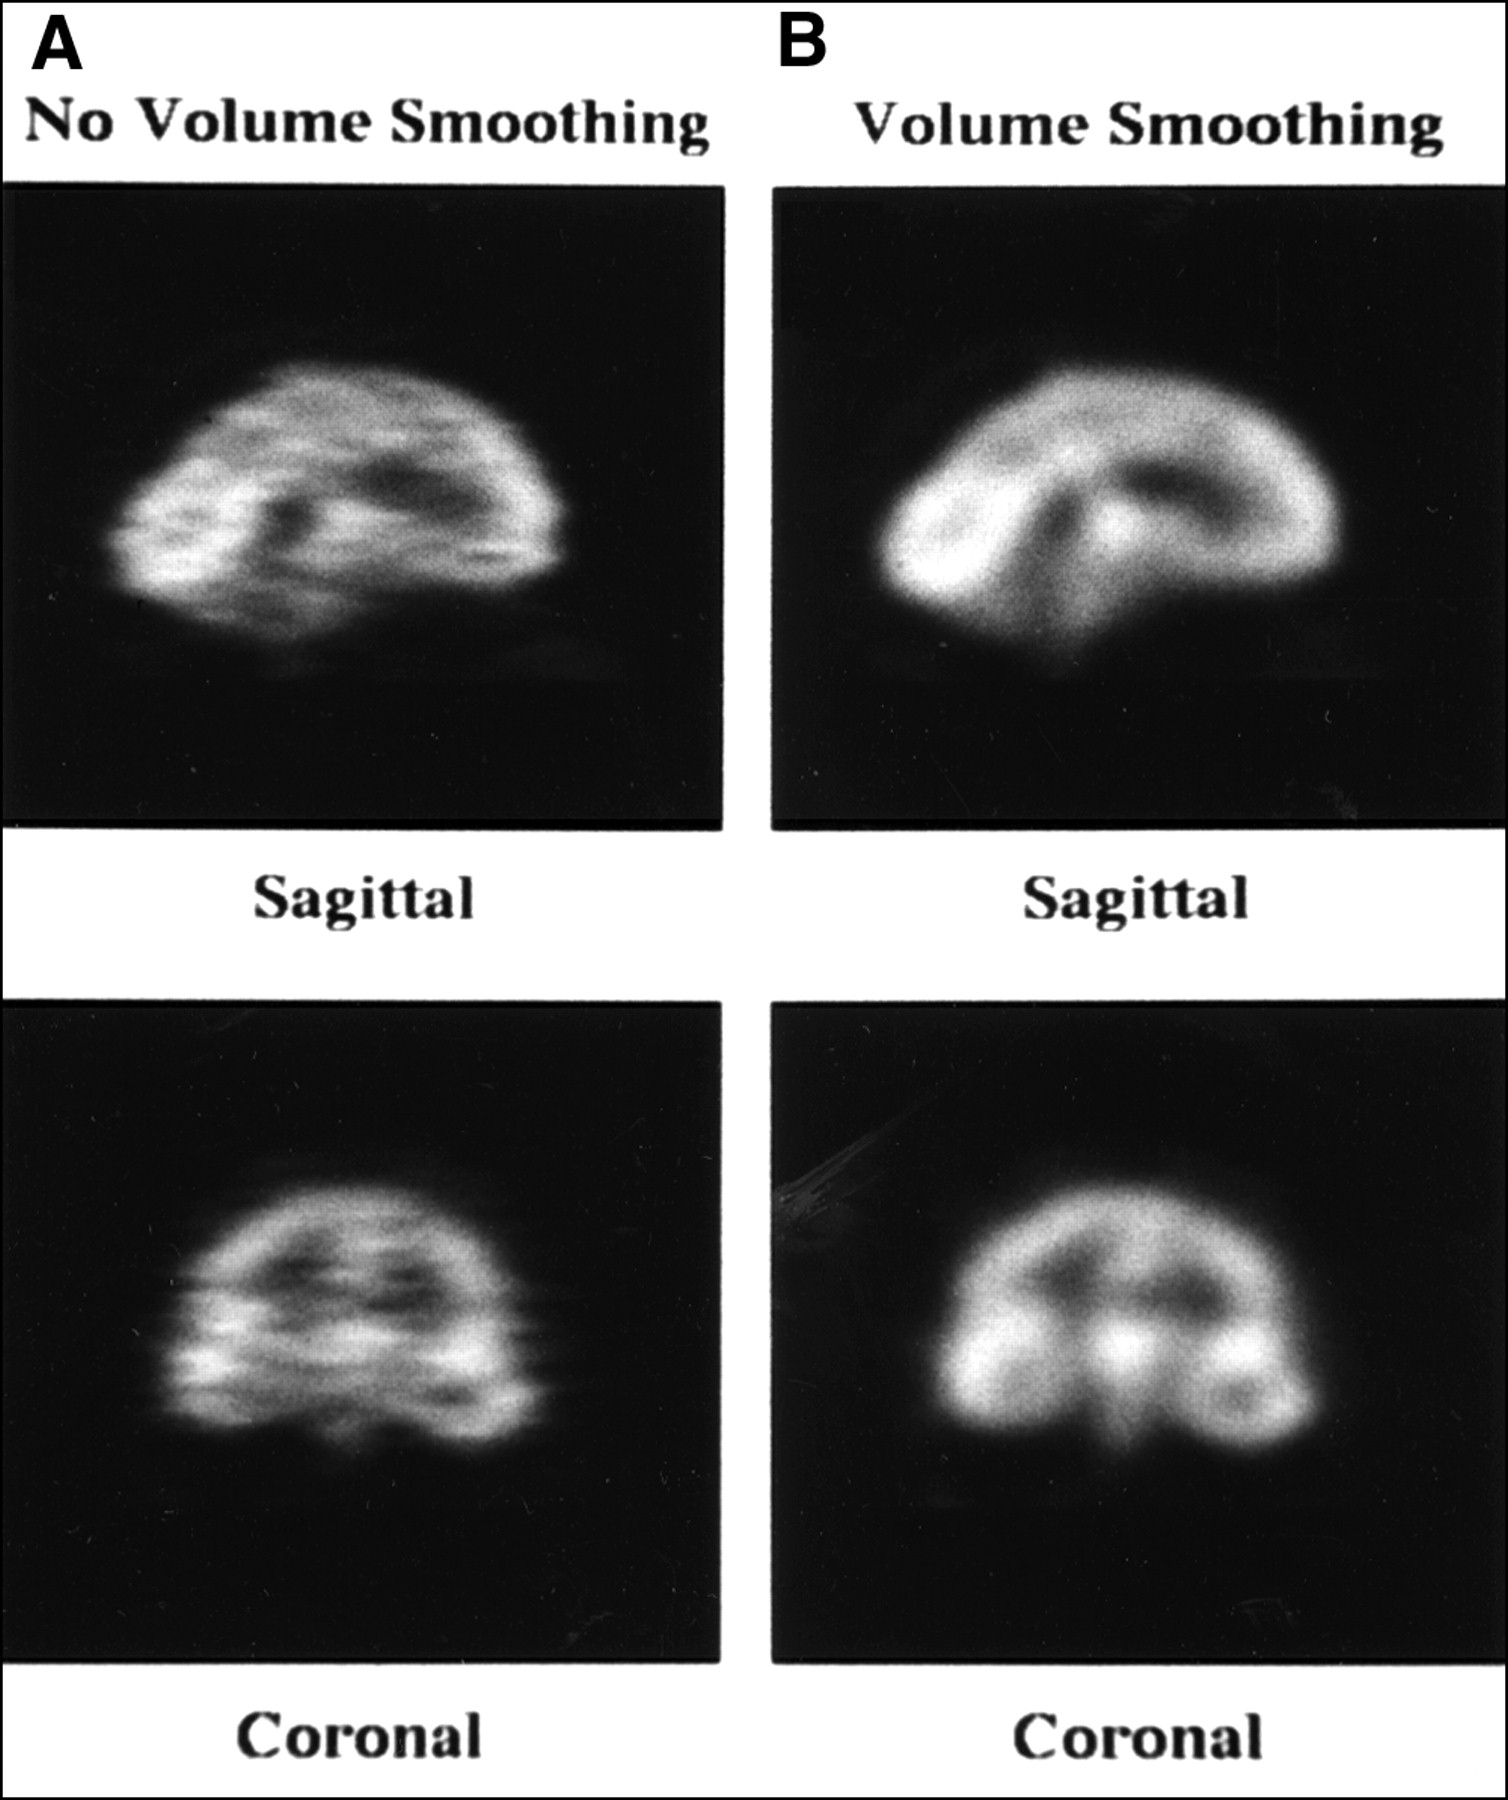
- FIGURE 7.
(A) Central sagittal and coronal slices without volume smoothing and (B) with volume smoothing, for a 128 × 128 99mTc-HMPAO brain SPECT study. A 0.3 Nyquist, 10th order Butterworth transverse reconstruction filter was applied to the transverse slices in A, and a 0.375 Nyquist, 10th order Butterworth volume smoothing filter was applied in B, such that the transverse slices had equivalent smoothness. Note the streaking between rows of pixels in A due to no filtering between transverse slices.
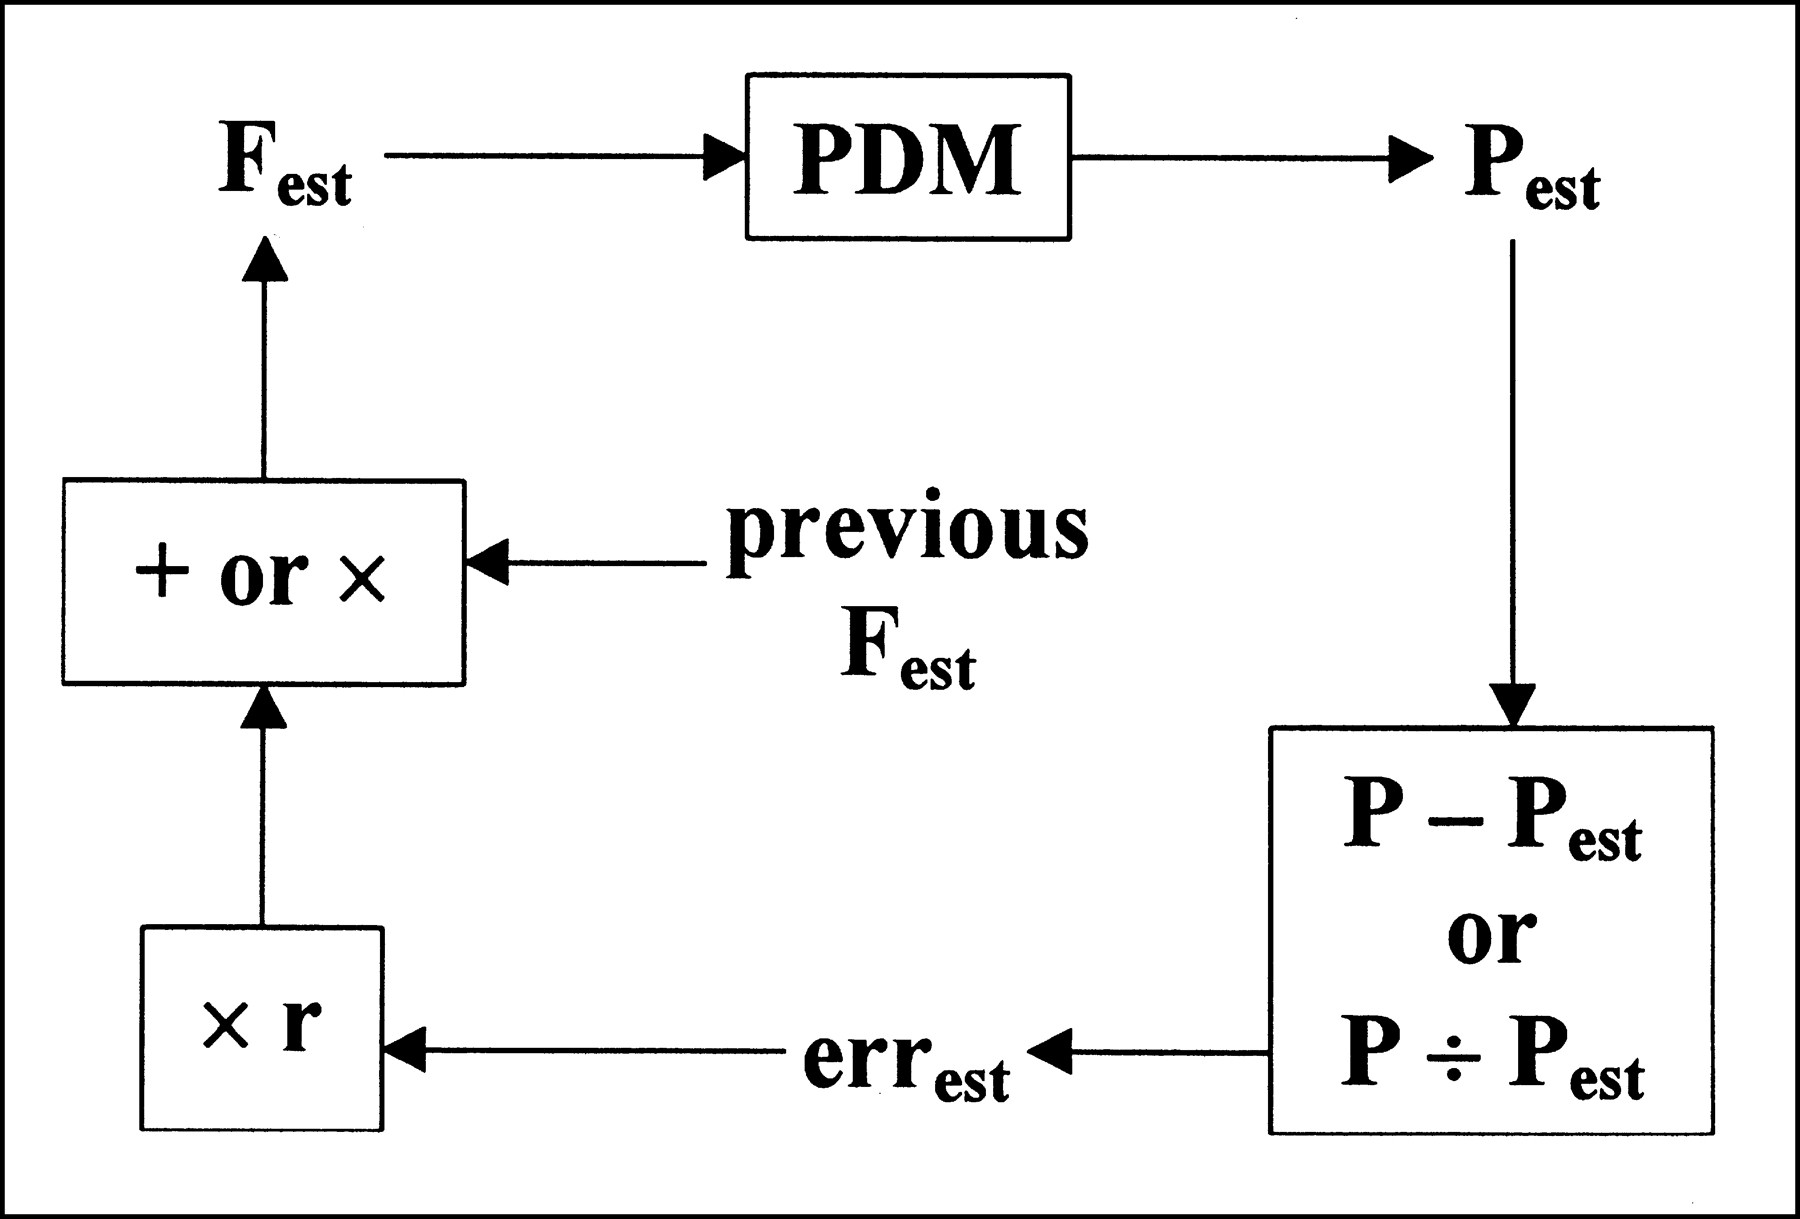
- FIGURE 8.
Graphical representation of the iterative reconstruction process.
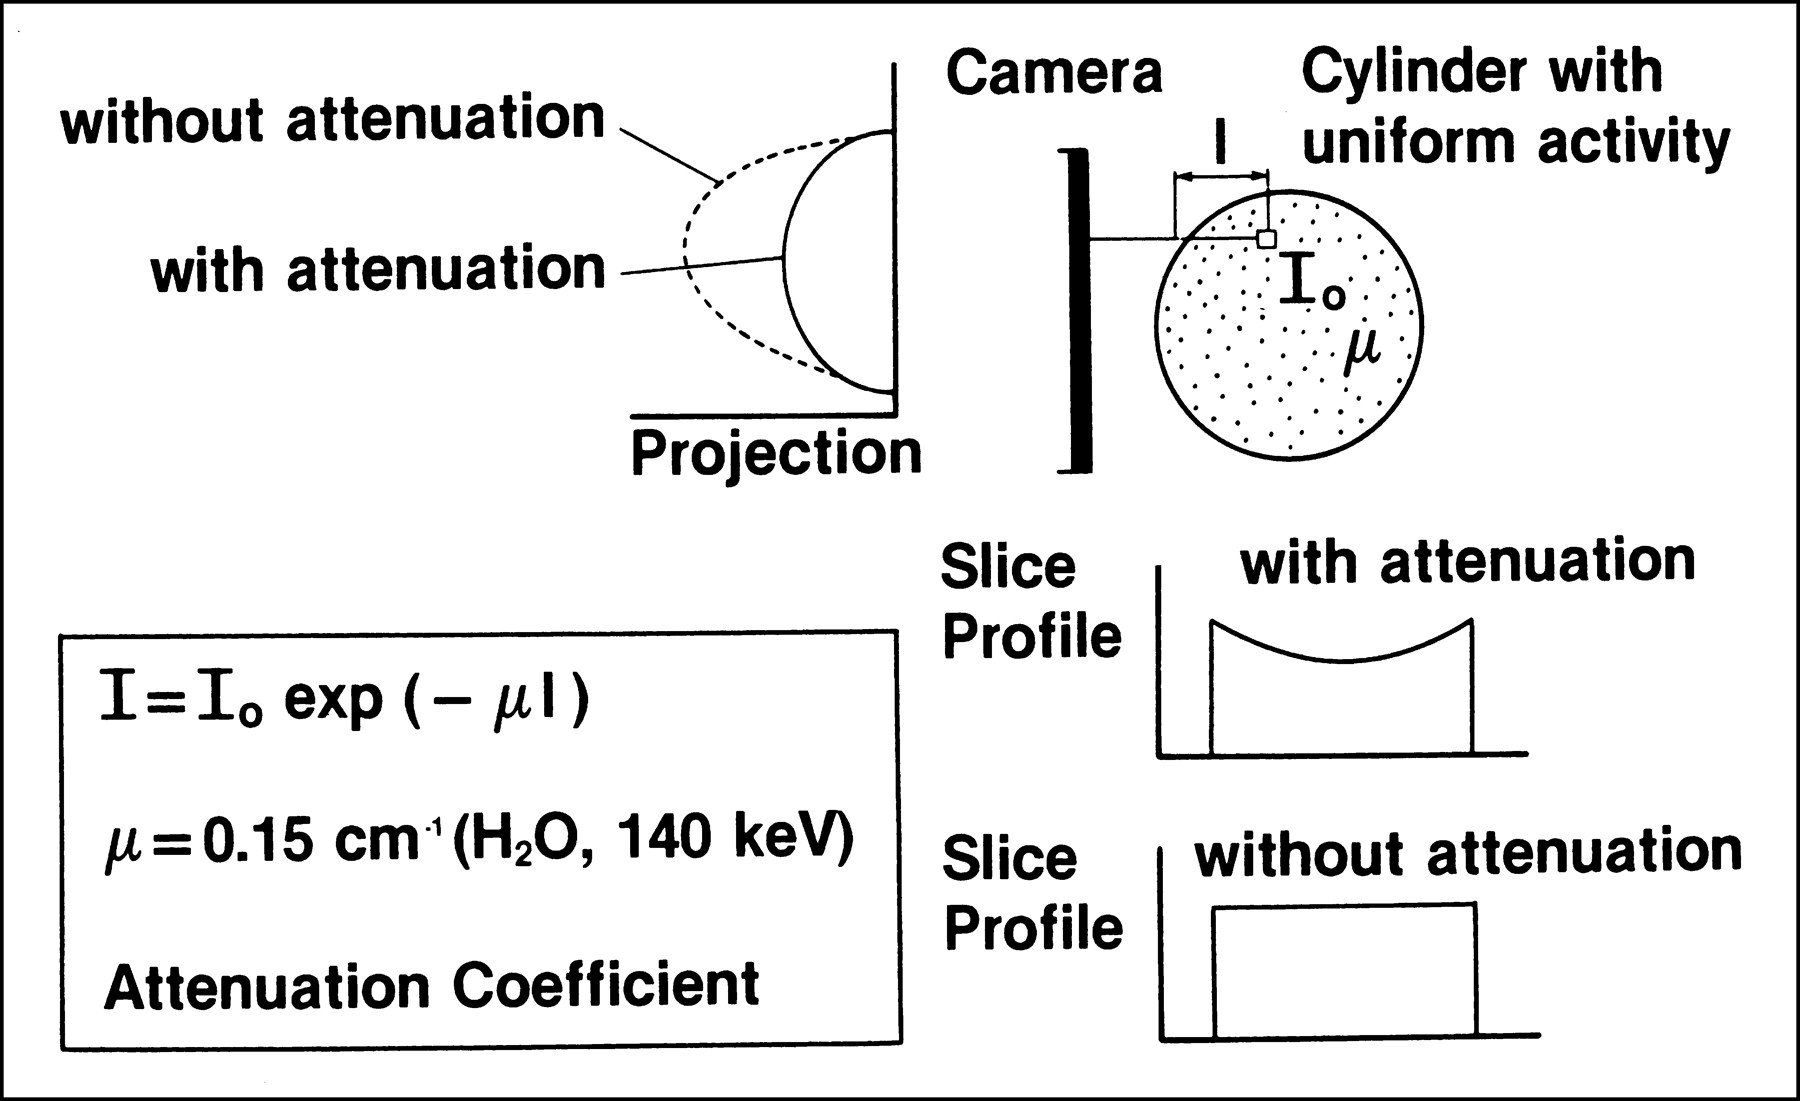
- FIGURE 9.
The effect of attenuation on SPECT imaging. The intensity of photons emerging from a source of activity within an attenuating medium is reduced by exp (−μl), where μ is the linear attenuation coefficient (cm−1) and l is the depth of the activity in the attenuating medium at a particular projection angle. This produces attenuated projections (upper left) and the cupping artifact in the reconstructed transverse slices (lower right).
- FIGURE 10.
Chang postprocessing attenuation correction method. (A) Original uncorrected central transverse slice from a 128 × 128 99mTc-HMPAO brain SPECT study with a manually determined boundary of the head overlaid. (B) Correction map C (x,y) = M/S exp (−mlq), q = 1,2, . . ., M, where x,y is the pixel location within the boundary, M is the number of projection views, and lq is the depth of x,y within the boundary for projection angle q. (C) Uncorrected slice and (D) attenuation-corrected slice. Note the increase in activity toward the center of the brain. To avoid under- or overcorrection, the boundaries must be accurately defined (preferably in an automated fashion).


Tables
Views Matrix Pixel depth Maximum count/pixel Disk space (bytes) 64 64 × 64 Byte 255 262,144 (256 kb) 64 64 × 64 Word 65,535 524,288 (512 kb) 128 128 × 128 Byte 255 2,097,152 (2 Mb) 128 128 × 128 Word 65,535 4,194,304 (4 Mb) Filter Filter variables Band-limited ramp Cut-off frequency Shepp-Logan Cut-off frequency Shepp-Logan-Hanning Cut-off frequency Generalized Hamming Cut-off frequency, a weighting coefficient Low-pass cosine Cut-off frequency Butterworth Cut-off frequency, order Parzen Cut-off frequency


Jump to section
Related Articles
Cited By...
- No citing articles found.