


Abstract
Oncologic 18F-FDG PET/CT acquisition and reconstruction protocols need to be optimized for both quantitative and detection tasks. To date, most studies have focused on either quantification or noise, leading to quantitative harmonization guidelines or appropriate noise levels. We developed and evaluated protocols that provide harmonized quantitation with optimal amounts of noise as a function of acquisition parameters and body mass. Methods: Multiple image acquisitions (n = 17) of the International Electrotechnical Commission/National Electrical Manufacturers Association PET image-quality phantom were performed with variable counting statistics. Phantom images were reconstructed with 3-dimensional ordered-subset expectation maximization (OSEM3D) and point-spread function (PSF) for harmonized quantification of the contrast recovery coefficient of the maximum pixel value (CRCmax). The lowest counting statistics that resulted in compliance with European Association of Nuclear Medicine recommendations for CRCmax and CRCmax variability were used as optimization metrics. Image noise in the liver of 48 typical oncologic 18F-FDG PET/CT studies was analyzed with OSEM3D and PSF harmonized reconstructions. We also evaluated 164 additional 18F-FDG PET/CT reconstructed list-mode images to derive analytic expressions that predict image quality and noise variability. Phantom-to-subject translational analysis was used to derive optimized acquisition and reconstruction protocols. Results: For harmonized quantitation levels, PSF reconstructions yielded decreased noise and lower CRCmax variability than regular OSEM3D reconstructions, suggesting they could enable a decreased activity regimen for matched performance. Conclusion: PSF reconstruction with a 7-mm postprocessing filter can provide harmonized quantification performance and acceptable image noise levels with injected activity, duration, and mass settings using a 260 MBq⋅s/kg acquisition parameter at scan time. Similarly, OSEM3D with a 5-mm postprocessing filter can provide similar performance with 401 MBq⋅s/kg.
PET and CT hybrid imaging using 18F-FDG is an important tool in the management of oncologic patients for clinical diagnosis, staging, prognosis, and treatment response assessment (1–3). Optimal PET/CT imaging should result in consistent diagnostic image quality and quantification with minimal costs and radiation exposure. The use of PET as a quantitative imaging biomarker requires standardization and harmonization of imaging procedures to obtain reproducible quantitative metrics. PET/CT acquisition and reconstruction protocols optimized to meet international quantitative standards might not necessarily be optimized for lesion detection tasks (4,5). The introduction of point-spread function (PSF) modeling in reconstruction algorithms has been shown to increase performance in detecting small and low-intensity lesions (6–9), but SUV quantification of small lesions has lower reproducibility because of increased ensemble noise when low gaussian filters (optimized for detection) are used (10,11).
During the last few years, several facilities have adopted the European Association of Nuclear Medicine (EANM) guidelines through the EANM Research Ltd. (EARL) 18F-FDG PET/CT accreditation program (12) as a standard for PET SUV quantification (12–14). Despite the wide literature on optimization of PET protocols for lesion detectability (6–9,15) or the impact of noise on quantitation (16–19), there is still limited work optimizing low-dose PET as a quantitative biomarker using guidelines such as the EANM criteria (20,21). Advances in PET image reconstruction algorithms that incorporate PSF modeling have reduced noise and increased resolution, potentially allowing for reduced injected activity and thus lower radiation exposure to patients (15,22–25), opening new scenarios for cancer screening with PET (15,26,27).
PET imaging performance is dependent on the scanner model (6–9), acquisition parameters (administered activity and acquisition duration), image reconstruction, and patient habitus (22–25). We have previously suggested acquisition parameter optimization for a particular scanner based on a quadratic or power dose scheme to maintain image noise at a consistent level throughout the population (21,23–25). Image noise is indeed a source of variance in the SUV quantification of tumors and ideally should be maintained at a constant level over the patient population to ensure consistent quantification variability (16–19). In general, the reconstruction settings define whether the contrast recovery coefficients are within the harmonization criteria (20). Lasnon et al. demonstrated that PSF reconstruction can result in images in quantitative compliance with the EANM guidelines using additional gaussian filtering (28). However, this approach requires that the detection and quantitative tasks be performed on 2 different image volumes. Thus, a commercial solution (EQ.PET; Siemens Healthcare) allowing all-in-one diagnostic and quantitative images was validated by Quak et al., who found that PSF modeling could be used to provide higher detectability and the EANM quantitative recommendations at the same time (29,30). Our initiative is also in line with the increasing interest in task-specific protocols, which can reduce costs and increase diagnostic accuracy (26).
The present study aims at developing optimized imaging protocols providing recommendations on acquisition and reconstruction settings to obtain lower injected activities and harmonized quantification according to the EANM guidelines. The EARL procedure specifies that image noise should not exceed 15% and that recovery coefficients should remain unbiased (21). To account for differences in the noise behavior between standard 3-dimensional ordered-subset expectation maximization (OSEM3D) and PSF reconstructions, we extended the concept of harmonization by defining optimal quantification variability levels, which are affected by image noise. Therefore, this work aimed to characterize the noise properties of PSF reconstructions, verify the consistency of a newly defined harmonization bias index (HBI) across acquisition parameters for both OSEM3D and PSF reconstructions, and define reconstruction-specific formulas for optimal acquisition parameters that satisfy HBI, noise levels, and quantification variability.
This work provides a feasible methodology that might be applied in PET centers to decrease the injected activity while achieving consistent image quality and quantification when using PSF reconstructions.
MATERIALS AND METHODS
Scanner
PET/CT imaging was performed on a Biograph TruePoint TrueV PET scanner (Siemens) combined with a 16-slice CT scanner (Emotion 16; Siemens). PET images were corrected for random coincidences, normalization, dead-time losses, scatter, and attenuation. The attenuation map was obtained by a spiral CT scan (100 kVp, automatic tube-current modulation) on a 168 × 168 matrix (4.07 × 4.07 × 3 mm voxels) and a standard soft-tissue reconstruction kernel (Siemens B30s) for both phantom and patients. All images were acquired within 3 mo from the cross-calibration between PET scanner and dose calibrator.
Phantom Study
We used an International Electrotechnical Commission/National Electrical Manufacturers Association body phantom with 6 spheres (internal diameters of 10, 13, 17, 22, 28, and 37 mm) filled with an 18F-FDG stock solution of 45 MBq diluted in 1,000 mL and the phantom compartment filled with 42 MBq of 18F-FDG to yield a sphere-to-background concentration ratio of 10:1, according to the EANM guideline (20). Hereafter, we define the phantom activity as the 18F-FDG activity in the background. The contrast recovery coefficient of the maximum pixel value (CRCmax) is defined as the ratio between the measured activity concentration in the maximum pixel and the actual activity concentration in the sphere. Thus, CRCmax represents the fraction of SUVmax recovery of a given lesion size in patient scans.
Four different cumulated counting levels (groups A–D) were acquired with multiple acquisitions to evaluate the variance of CRCmax. Sets of PET/CT images were sequentially acquired at 2 bed positions. The phantom activity and the image duration were adjusted to reproduce equivalent counting within groups as follows: group A, 1,272 MBq⋅s/kg, high count (2 frames at 26.7 and 23.4 MBq for 449 and 510 s each); group B, 416 MBq⋅s/kg, clinical standard (5 frames at 20.0, 19.5, 18.3, and 16.5 MBq for 190, 202, 220, 225, and 235 s each); group C, 216 MBq⋅s/kg (5 frames at 12.6, 12.2, 11.7, 11.2, and 10.7 MBq for 160, 165, 170, 180, and 200 s each); and group D, 81 MBq⋅s/kg (5 frames at 14.3, 14.1, 13.9, 13.7, and 13.5 MBq for 76, 80, 81, 83, and 86 s each).
Acquisition parameters in the phantom—defined as the product between the phantom activity at acquisition time (in megabecquerels) and the acquisition duration per bed position (in seconds)—were normalized by 9.4 kg, which is the phantom weight in the background.
Reconstruction
Images were reconstructed with the following algorithms: OSEM3D (with 3 iterations, 21 subsets, and a 5-mm gaussian filter [EARL-harmonized]); PSF7 (PSF ordinary Poisson with 3 iterations, 21 subsets, and a 7-mm gaussian filter [EARL-harmonized]); and PSF2 (PSF ordinary Poisson with 2 iterations, 21 subsets, and a 2-mm gaussian filter). In addition, the PSF2 filter had additional filtering applied with the EQ.PET package (PSF2-EQ*, where the asterisk denotes the amplitude of gaussian filtering).
The OSEM3D reconstruction is our current clinical standard, and the PSF2 is used for detection optimization (9,24). All gaussian filters were 3-dimensional isotropic.
Phantom Image Analysis
The CRCmax of the hot spheres was calculated using an automatic routine provided by the EANM on request (31), except for the PSF2 images, which were analyzed with EQ.PET (Siemens) by applying varying postprocessing filters (6, 6.5, and 7 mm) to determine the configuration that complies with the EANM quantification standards.
The protocol was considered harmonized according to EARL standards if the mean CRCmax was within the EARL limits. We defined an overall HBI to measure, for each acquisition and reconstruction protocol, the deviation of the CRCmax of each sphere from the corresponding EARL limits: Eq. 1
Eq. 1
where i = 1–6 indicates each phantom sphere, Ci is the average of CRCmax for sphere “i” obtained through repeated acquisitions, Ui and Li are the upper and lower EARL limits for sphere “i,” and Ki is a normalization index calculated as the difference between Ui and Li limits for sphere “i.” According to this definition, one expects HBI to be 1.00 if the protocol is EARL-compliant, and the higher the HBI is, the greater is the bias from EARL limits.
The ratio between the standard deviation and the average of the CRCmax values of sphere “i” across realizations were calculated and averaged among all 6 spheres, for each acquisition group, to estimate the quantification variability (Qvar) of a protocol as follows: Eq. 2
Eq. 2
where σi is the SD of CRCmax across realizations for sphere i.
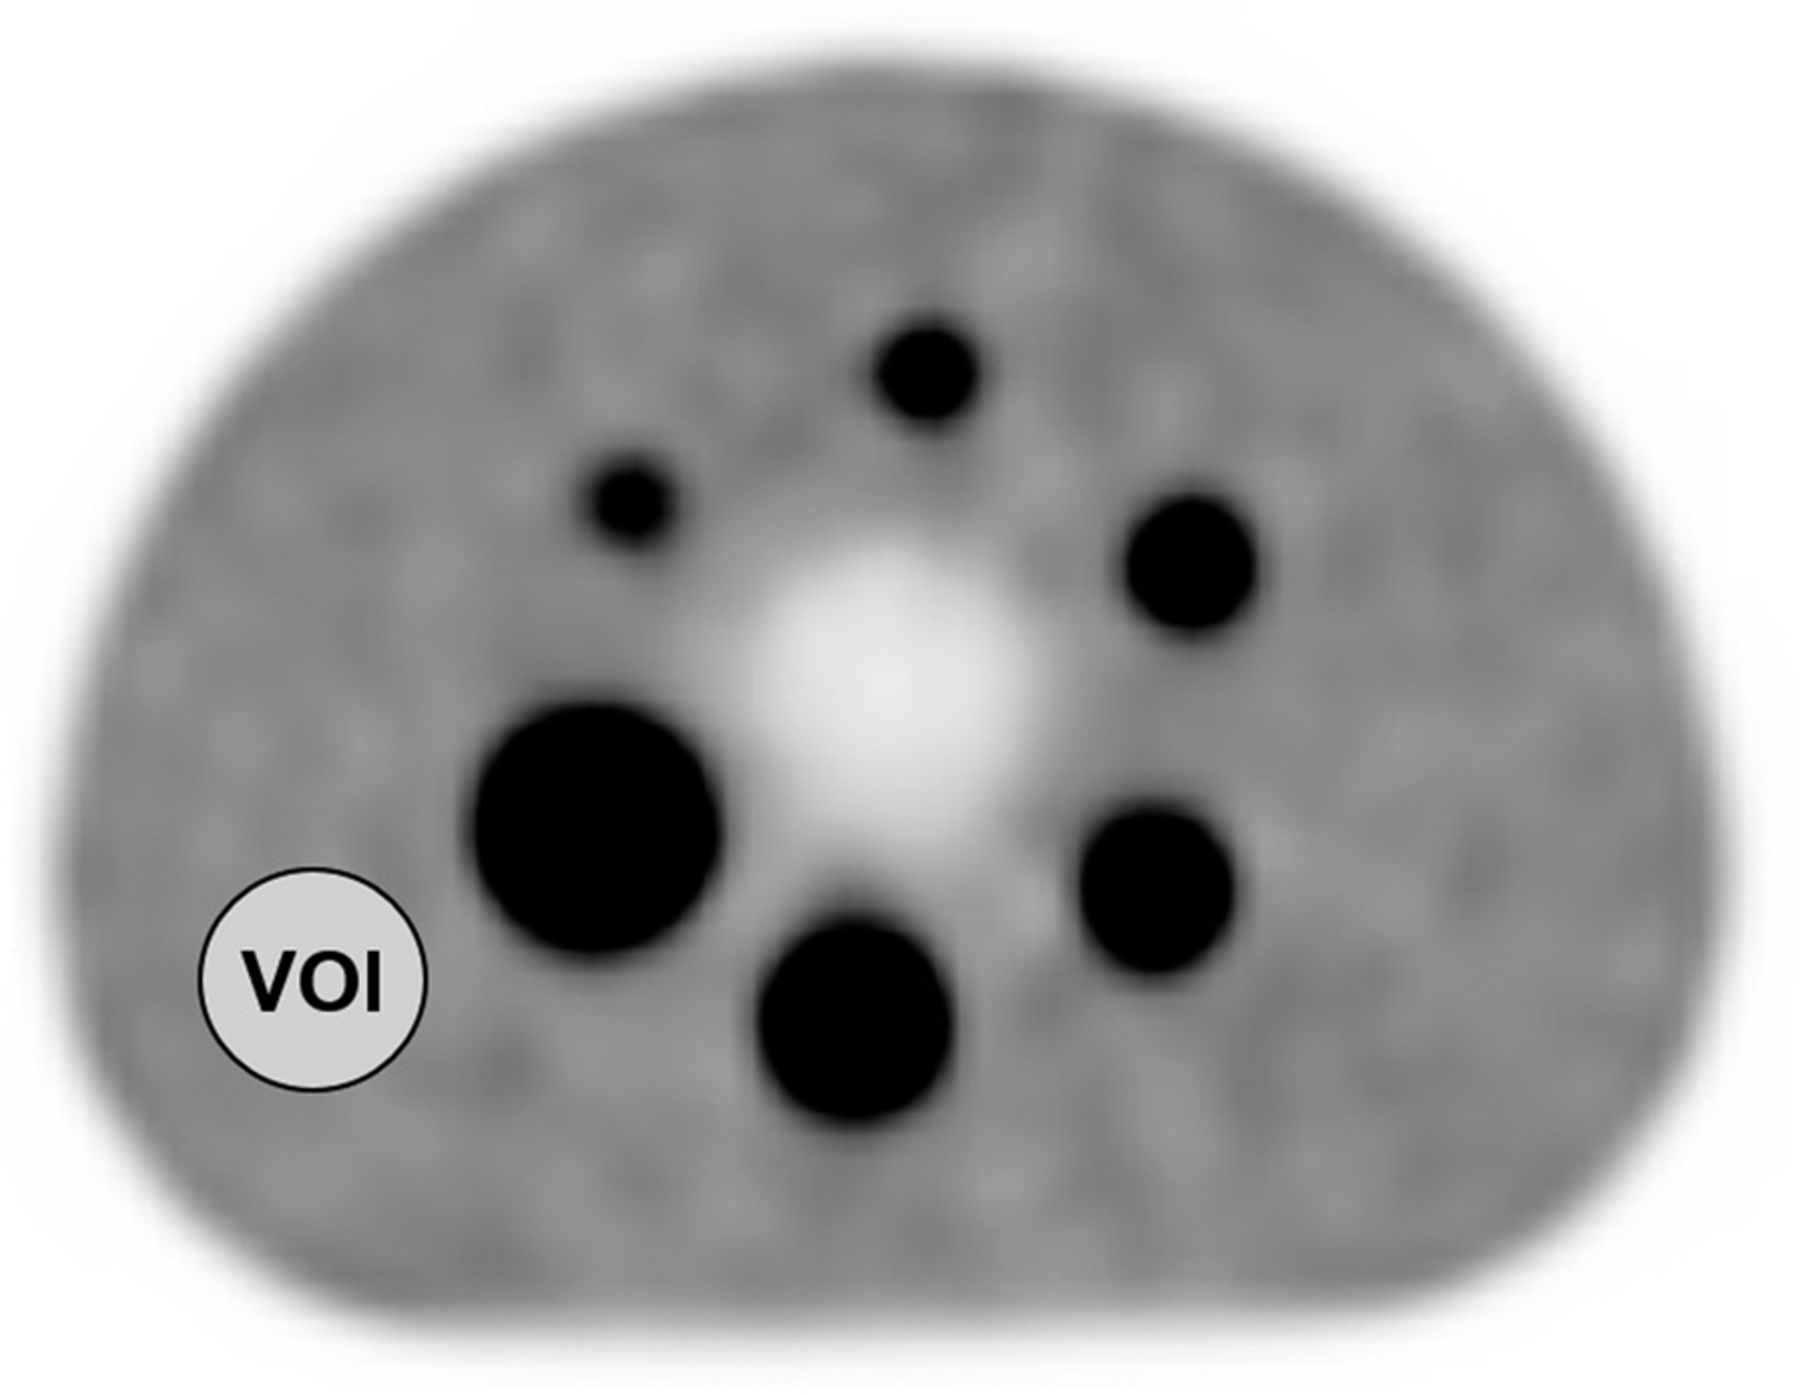
Additionally, according to PERCIST criteria 1.0 (32), we defined a spheric volume of interest of 3-cm diameter in the background (Fig. 1) to compute the background noise metric CV, defined as Eq. 3
Eq. 3

Positioning of 3-cm-diameter volume of interest (VOI) for CV calculation.
where σb and μb are the SD and the mean pixel value in the volume of interest, respectively.
Patient Imaging
Conventional 18F-FDG PET patient examinations for whole-body oncologic workup were randomly selected and excluded on the basis of the following criteria: pregnancy or nursing, motor difficulties, liver metastases, hyperglycemia at the time of tracer administration, or a delay exceeding 90 min between 18F-FDG injection and image acquisition. The study was approved by the Monte Tabor–Hospital São Rafael ethical board, and all subjects gave written informed consent. The images were acquired according to the clinical protocol of Hospital São Rafael for tumor PET imaging. Subjects fasted for 6 h before the 18F-FDG injection.
Prospective Patient Imaging (Step 1)
In total, 48 18F-FDG PET/CT whole-body adult studies (mean body mass, 69 ± 15 kg; range, 36–102 kg) were gathered over a 2-mo period and prospectively evaluated. Images were acquired from the mid thigh to the vertex of the skull of subjects who lay supine with the arms positioned above the head. PET scans started 67 ± 10 min (range, 51–90 min) after injection of 3.1 ± 0.7 MBq/kg (range, 1.4–5.8 MBq/kg), and the acquisition duration was adjusted according to the methodology of reference 24 for a given patient weight and injected activity, with the mean duration being 201 ± 43 s (range, 111–300 s).
Retrospective List-Mode Imaging (Step 2)
This step aimed at characterizing the noise levels of PSF7 as a function of the acquisition parameters. We extracted 41 list-mode images of the liver region from a database of our previous work (24). The subjects weighed 70 ± 16 kg (range, 45–120 kg), and the injected activity was 3.5 ± 0.6 MBq/kg (range, 2.3–4.6 MBq/kg). All 41 list-mode images were acquired for 360 s and reconstructed at incremental 1-min intervals up to 4 min (4 images per patient) with PSF7 reconstruction, resulting in 164 images.
Patient Image Analysis
All images were analyzed with Syngo.VIA, version VA30 (Siemens Healthcare). The CV was measured in the liver of healthy subjects using the same volume-of-interest size as used for the phantom experiments.
For step 1, OSEM3D and PSF7 were used to analyze the differences in CV. Because we aimed at comparing the noise characteristics between both harmonized reconstructions (similar spatial resolution), the PSF2 algorithm was not evaluated and can be assessed elsewhere (24).
For step 2, CV was analyzed through a first-order approximation for the CV from the total collected counts, as previously published (24): Eq. 4
Eq. 4
where a and b are the regression coefficients, CD is the acquisition parameter in MBq⋅s/kg at imaging time (injected activity corrected for physical decay), and CV was obtained according to Equation 3. Data available from step 1 were used to cross validate the analytic curve obtained in step 2. Additionally, the CV values of step 2 were divided into 3 groups of CD (<200 MBq⋅s/kg [n = 45], 200–300 MBq⋅s/kg [n = 32], and 300–400 MBq⋅s/kg [n = 33]), and the dispersion of CV within groups was verified by computing the CV variance (σ2cv): Eq. 5
Eq. 5
where  is the averaged CV and N is the number of CV measurements within a group.
In clinical imaging, CV is a function of injected activity, acquisition time, reconstruction, processing, and patient-dependent parameters (e.g., body mass). For a particular CV and scanner settings, the expected activity and acquisition duration to achieve matched noise levels as a function of object mass is as follows (23): Eq. 6
Eq. 6
where A is the injected activity at scan time, t is the acquisition duration, α and β are scanner-specific coefficients, and m is the body mass. Previous published data for PSF2 and OSEM3D suggested acquisition parameters that give a CV of 12% as optimal (24). These acquisition parameters were arranged in Equation 6 to benchmark current recommendations, and the results from steps 1 and 2 were used to define A⋅t for PSF7.
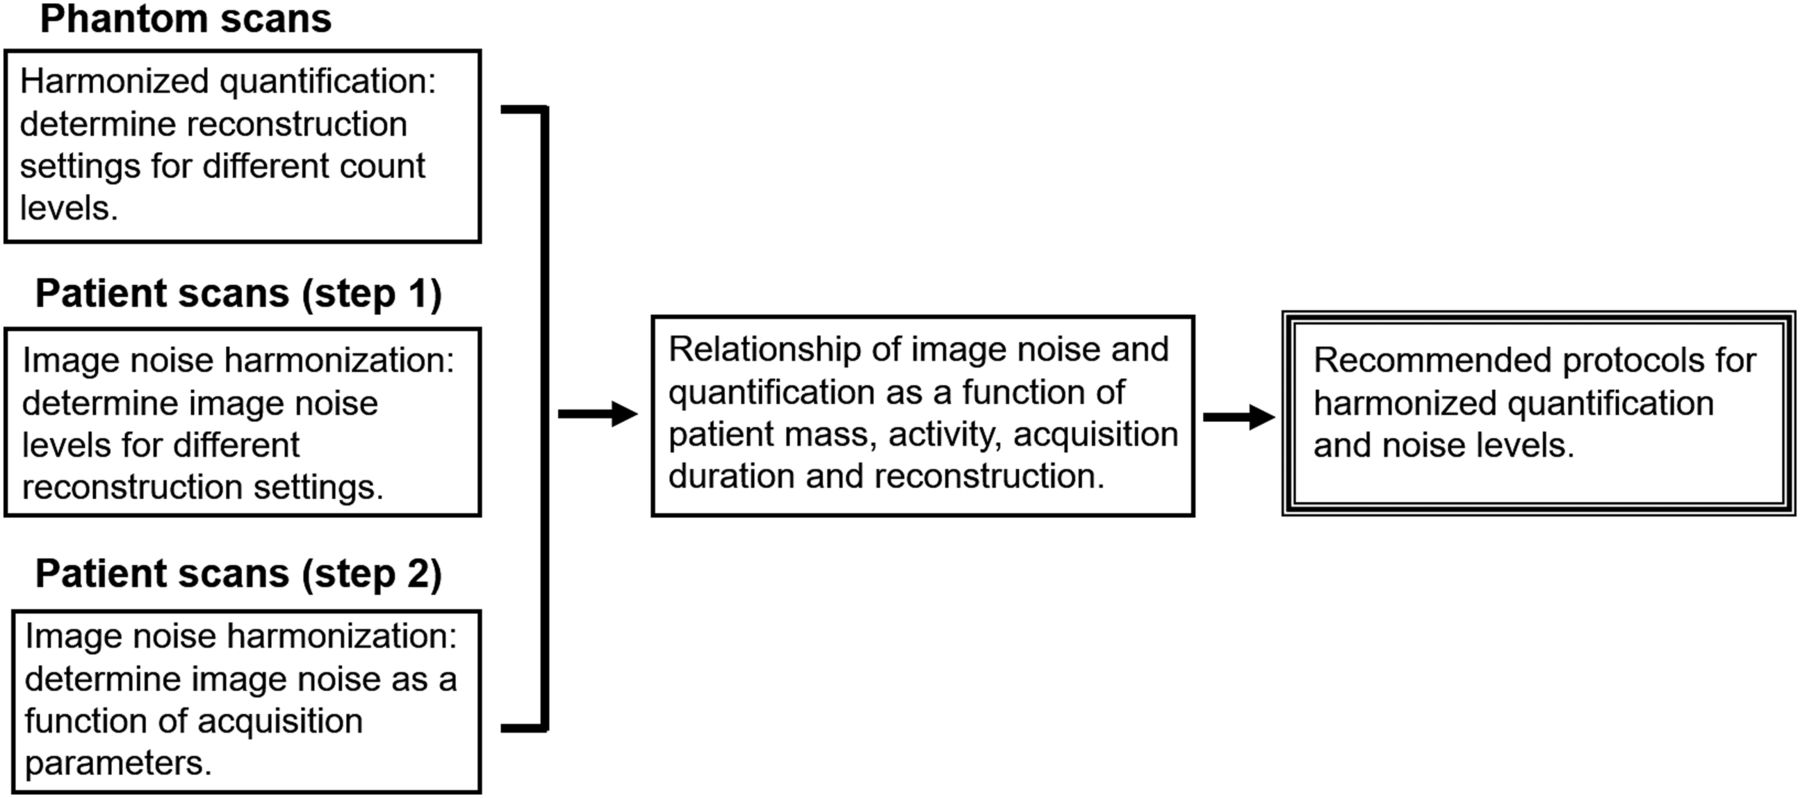
Figure 2 illustrates the design of the study.

Flow chart to achieve low-dose and task-specific protocols.
Statistical Analysis
The residuals of regression were tested for normality using the Shapiro–Wilk test to validate the curve fit of CV in the liver. An F test was performed to check for differences between the σ2cv for the 200–300 MBq⋅s/kg group and the following or previous groups. Graphs and statistical analysis were performed with OriginPro, version 9.0.0 (OriginLab Corp.), and GraphPad Prism, version 5.01. Where indicated, statistics of CV were computed following the limits for 95% confidence interval, and a P value of less than 0.05 was considered statistically significant.
RESULTS
Phantom Studies
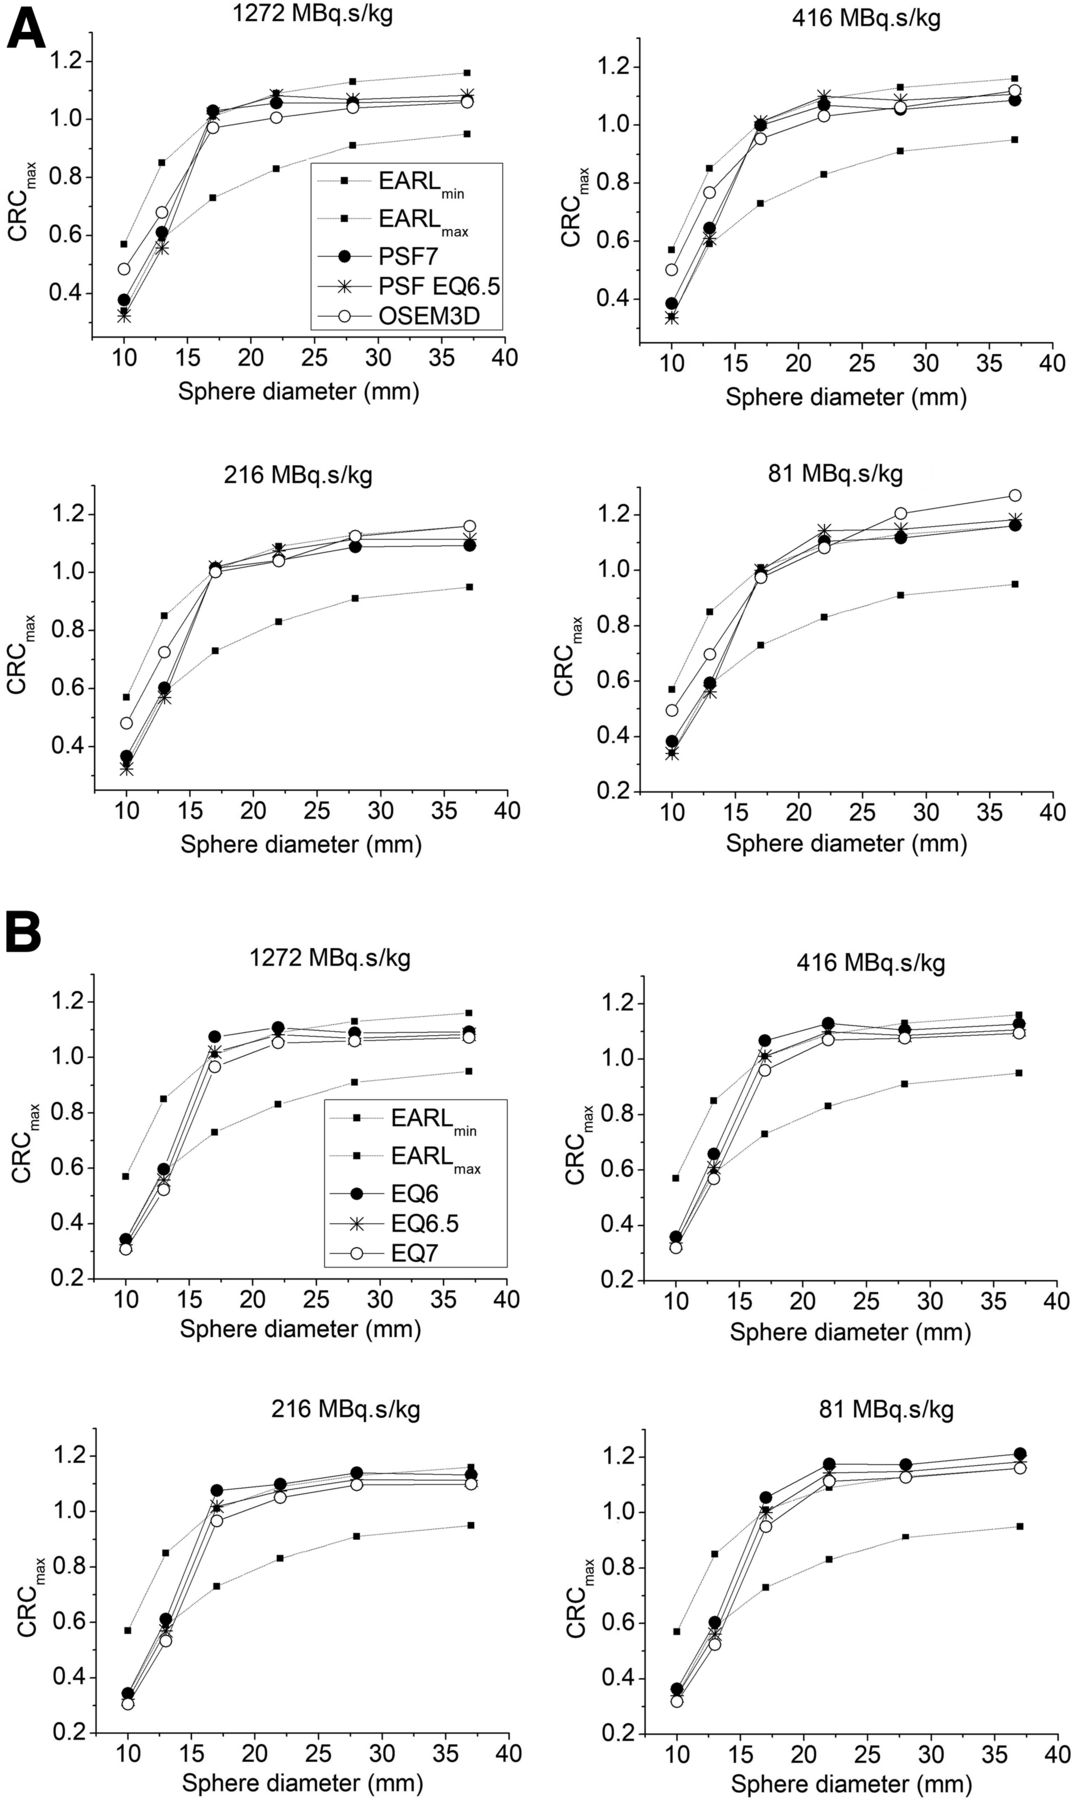
Figure 3 shows the CRCmax curves of each protocol. The EQ.PET filter that harmonized PSF2 with minimal bias was 6.5 mm (PSF2-EQ6.5), as shown by the HBIs reported in Table 1 and Figure 4, with the HBI for this reconstruction setting being the lowest among the tested EQ.PET filters.

CRCmax for OSEM3D, PSF7, and PSF2-EQ* protocols.
HBIs for Groups of Acquisition Parameters and Different Reconstruction Settings

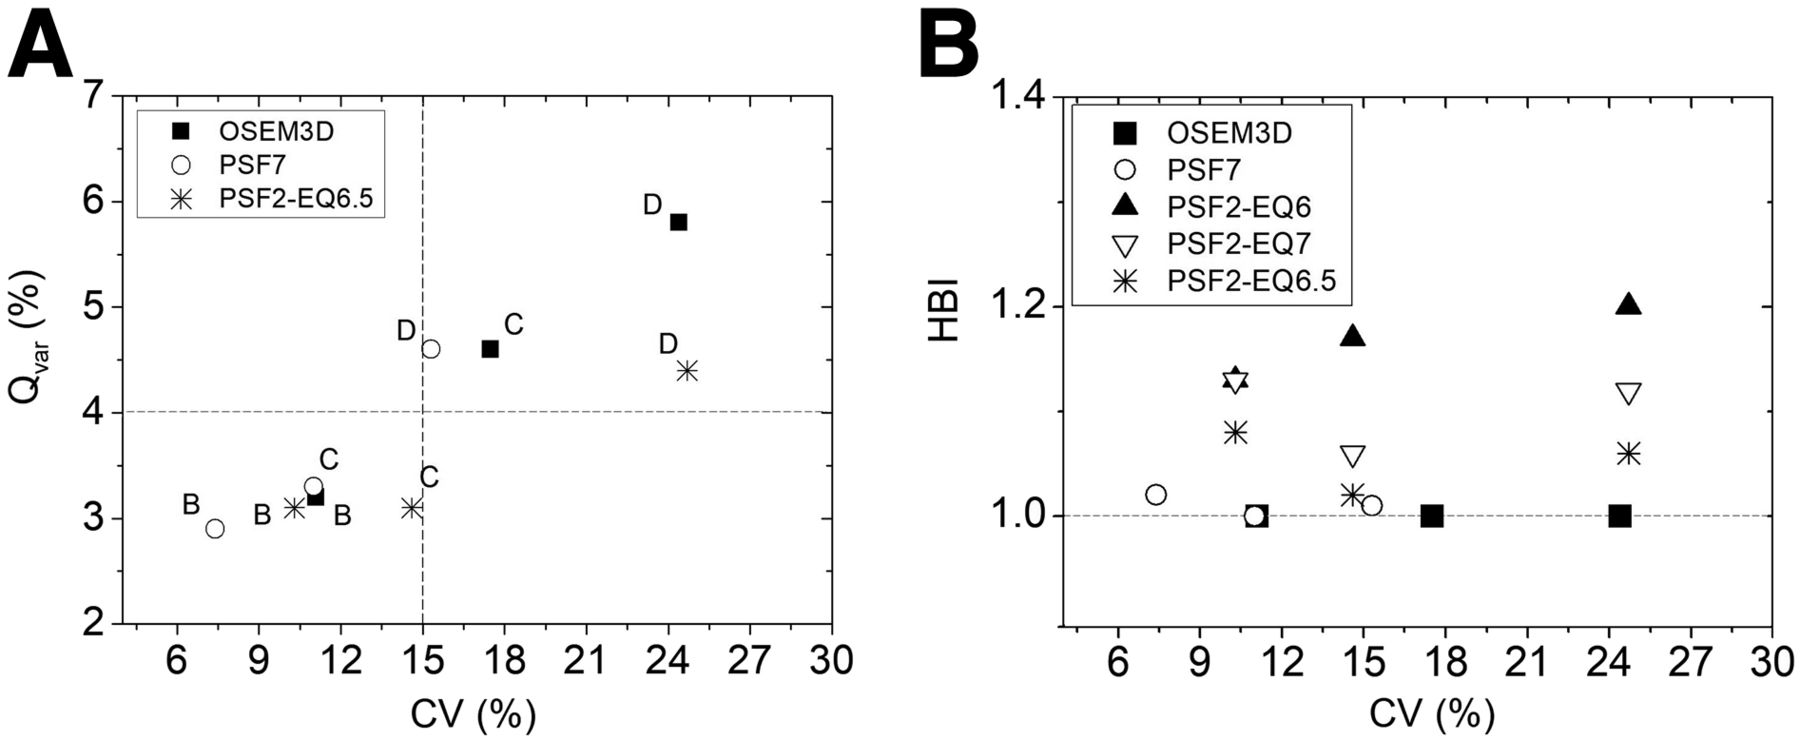
Quantification variability (A) and HBI (B) vs. image noise. Plots represent CV generated from acquisitions of groups B, C, and D. Dashed lines represent limits of acceptability for Qvar (A) and HBI (B), where a CV of 15% is the EARL reference.
Noise levels in uniform regions are commonly used as an indicator of quantification variability, and uniform region noise having a CV of 15% has been suggested as a limiting noise level (21). Figure 4 demonstrates that the Qvar for the PSF reconstructions was lower than that for OSEM3D for all groups of acquisition parameters (e.g., for group C, the noise with PSF is lower than OSEM3D), leading to less reconstruction-dependent variability. Interpolation of points for OSEM3D in Figure 4A suggests that a Qvar of 4% would be a more reliable limit regardless of the reconstruction method. For quantifications with EQ.PET, it is important to stress that EQ.PET performs quantifications only on the spheres (lesions), and the background noise for PSF2 is presented as with only 2-mm smoothing in Figure 4.
Patient Studies
Step 1
The injected activity and acquisition duration resulted in a decay-corrected acquisition parameter of 397 ± 68 MBq⋅s/kg (range, 221–612 MBq⋅s/kg). The evaluation of background noise in the liver for step 1 resulted in a CV of 11.7% ± 3.6% and 6.7% ± 2.4% (confidence interval = 95%) for OSEM3D and PSF7, respectively (Fig. 5). Thus, noise in the liver is 1.75 times higher for OSEM3D than for PSF7 (P < 0.0001).
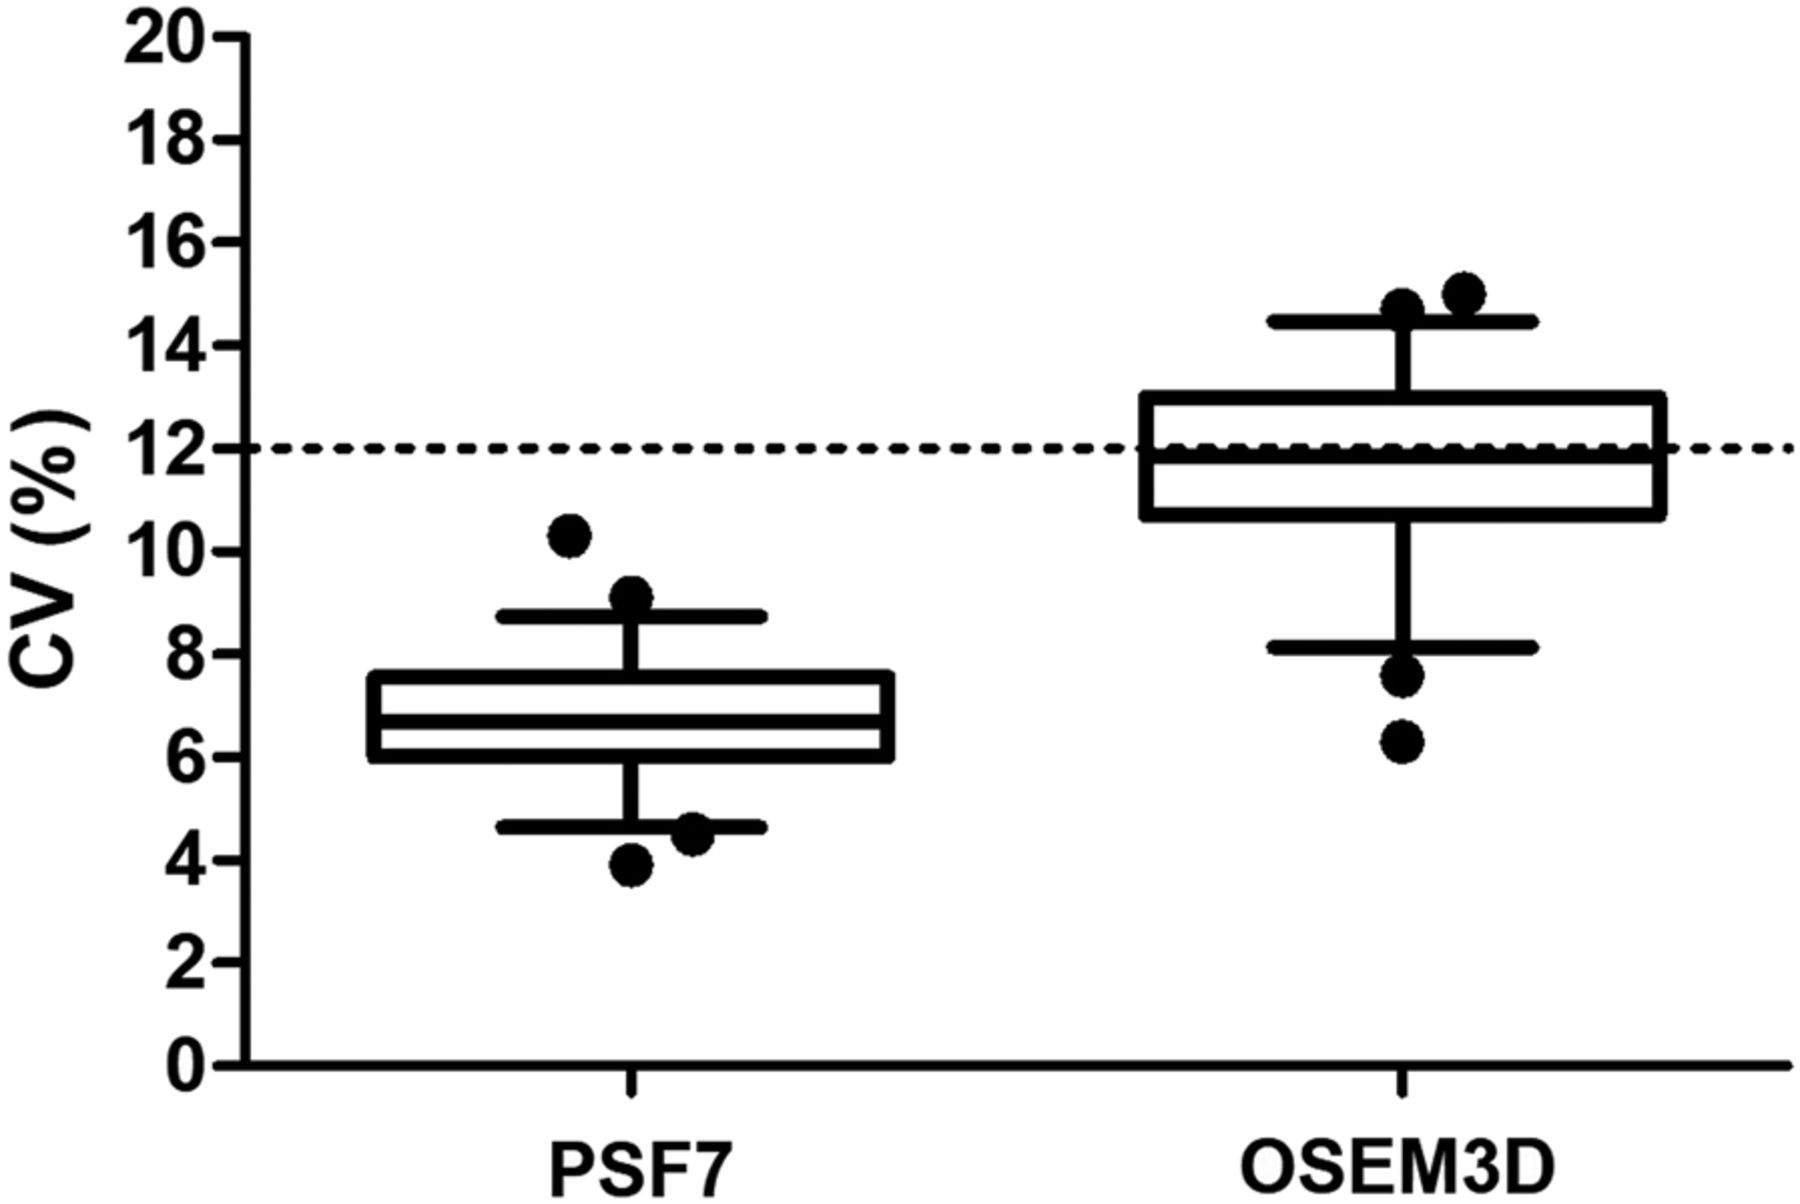
Comparison of CV between PSF7 and OSEM3D. Dashed line indicates OSEM3D and PSF2 noise obtained from formulations in reference 24.
Step 2
The plots of liver noise from step 2 (Fig. 6) show trends similar to the phantom studies. For a given reconstruction setting, the image noise depends on the activity concentration, acquisition duration, scatter, and attenuation conditions, which are similar between the phantom and a 75-kg standard patient because of their similar transaxial section. At scan time, the injected activity concentration in patients was similar to that in the phantom (∼2 MBq/kg). However, because the SUV is the ratio of local concentration to injected activity concentration, a higher SUV indicates a higher concentration relative to the injected activity. Therefore, the liver had 2–3 times more 18F-FDG activity (SUV, 2–3) than the phantom background (SUV, 1). For the liver region, the presence of activity in adjacent volumes penalizes the noise-equivalent count rate and negatively affects image noise. Noise-equivalent count rate and image noise have different relations according to reconstruction, with images reconstructed using PSF modeling being less affected by noise-equivalent count rate degradation (22,24). Areas of inhomogeneous 18F-FDG uptake and anatomic noise in the liver are another source of increased noise in the clinical situation. However, the higher 18F-FDG activity in the liver dominates over these factors in patients in comparison to the phantom.
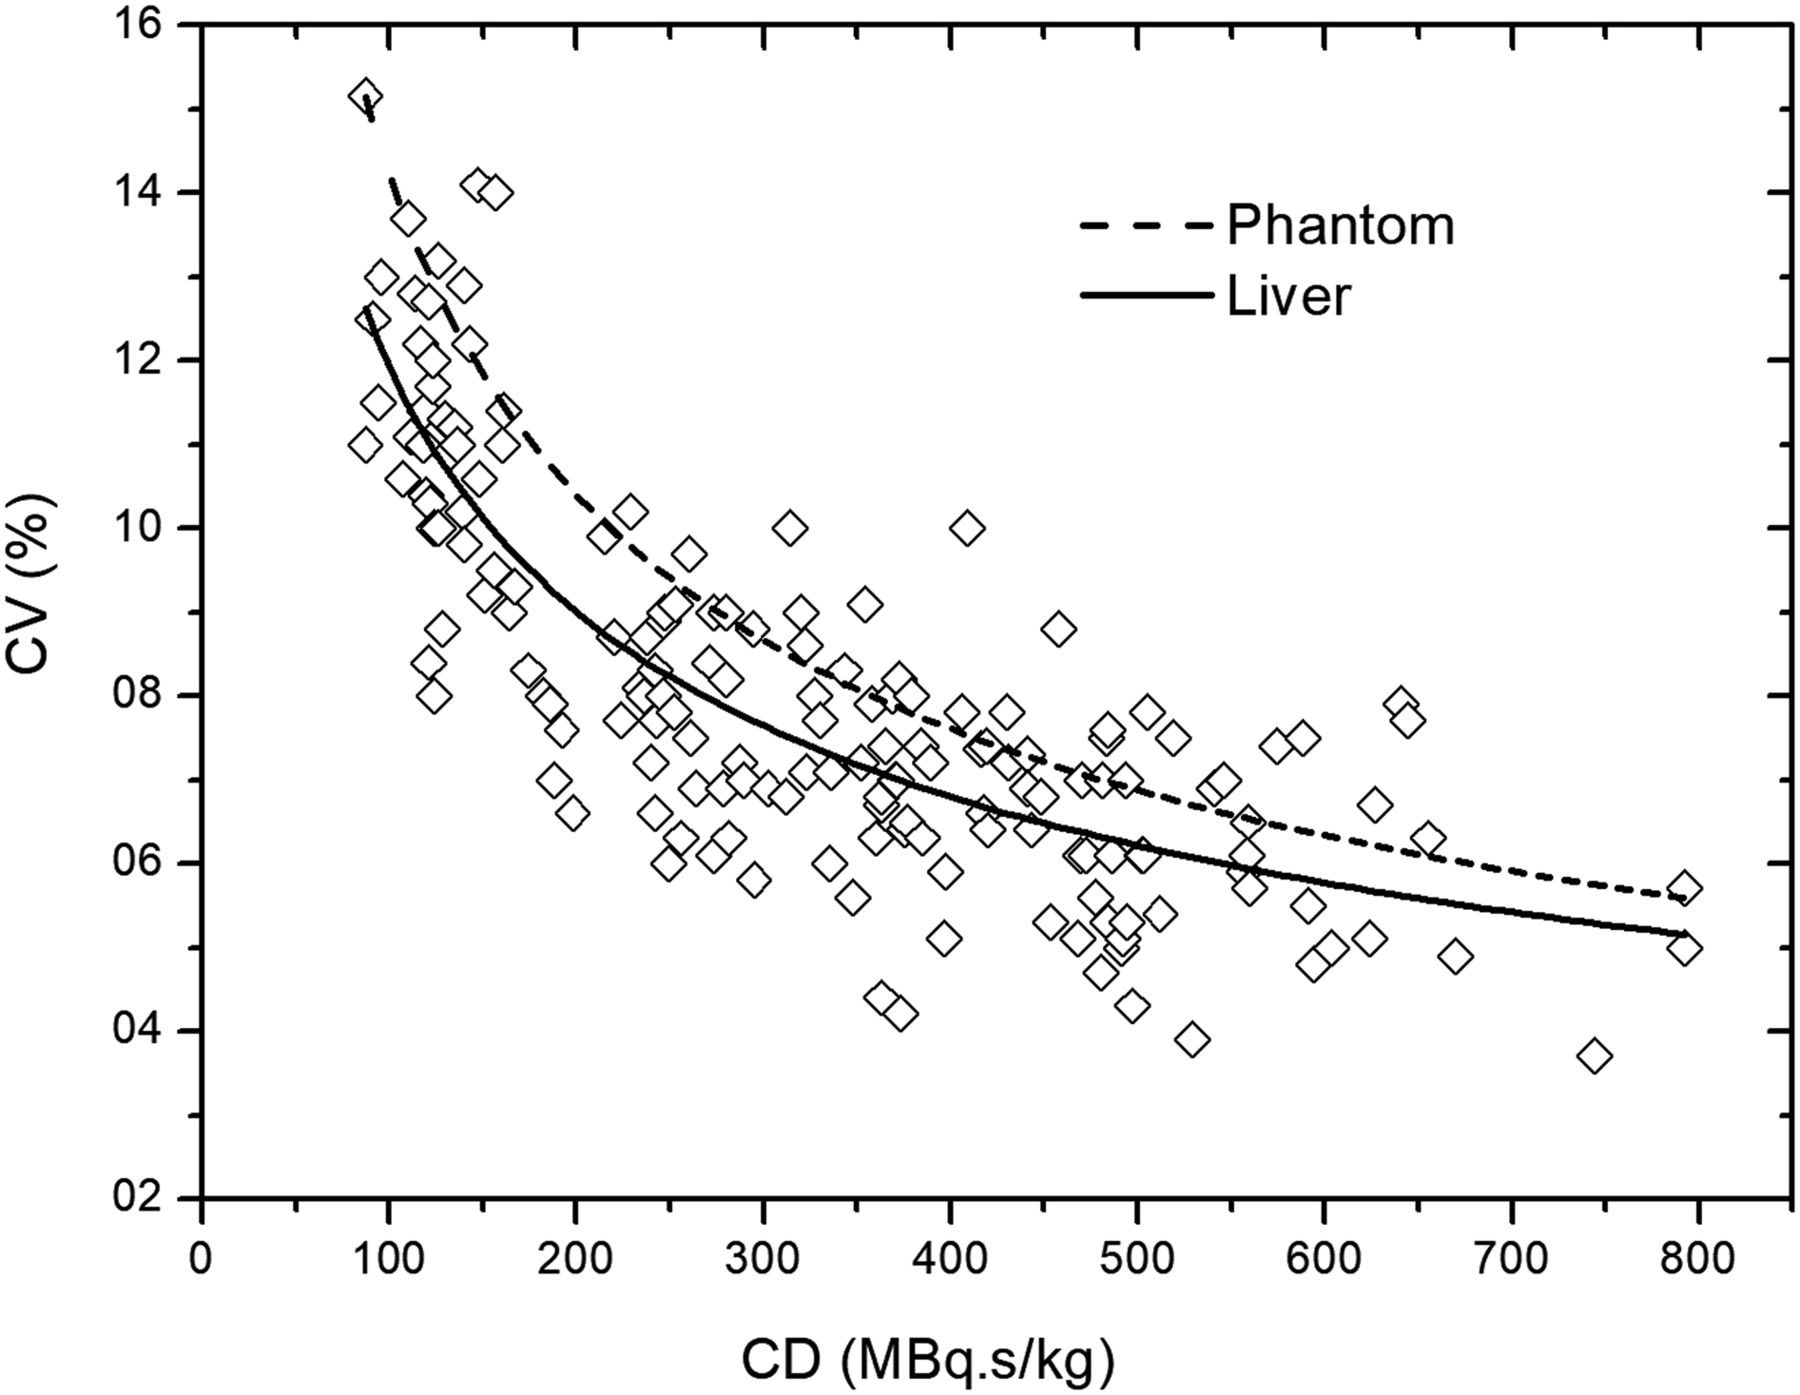
Plot of liver noise (CV) vs. acquisition parameter for patient data from step 2 using PSF7. Curves fit to these liver data (solid line) and to phantom data (dashed line) were generated with fitting coefficient of a = 0.77, b = −0.40, R2 = 0.67, and a = 1.40, b = −0.49, R2 = 0.98 for liver and phantom, respectively.
Noise Standardization and Protocol Validation
By comparing step 1 (397 ± 68 MBq⋅s/kg; group B; CV, 6.7% ± 2.4%; confidence interval, 95%) and step 2 for the same range of CD (388 ± 36 MBq⋅s/kg; n = 39; body mass, 73 ± 18; CV, 7.0% ± 2.4%, confidence interval, 95%), one can conclude that the 2 groups have clinically equivalent noise performance. A 2-sided t test was performed to rule out the null hypothesis that the difference in these 2 groups is greater than 0.7% (indifference zone). As such, we find that the mean difference in the groups was 0.3% ± 0.3%, deemed to be equivalent by this definition (P < 0.05).
The images of subjects weighing more than 100 kg (mean, 113 ± 12 kg; n = 3; CD, 378 ± 57 MBq⋅s/kg) were selected and found a CV of 7.3% ± 1.9% (confidence interval, 95%; k = 4.3) as predicted by the analytic model where CV is 7.2% (Fig. 6). These findings support the hypothesis of a linear model for PSF7. Hence, coefficient β in Equation 6 may be adjusted to β = 1, and CD in PSF7 may be linearly adjusted according to patient body mass.
Analysis of σ2cv as a function of CD showed a higher σ2cv when CD was less than 200 MBq⋅s/kg, where σ2cv was 3.6 × 10⁻⁴, 1.4 × 10⁻⁴, and 1.6 × 10⁻⁴ for a CD of less than 200, 200–300, and 300–400 MBq⋅s/kg, respectively, and the mean value of the CD groups was 136.6, 256.2, and 355.4 MBq⋅s/kg, respectively. The F test demonstrated that σ2cv was statistically different between less than 200 and 200–300 MBq⋅s/kg (P = 0.007). However, no significant difference in σ2cv was observed when 200–300 and 300–400 MBq⋅s/kg were compared (P = 0.69). From this analysis, we can state that a CD higher than 260 MBq⋅s/kg will provide a CV with acceptable variability for PSF7.
Optimal 18F-FDG Dose Schemes
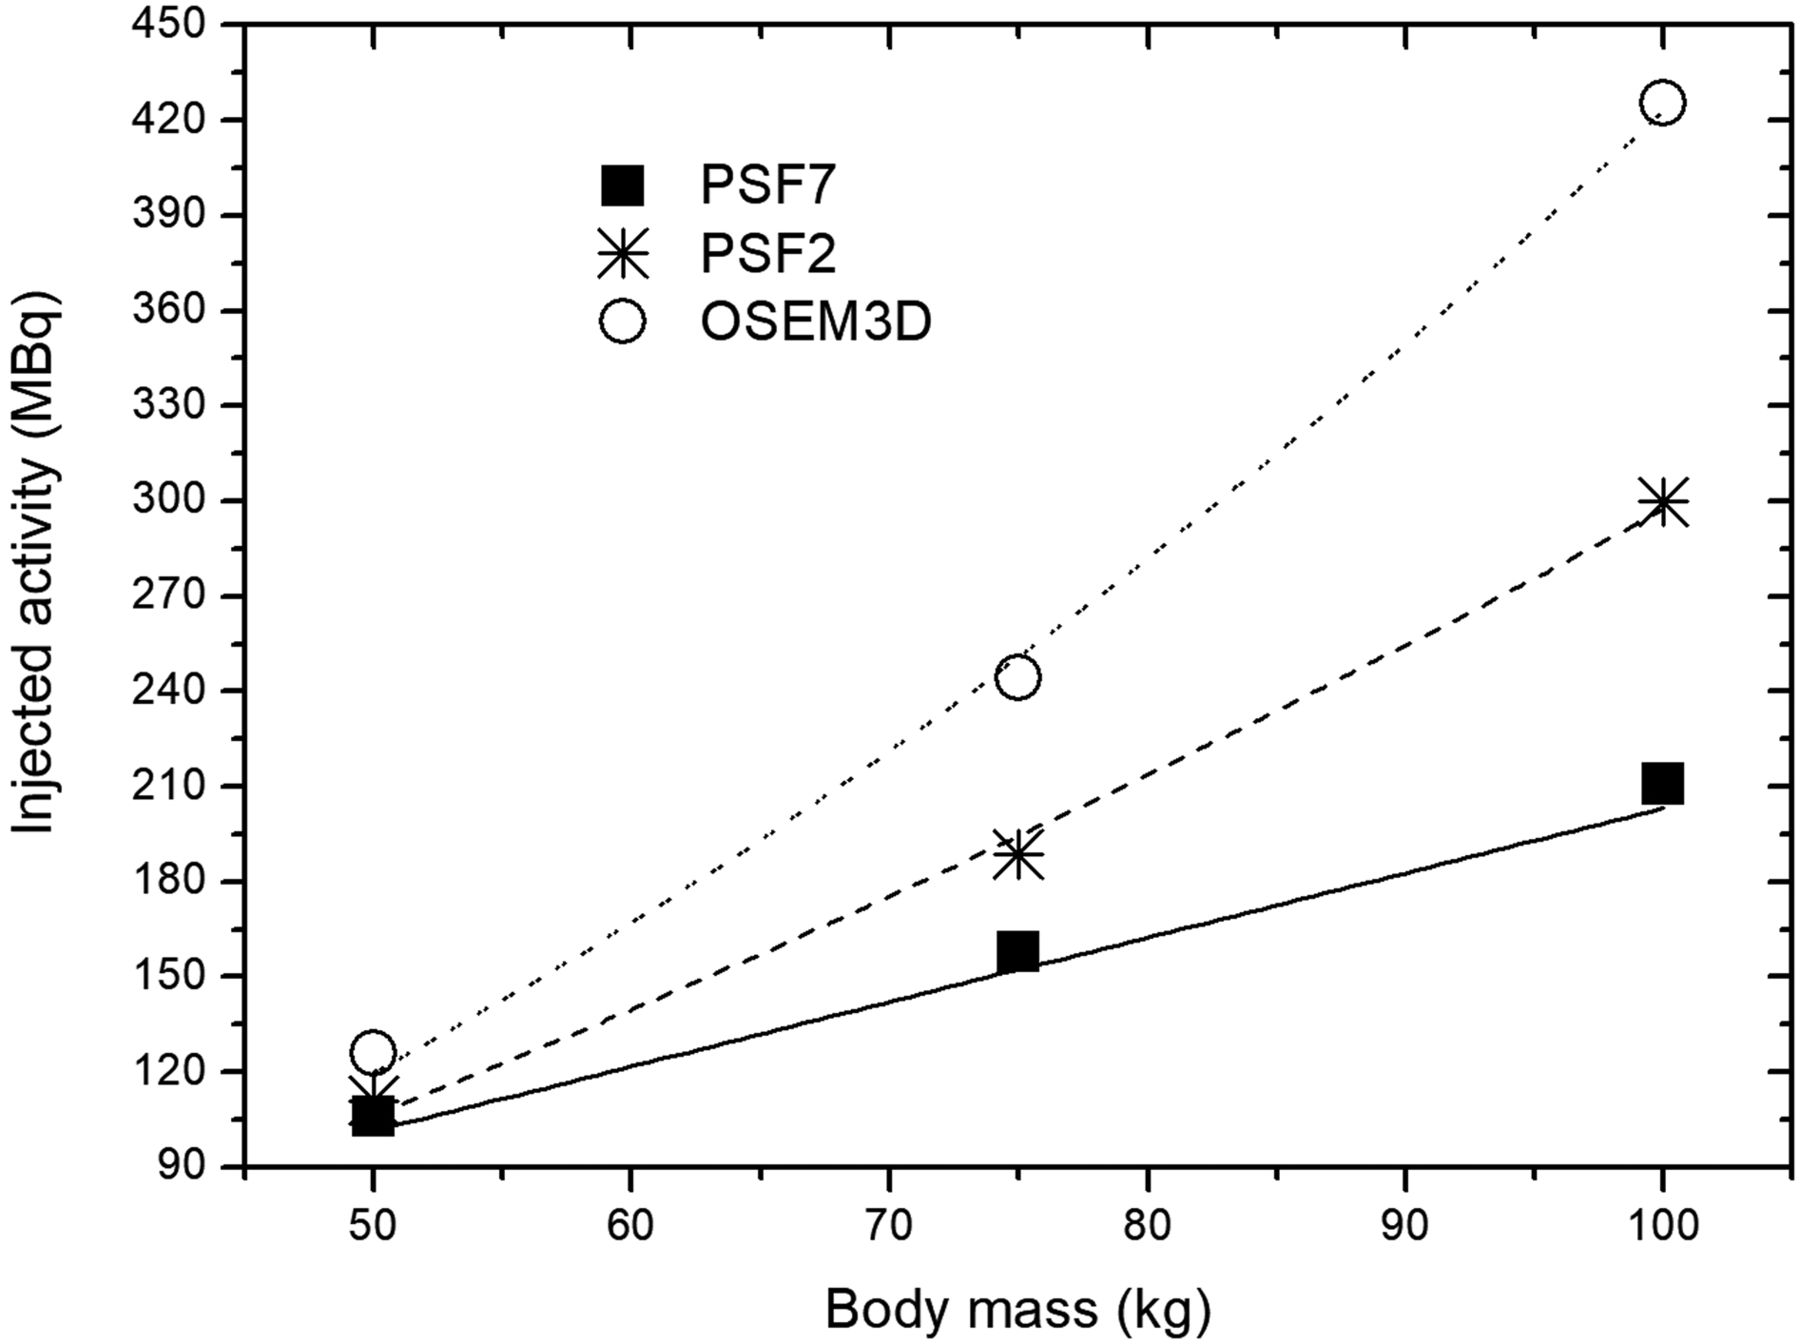
Both PSF configurations yielded lower doses than those commonly used in PET studies (Table 2). For optimal PSF2 imaging, 326 MBq⋅s/kg (β = 1.48) provides a CV of 12% in the liver, considered the gold standard (24). The optimal CD for PSF7 is 260 MBq⋅s/kg (β = 1), which will result in a 106, 158, and 211 MBq injected activity for, respectively, a 50, 75, and 100 kg body mass. Thus, PSF could guide the design of new low-dose PET protocols in the range if 260–326 MBq⋅s/kg for a 75-kg standard patient and β between 1 and 1.5.
Optimal Counting Levels at Scan Time and Derived 18F-FDG Injected Activity
Figure 7 shows the injected activity for each reconstruction protocol. Ideally, lesion detectability should be maximized using PSF with minimum filtering (9) while maintaining SUV harmonization (EQ.PET) and injected activity as low as possible. On the other hand, detectability relies on a tradeoff among injected activity and reconstruction preferences (8). Therefore, PSF7 would provide the lowest injected activity and image quality still within international standards.

Dose scheme illustration. Injected activity is shown for 60-min uptake time and normalized to 3-min duration per bed acquisition.
DISCUSSION
This study aimed to derive optimal 18F-FDG PET/CT imaging protocols as a function of body mass to achieve quantification consistent with the EARL criteria while keeping the image noise standardized. The use of harmonized metrics may help with personalized medicine since these enable more reliable assessment of tumor characteristics. Advances in hardware and image reconstruction in PET technology can allow for decreased 18F-FDG injected activity, but the exact influence of PSF for 18F-FDG dose optimization and harmonized quantification is still unclear.
EARL Harmonization and Patient-Specific Dose Schemes
The overall compliance rate of EARL applicants is reported as only 63%, because of contrast recovery coefficient inconsistencies (14). Other authors have published data with EARL quantification slightly outside the EARL limits (14,28,33), but they did not state the magnitude of bias. In this work, we defined an HBI to quantify agreement with the EARL standards. It is important to note that the HBI metric has limitations in objectively comparing different bias configurations. For example, multiple spheres could be slightly biased and have the same HBI as a configuration in which one sphere is very biased; also, HBI does not tell the direction of bias (e.g., whether recovery coefficients are too low or too high). However, the proposed metric is useful to address the magnitude of the “slight bias” frequently reported in the literature.
For patient studies, in which patient habitus strongly affects the noise-equivalent count rate curves, higher injected activity will result in loss of data quality, which influences image quality. Therefore, increasing the acquisition duration is more effective than increasing the injected activity to preserve the image quality (25). That is, the β-value depends on the acquisition duration and the injected activity, and β will be smaller if the injected activity is limited to smaller values. In our facility, the injected activity for larger patients (>90 kg) is limited to 3 MBq/kg, and the acquisition duration is adjusted accordingly to maintain the counting statistics.
Reconstruction-Specific Dose Schemes
We showed that reconstructing the same raw data with PSF2 yielded an acquisition parameter that was more linear as a function of mass than OSEM3D (24). In other words, the PSF2 reconstruction had a lower β-value in the PSF reconstruction (Eq. 6). Thus, the optimal acquisition parameter for noise standardization should be adjusted according to patient-specific parameters (e.g., body mass) using reconstruction-specific power equations, contrary to the generalized quadratic method (21,23).
In this work, we used 164 datasets (4 images per patient) to obtain the noise curve with count levels that mimic a clinical situation. In Figure 6, differences of coefficient β between phantom and liver fits obtained with Equation 4 could be attributed to the fact that patient mass may not be sufficient to normalize across very different morphologies. However, the residuals of regression were normally distributed in the Shapiro–Wilk test of normality (w = 0.359, P < 0.05).
We compared the performance of regular OSEM3D and low-dose PSF configurations regarding EARL compliance, Qvar, and σ2cv in the liver. Our results showed that a linear approach is feasible for PSF7 with 260 MBq⋅s/kg, which performs similarly to OSEM3D with 400 MBq⋅s/kg. However, the small cohort of patients weighing more than 100 kg (n = 3) was a limitation in our study, encouraging its future validation on a larger population.
We demonstrated that strong filtering (PSF2-EQ6.5 and PSF7) improved the SUV variability of PSF over OSEM3D for the same counting level. This consideration is especially important for monitoring of a disease or designing new protocols when low dose is required, such as the recent interest in screening with PET.
Final Considerations
Clinical SUV measurements are prone to numerous sources of error related to technical, physical, and biologic factors (34–37). Although the EANM guideline recommends following strict technical factors (cross calibration, clocks synchronization, and others), the physical related factors (acquisition and reconstruction parameters) mirrored in the contrast recovery coefficient values are quite wide, and differences between the minimum and maximum EARL limits are within 20%–45% from the largest to the smallest spheres (12–14), showing that one must still be cautious when quantifying lesions with different protocols.
In the context of EARL accreditation, it is challenging that a large pool of imaging systems converges to the “same” contrast recovery coefficient curve (14). The implementation of PSF reconstruction with narrow gaussian filtering amplitudes allows for the smaller spheres of the National Electrical Manufacturers Association phantom to reach higher contrast recovery coefficient values, but the Gibbs effects overshoots quantification of the 17-mm sphere (38). This issue was resolved with strong gaussian filtering, and consequently, the contrast recovery coefficients of the 10- and 13-mm spheres were close to the lower contrast recovery coefficient limits. The EQ.PET filter, however, may easily be set up with a narrower filter when quantifying smaller lesions (<13 mm) in the same reconstructed image.
Of course, the EARL limits are not ideal but are a feasible recommendation for most PET-scanner generations to achieve minimal standards. On the other hand, alternative reconstruction configurations are encouraged to match the contrast recovery coefficient with minimal differences (34).
This work did not directly assess the relationship between acquisition and reconstruction parameters and detectability. Ideally, we would find protocols that achieve a sufficient level of quantification and detectability performance. We fall short of this goal using quantification and background noise as a surrogate for detectability under the assumption that quantification and background noise are reflective of contrast-to-noise ratio, a metric correlated with detectability. Although this shortfall is a limitation, our work represents one of the few studies attempting to find protocols with appropriate quantification and background noise levels.
Acquisition parameter adjustments according to patient habitus and reconstructions are required to maintain standardized image noise throughout the patient population and ensure consistent image quality and quantifications. Our method to achieve low-dose PSF-based protocols will also allow for management to improve the PET facility by scanning patients faster or decreasing the patient dosimetry and radiopharmaceutical costs.
CONCLUSION
This study provides scanner and patient-specific recommendations for an optimized oncologic 18F-FDG PET/CT imaging protocol when PSF modeling reconstruction is applied, with the aim of achieving compliance with the EARL standards. Optimal PET acquisition and reconstruction settings will allow for reduction of scan duration or administered 18F-FDG activity and consistent assessment of metabolic tumor activity, aligned with demands for personalization of patient assistance.
DISCLOSURE
No potential conflict of interest relevant to this article was reported.
Acknowledgments
We thank the Comissao Nacional de Energia Nuclear (CNEN, Brazil) and the International Atomic Energy Agency (IAEA) for their efforts to develop nuclear medicine at our institutions through a technical cooperation project. We also thank both reviewers for their crucial comments, which improved the quality of our work.
Footnotes
Published online Aug. 3, 2018.
REFERENCES
- Received for publication April 25, 2018.
- Accepted for publication July 26, 2018.


Jump to section
Related Articles
Cited By...
- No citing articles found.