


Visual Abstract

Abstract
The Alzheimer disease (AD) continuum is a neurodegenerative disorder with cognitive decline and pathologic changes. Tau PET imaging can detect tau pathology, and 18F-flortaucipir PET imaging is expected to visualize progression through the stages of AD, for which quantitative assessment is essential. Two measurement methods, statistically defined multiblock barycentric discriminant analysis (MUBADA)/parametric estimation of reference signal intensity (PERSI) and anatomically defined tau meta–volume of interest (VOI)/cerebellar gray matter (CGM) for SUV ratio (SUVR), were compared in this study to assess their relationship to AD clinical stage using 2 open multicenter PET databases. Methods: Data were selected for 106 cases from 2 databases, AMED Preclinical AD study (AMED-PRE) (n = 15) and Alzheimer Disease Neuroimaging Initiative 3 (n = 91). The data of the participants were categorized into 4 groups based on the clinical criteria. Tau PET imaging was conducted using 18F-flortaucipir, and the 2 SUVR measurement methods, MUBADA/PERSI and tau meta-VOI/CGM, were compared among different clinical categories: amyloid-negative cognitively normal, preclinical AD, amyloid-negative mild cognitive impairment (MCI), and amyloid-positive MCI. Results: Significant differences were found between cognitively normal and preclinical AD, as well as between cognitively normal and amyloid-positive MCI and between amyloid-negative MCI and -positive MCI in SUVR derived by MUBADA/PERSI, whereas SUVR by tau meta-VOI/CGM did not provide significant differences between any pair. The tau meta-VOI/CGM method consistently provided higher SUVRs and larger individual variations than MUBADA/PERSI, with a mean SUVR difference of 0.136 for the studied databases. Conclusion: MUBADA/PERSI provided the SUVR of 18F-flortaucipir uptake with better association with the clinical severity of the AD continuum and with smaller variability. The results support the usefulness of MUBADA/PERSI as a quantitative measure of 18F-flortaucipir uptake in multicenter studies using different PET systems and scanning methods. However, limitations of the study include the small sample size and the unbalanced distribution among clinical categories in the AMED Preclinical AD study database.
Alzheimer disease (AD) is a neurodegenerative disorder characterized by progressive cognitive decline and pathologic changes in the brain. Tau PET imaging has emerged as a valuable tool for visualizing tau pathology in vivo. It has been previously shown that visual positivity of 18F-flortaucipir PET correlates with Braak stage IV/V at autopsy (1). Because tau deposition increases with progression of the AD process, a quantitative evaluation using the SUV ratio (SUVR) has been applied in various studies.
Selection of target and reference regions is crucial for the SUVR calculation. Anatomically defined individual or composite regions have been generally used as target regions (2). However, for 18F-flortaucipir PET, there are several off-target binding areas such as choroid plexus, substantia nigra, basal ganglia, and thalamus that might affect anatomically defined ROI values (3). In addition, focal uptake is often observed in the dentate nuclei in the cerebellum (4,5). It is important to avoid the effect of spill-in from these regions, and many studies have been performed toward reliable and reproducible quantification of tau deposition (2,6). In this study, 2 measurement methods of SUVR, statistically defined multiblock barycentric discriminant analysis (MUBADA)/parametric estimation of reference signal intensity (PERSI) and anatomically defined tau meta–volume of interest (VOI)/cerebellar gray matter (CGM), have been tested. MUBADA is a statistically determined weighted average of cortical voxels on Montreal Neurologic Institute space as the target region, and PERSI uses probabilistically derived white matter as the reference region (7,8). On the other hand, the tau meta-VOI/CGM method was composed of anatomically defined cortical VOIs segmented with FreeSurfer as the target region and the CGM segmented with FreeSurfer as the reference region (9). In this study, we evaluated the differences between these 2 methods and their association with clinical stages of AD progression using 2 well-characterized multicenter PET databases.
MATERIALS AND METHODS
Cases Selected from Databases
We selected data for 106 cases from 2 databases, the AMED Preclinical AD study (AMED-PRE) database (n = 15) (10) and the Alzheimer Disease Neuroimaging Initiative 3 (ADNI3) database (n = 91) (11). The cases were classified into 4 categories according to modified AMED-PRE criteria shown in Table 1 and described in the Clinical Classification Criteria section below.
Demographics of Subjects Analyzed in This Study
Table 2 summarizes the PET scanners used in each database. ADNI3 PET data were acquired with GE Healthcare, Siemens, and Philips scanners, whereas AMED-PRE PET data were measured mainly with Shimadzu scanners.
PET Scanner Models Used to Acquire 18F-Flortaucipir PET Images
AMED-PRE data were obtained from the National Bioscience Database Center Human Database, Japan (research identifier hum0235.v1, 2020). The AMED-PRE project was launched in 2015 under Principal Investigator Hiroshi Mori. The primary goal of AMED-PRE was to test whether serial use of MRI, PET, other biologic markers, and clinical and neuropsychologic assessments can be combined to measure the progression of amyloid-negative mild cognitive impairment (MCI) and preclinical AD in the Japanese population. In the AMED-PRE project, structural 3-dimensional T1-weighted MRI was done for each participant using 3- or 1.5-T scanners, and amyloid PET imaging with 18F-flutemetamol or 18F-florbetapir was performed.
ADNI3 data were obtained from the LONI database (https://adni.loni.usc.edu/data-samples/access-data/). The ADNI project was launched in 2003 as a public–private partnership, led by Principal Investigator Michael W. Weiner. The primary goal of ADNI has been to test whether serial use of MRI, PET, other biologic markers, and clinical and neuropsychologic assessments can be combined to measure the progression of MCI and early AD (up-to-date information is available at https://ida.loni.usc.edu/home/projectPage.jsp?project=ADNI with proper account). In the ADNI3 project, MRI was done for each individual using a T1-weighted magnetization-prepared rapid gradient echo sequence with a 3-T scanner, and amyloid PET was performed with 18F-florbetaben or 18F-florbetapir. The ADNI3 study included more subjects and more tau image data than the AMED-PRE study. We used a total of 91 cases for the present analysis, randomly selecting the first tau imaging of 20–25 subjects in each category. From the ADNI3 database, we used processed 18F-flortaucipir images (“AV1451 Coreg, Avg, Std Img and Vox Siz, Uniform Resolution”) that had a spatial resolution close to the 18F-flortaucipir images of AMED-PRE.
Clinical Classification Criteria
The clinical classification of the subjects in the cases we selected was based on relevant background information and amyloid PET images. We defined 4 clinical categories: cognitively unimpaired subjects with amyloid-negative scan (referred to in this paper as normal), cognitively unimpaired subjects with amyloid-positive scan (PRE-AD), MCI subjects with amyloid-negative scan (MCI[A−]), and MCI subjects with amyloid-positive scan (MCI[A+]) (i.e., MCI due to AD). The ADNI3 subjects were randomly sampled from the database and classified into the same 4 categories according to the AMED-PRE criteria. Table 1 shows demographics of the subject cases in the AMED-PRE and ADNI3 databases.
Normal category subjects were 65–85 y old without any memory problem (clinical dementia rating, 0). Their Mini Mental State Examination score was 25–30, and their delayed recall score of Wechsler Memory Scale–Revised logical memory was no less than 3, 5, or 9 depending on the years of education (0–7, 8–15, or ≥16 y, respectively). Amyloid PET images were evaluated as negative.
For PRE-AD category subjects, amyloid PET images were positive, and the other criteria were the same as in the normal category. The amyloid PET classification for AMED-PRE subjects was obtained from the database as visual readings performed in the AMED-PRE project. The amyloid PET classification for ADNI3 subjects was obtained from the database on the basis of VOI values and the positivity threshold in the centiloid scale, and the threshold was 18 centiloid scale for 18F-florbetaben and 20 centiloid scale for 18F-florbetapir (12).
MCI[A−] and MCI[A+] subjects were 60–85 y old with objective persistent memory impairment as evidenced by a clinical dementia rating of 0.5, with the memory box score being 0.5 or higher. Their Mini Mental State Examination scores were 24–30 (≥24). And the Wechsler Memory Scale–Revised logical memory was no more than 6, 9, or 11 depending on the years of education (0–7, 8–15, or ≥16 y, respectively).
Tau PET Image Acquisition
Both projects used 18F-flortaucipir for tau PET imaging. In AMED-PRE, the injected activity was 240.5 ± 12.0 MBq (mean ± SD), and a 30-min PET measurement was performed starting 75 min after injection. In ADNI3, the injected activity was 371.8 ± 22.7 MBq, and a 30-min PET measurement was performed starting 75 min after injection.
In AMED-PRE, the time from amyloid to tau PET was 1.0–2.0 y (mean, 1.56 y). In ADNI3, it was 0.0–2.5 y (mean, 0.43 y).
SUVR Measurement with MUBADA/PERSI
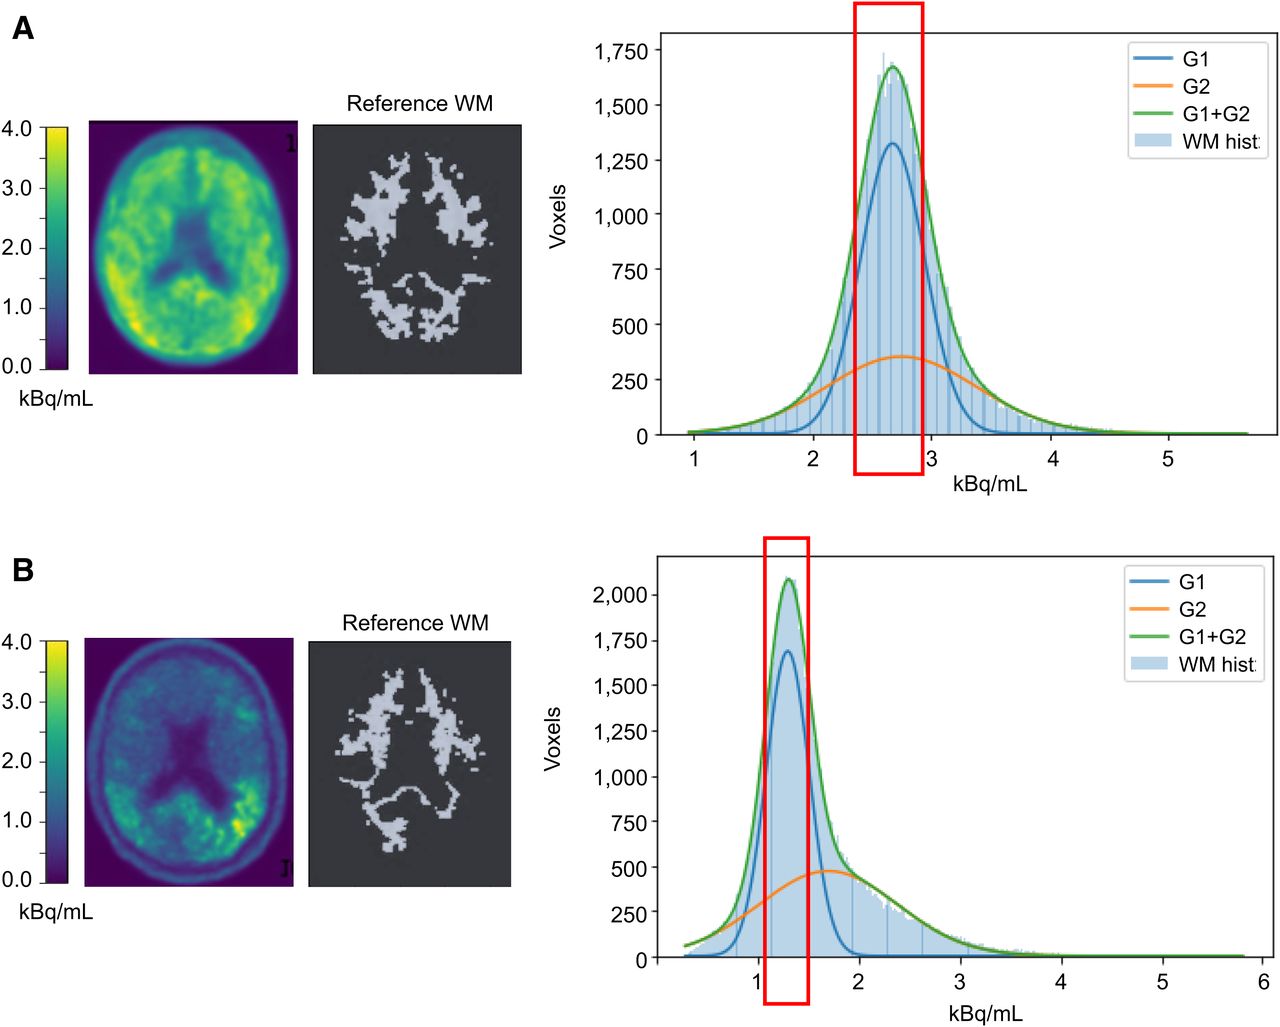
The MUBADA/PERSI method is the probabilistic analysis method developed by the group of Southekal and Devous (7,8). 18F-flortaucipir PET images were spatially normalized to the Montreal Neurologic Institute standard atlas using MRI. As a target region, we used MUBADA VOI, which was a predefined VOI of weighted cortical voxels related to the AD process determined by statistical analysis to identify the voxels most relevant to separation by diagnostic group and amyloid β-status (8), and it covered the posterior temporal, occipital, parietal, and part of the frontal cortex. As reference regions, we used the white matter regions derived by the PERSI method (7,8). PERSI provided a subject-specific reference region by the data-driven technique that identifies voxels with nonspecific 18F-flortaucipir uptake within an atlas-defined white matter region. The PERSI reference region is derived for each subject by using the white matter mask, plotting the voxel intensity histogram, and fitting the histogram to a bimodal gaussian distribution. Voxels with values within the full width at half maximum for the first lower peak were used to determine the reference region (7).
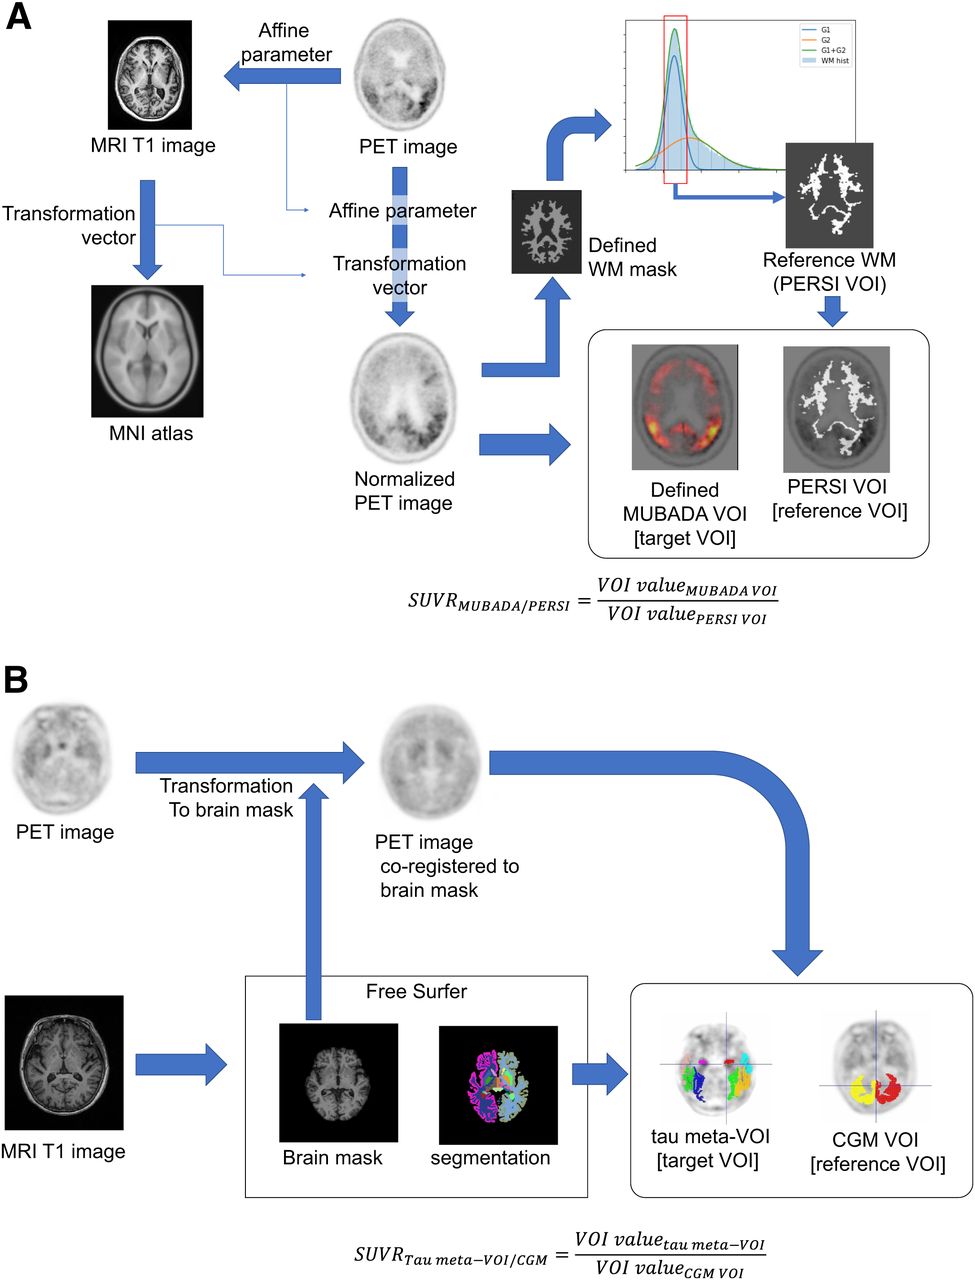
We implemented the MUBADA/PERSI analysis workflow with the aid of technical information from Avid and applied the system to the selected subject data in our study (Fig. 1A). VOI sizes for the MUBADA/PERSI method were 403.8 ± 50.6 cm3 for the reference region and 1,306.3 cm3 for the target region as defined in the Montreal Neurologic Institute standard atlas.

Scheme of SUVR measurement methods: MUBADA/PERSI method (A) and tau meta-VOI/CGM method (B). MNI = Montreal Neurological Institute; WM = white matter.
SUVR Measurement with Tau Meta-VOI/CGM
The tau meta-VOI/CGM method was based on anatomically defined VOIs and was adopted in the ADNI3 VOI data published by the University of California at Berkley (13). To provide tau meta-VOI/CGM SUVR, an individual MR image was segmented using the FreeSurfer software (version 7.1.1) to define anatomic VOIs in the native space. The anatomic VOIs were used to quantify the individual 18F-flortaucipir PET images. As the target region, we used a tau meta-VOI (9,13) (including amygdala, entorhinal, fusiform, inferior temporal and middle temporal). As the reference region, we used CGM (cerebellar cortex) (Fig. 1B).
For ADNI3 participants, tau meta-VOI/CGM SUVRs were obtained from the project database (13). For AMED-PRE participants, tau meta-VOI/CGM SUVRs were measured as described in the literature (13). VOI sizes for the tau meta-VOI/CGM method were 103.9 ± 10.6 cm3 for the reference regions and 63.7 ± 8.4 cm3 for the target region.
Ethics Approval and Consent to Participate
All data analyses and procedures performed in this study were in accordance with the ethical standards of the research ethics review committee in the Kobe City Medical Center General Hospital (approval zn210601). The original studies that created the databases were performed in accordance with the ethical standards as laid down in the 1964 Declaration of Helsinki and its later amendments or comparable ethical standards. All human data used in this study were initially collected after informed consent had been obtained.
Statistical Analysis
The Kruskal–Wallis rank sum test was used to test for significant differences among all 4 subject categories. The Wilcoxon rank sum test was used to compare between each categoric pair.
RESULTS
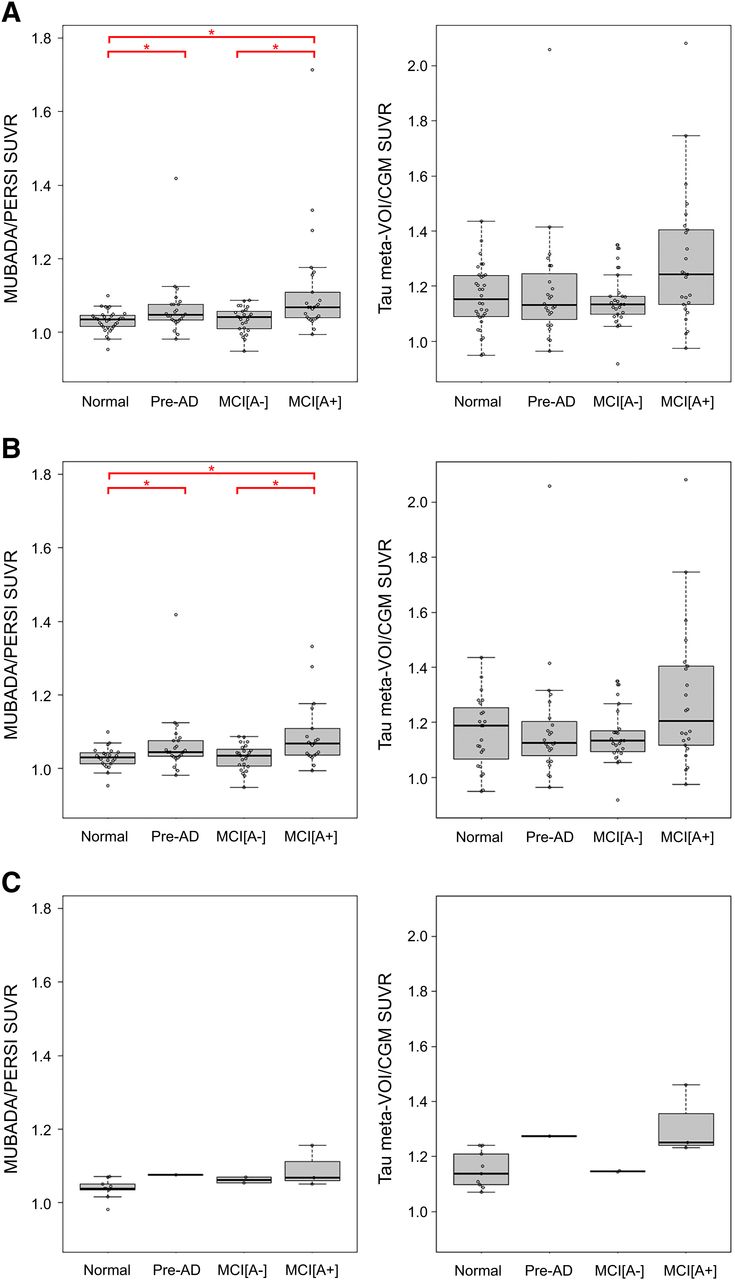
We successfully placed target and reference VOIs without errors for all 18F-flortaucipir images by both the MUBADA/PERSI and the tau meta-VOI/CGM methods. The 18F-flortaucipir SUVRs obtained by each method were compared among the 4 clinical categories (normal, PRE-AD, MCI[A−], and MCI[A+]) (Fig. 2). The SUVRs of each category were represented as box plots and overlaid with bee swarm diagrams. Figure 2 shows the SUVRs of the combined ADNI3 and AMED-PRE data, the ADNI3 data alone, and the AMED-PRE data alone. For the combined data, MUBADA/PERSI SUVRs were 1.03 ± 0.03, 1.07 ± 0.08, 1.03 ± 0.03, and 1.11 ± 0.15 for normal, PRE-AD, MCI[A−], and MCI[A+], respectively. Tau meta-VOI/CGM SUVRs were 1.16 ± 0.11, 1.19 ± 0.21, 1.15 ± 0.09, and 1.29 ± 0.24 for normal, PRE-AD, MCI[A−], and MCI[A+], respectively.

Box plots of SUVR for each clinical category calculated with MUBADA/PERSI method and tau meta-VOI/CGM method. Combined data include 91 ADNI3 subjects and 15 AMED-PRE subjects (A), and separate analyses for ADNI3 data (B) and AMED-PRE data (C) are also shown.*Significant difference between 2 categories (P < 0.05).
For the ADNI3 data alone, MUBADA/PERSI SUVRs were 1.03 ± 0.03, 1.06 ± 0.08, 1.03 ± 0.03, and 1.11 ± 0.15 for normal, PRE-AD, MCI[A−], and MCI[A+], respectively. Tau meta-VOI/CGM SUVRs were 1.16 ± 0.13, 1.18 ± 0.21, 1.15 ± 0.10, and 1.29 ± 0.26 for normal, PRE-AD, MCI[A−], and MCI[A+], respectively.
For the AMED-PRE data alone, MUBADA/PERSI SUVRs were 1.04 ± 0.03, 1.08, 1.06 ± 0.01, and 1.09 ± 0.05 for normal, PRE-AD, MCI[A−], and MCI[A+], respectively. Tau meta-VOI/CGM SUVRs were 1.15 ± 0.06, 1.27, 1.15 ± 0.002, and 1.31 ± 0.10 for normal, PRE-AD, MCI[A−], and MCI[A+], respectively.
The statistical analysis for MUBADA/PERSI SUVRs showed significant differences between normal and PRE-AD, between normal and MCI[A+], and between MCI[A−] and MCI[A+]. For the combined data (ADNI3 + AMED-PRE), there were significant differences between normal and PRE-AD (P = 0.025), between normal and MCI[A+] (P < 0.001), and between MCI[A−] and MCI[A+] (P < 0.01) (Fig. 2A). For the ADNI3 data, there were significant differences between normal and PRE-AD (P = 0.024), between normal and MCI[A+] (P < 0.01), and between MCI[A−] and MCI[A+] (P < 0.01) (Fig. 2B). For the AMED-PRE data, there were no significant differences between any pair of the categories (Fig. 2C).
The tau meta-VOI/CGM method provided abhigher SUVR than the MUBADA/PERSI method, with a mean difference of 0.136 for the combined data. The trend was consistent irrespective of clinical categories. The average SUVR increase was 0.136 in the ADNI3 data. For each category, the increase was 0.135 in normal, 0.118 in PRE-AD, 0.118 in MCI[A−], and 0.173 in MCI[A+]. For the AMED-PRE data, the SUVR increase was 0.137 in all categories, 0.113 in normal, 0.198 in PRE-AD, 0.086 in MCI[A−], and 0.223 in MCI[A+].
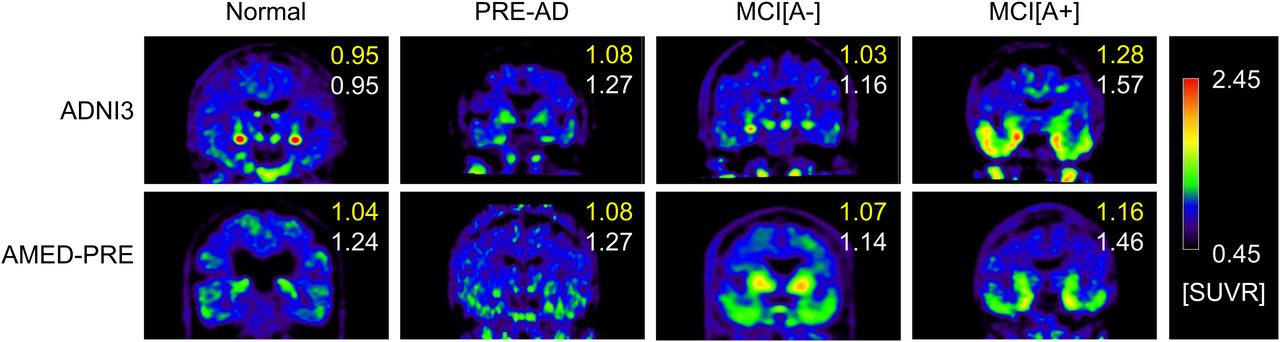
Figure 3 shows representative 18F-flortaucipir PET images from each clinical category for both databases. Figure 4 shows representative reference regions defined by the PERSI method based on the white matter histogram. Figure 5 shows a representative case, in which the target and reference VOIs of the MUBADA/PERSI and tau meta-VOI/CGM methods are overlayed. Table 3 summarizes features of each analysis method. The target VOI volume of MUBADA is fixed because the VOI is defined in the Montreal Neurologic Institute atlas space.

Typical 18F-flortaucipir PET images in each clinical category. Numbers in each image indicate SUVRs computed with MUBADA/PERSI method (upper number) and with tau meta-VOI/CGM method (lower number). Reference value for color scale was defined by PERSI.

Histogram of white matter voxel radioactivity (kBq/mL) and process of extracting PERSI reference in 2 MCI[A+] cases (A and B). White matter histogram (WM hist) is fitted with 2 gaussian curves (G1 and G2), of which G2 corresponds to voxels with abnormal 18F-flortaucipir accumulation, if any, and spillover. Red rectangle indicates selected range derived from G1 to define reference white matter image, which is presented together with original PET image of same slice. MUBADA/PERSI SUVR is 1.16 (A) and 1.71 (B).

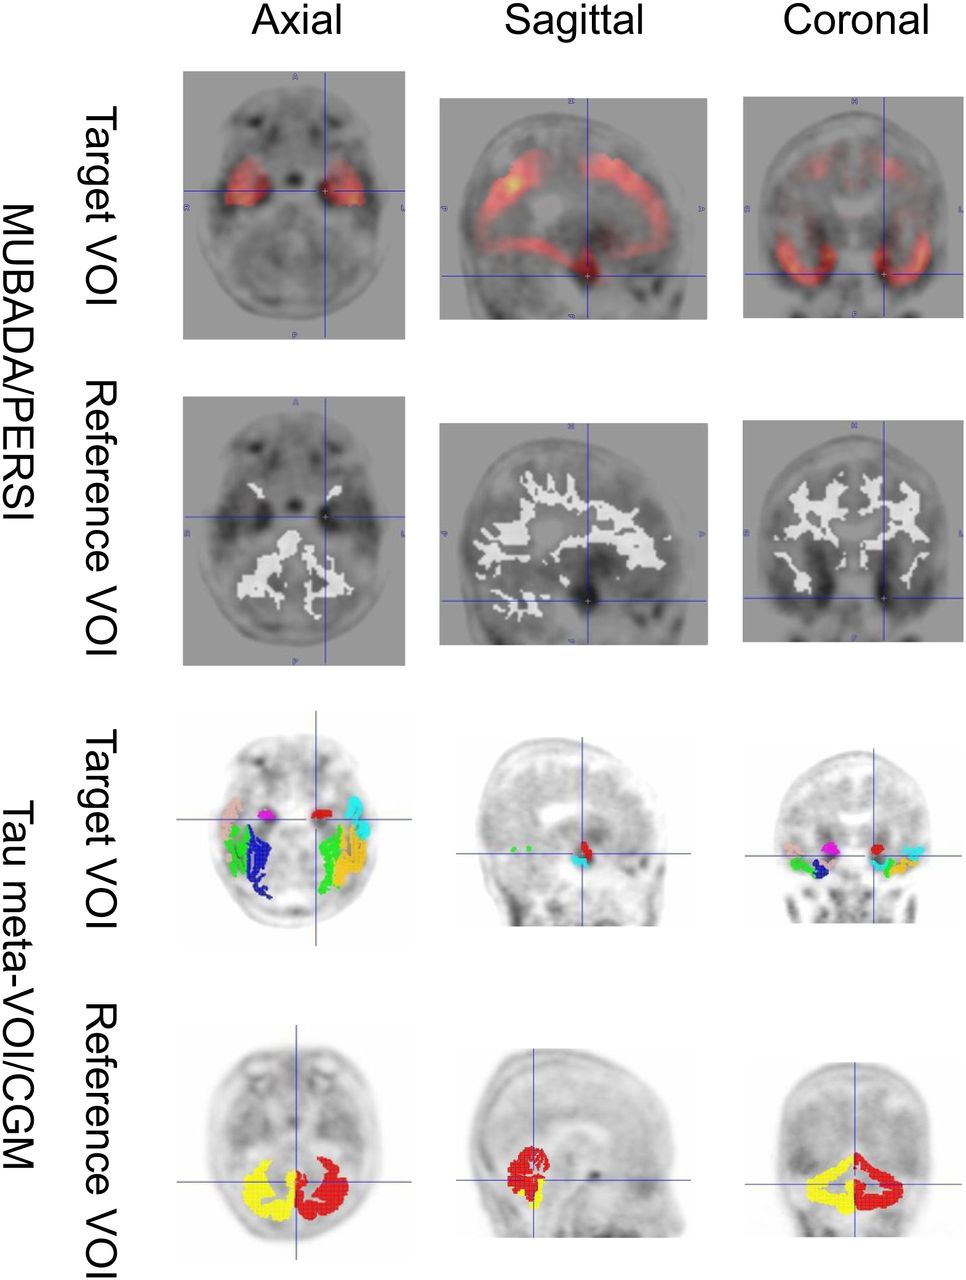
VOI setting by MUBADA/PERSI and tau meta-VOI/CGM methods in representative late-MCI case. MUBADA/PERSI SUVR is 1.16, and tau meta-VOI/CGM SUVR is 1.46.
Analysis Methods
DISCUSSION
In this study, we compared SUVRs measured by the MUBADA/PERSI and tau meta-VOI/CGM methods using the same dataset of 2 multicenter projects characterizing the clinical stages of AD progression. SUVRs measured by MUBADA/PERSI were more closely associated with the clinical severity of AD than those measured by tau meta-VOI/CGM.
As the databases for the present study, we selected the multicenter projects that used 18F-flortaucipir as a tau-imaging tracer. 18F-flortaucipir has been widely used in research, and it was approved as 18F-flortaucipir (Tauvid; Lilly) by the U.S. Food and Drug Administration in 2021 as a first-generation tau PET agent for AD (14). Two multicenter projects, AMED-PRE and ADNI3, have made available databases of 18F-flortaucipir images, MR images, neuropsychologic tests, amyloid PET results, and participant demographic data. And the 2 projects were in the same vein with different study populations in different countries: the AMED-PRE was conducted in Japan, and the ADNI3 study was conducted in North America. There were considerable differences in the PET scanners used in the 2 projects (Table 2). Both projects also set up PET cores to control PET image quality (10,11). We selected all 15 subjects who underwent 18F-flortaucipir PET in AMED-PRE and randomly selected 91 subjects from the ADNI3 database who underwent 18F-flortaucipir imaging considering the clinical categories.
For the combined AMED-PRE and ADNI3 cases, both MUBADA/PERSI and tau meta-VOI/CGM analyses tended to provide higher SUVRs as cognitive impairment progressed (normal to MCI[A+]), with the mean value trend of normal ≈ MCI[A−] ≤ PRE-AD < MCI[A+]. A similar trend was observed for both the AMED-PRE and the ADNI3 data.
Quantitatively, the tau meta-VOI/CGM method provided about 10% higher SUVRs and larger SDs than the MUBADA/PERSI method provided. When SUVRs were statistically compared among the clinical categories for the combined database, the MUBADA/PERSI method showed significant differences between categories, with normal < PRE-AD and normal < MCI[A+] and MCI[A−] < MCI[A+], whereas the tau meta-VOI/CGM method showed no significant differences. The same finding was also observed for ADNI3 data. The lack of significant differences by the tau meta-VOI/CGM method might be due to the larger SDs, as the SUVRs themselves were systematically higher by about 0.1 for all clinical categories. On the other hand, no significant difference was observed for AMED-PRE data between any pair of the clinical categories with either method, probably because of the small number of cases (n = 15).
The MUBADA/PERSI method provided significantly higher SUVRs for normal < PRE-AD and normal < MCI[A+] and MCI[A−] < MCI[A+], but no significant differences were observed between normal and MCI[A−] or PRE-AD and MCI[A−]. The PRE-AD and MCI[A+] subjects were characterized by amyloid positivity in the category, which may explain the trend of higher SUVRs, that is, more tau accumulation than normal because of AD pathology (15). These results were consistent with previous findings (16). In contrast, MCI[A−] in the present study included cases without amyloid accumulation, which might be the reason why there was no significant difference between normal and MCI[A−].
The tau meta-VOI/CGM method provided higher SUVRs and larger SDs than the MUBADA/PERSI, with a similar general trend for all clinical categories. The difference in the setting of reference and target VOIs was the main reason for the higher SUVRs.
Regarding the target VOIs, the MUBADA/PERSI method used the MUBADA VOI, and tau meta-VOI/CGM method used the tau-meta VOI. The MUBADA VOI was larger than the tau-meta VOI. MUBADA VOI included the occipital and parietal lobes in addition to the temporal lobe covered by tau-meta VOI (Fig. 5). Therefore, the MUBADA VOI was about 15 times larger than the tau-meta VOI (Table 3), which might make the SUVR stabler and the SD smaller. Meanwhile, the tau-meta VOI was placed around inferior and middle temporal areas excluding the choroid plexus area, where 18F-flortaucipir may accumulate nonspecifically (3). However, a certain amount of spill-in from the neighborhood including the choroid plexus may be inevitable. This might be one of the reasons why the tau meta-VOI/CGM SUVRs had larger SDs.
As for the reference regions, the MUBADA/PERSI method used the PERSI VOI, and the tau meta-VOI/CGM method used the CGM VOI. The PERSI VOI was provided by a data-driven method for each subject based on the white matter distribution derived from the voxel histogram, whereas the CGM VOI is anatomically defined as CGM. Therefore, the PERSI VOI was about 4 times larger than the CGM VOI (Table 3). Since a larger VOI volume generally results in a stabler value (17), the large reference VOI would reduce the SD of the MUBADA/PERSI SUVR. In addition, compared with PERSI, the CGM was a VOI adjacent to the CSF space resulting in a smaller value due to spill-out, which might be one of the reasons for the higher tau meta-VOI/CGM SUVRs. Thus, the difference between the 2 methods was probably due to the technical differences in VOI settings, and the trend of values in clinical categories was similar.
Comparing the 2 quantitative evaluation methods of tau PET images, both methods were useful as 18F-flortaucipir analysis methods for the AD continuum progress. However, the MUBADA/PERSI method provided a better association between the derived SUVRs and the clinical category, suggesting that it might be useful for staging subjects in AD-continuum studies.
There were some limitations in our study. First, the number of PET scanner models was limited, and the potential variability introduced by different scanners was not considered in the study. Quantification method accuracy may be affected by the image resolution and noise, which are dependent on PET scanner performance and image reconstruction parameters. Second, the number of cases for the AMED-PRE database was small, and the distribution of clinical categories was unbalanced. Therefore, the results in our study could be considered limited by such practicable research database conditions. Third, tau meta-VOI/CGM is not a state-of-the-art analysis method and does not fully take into account the effects of 18F-flortaucipir off-target binding to CGM, as the reference region, such as choroid plexus, which should be considered. As an anatomic method, a new reference method, such as the spatially unbiased infratentorial template (SUIT) template, was developed to reduce the influence of off-target 18F-flortaucipir binding (13,18). Analysis methods based on the characteristics of each imaging agent are constantly evolving, including various aspects such as the settings of the target and reference regions and the methodology. To obtain the latest findings, evaluation using the dedicated methods for the imaging agent is necessary.
CONCLUSION
In this study, we compared 2 quantitative analysis methods for 18F-flortaucipir PET images, the MUBADA/PERSI method and the tau meta-VOI/CGM method. There were systematic differences in the quantified values (SUVR) obtained from the 2 methods; the tau meta-VOI/CGM provided higher SUVRs. There were also method-dependent differences in variability; the tau meta-VOI/CGM had larger SDs for the SUVRs. Although consistent and similar results were obtained with both methods, only the MUBADA/PERSI method presented a significant difference in SUVR between amyloid-negative normal and amyloid-positive PRE-AD clinical categories. This result suggests that the MUBADA/PERSI method could improve the tau accumulation detectability. Our study results support the usefulness of the MUBADA/PERSI method as a quantitative measure of tau accumulations in early-stage AD studies.
DISCLOSURE
Yasuhiko Ikari is an employee of CMIC Co., Ltd. Michio Senda has been a principal investigator of clinical trials sponsored by Avid/Eli Lilly. No other potential conflict of interest relevant to this article was reported.
KEY POINTS
QUESTION: How do the MUBADA/PERSI and tau meta-VOI/CGM methods for SUVR measurements compare in assessing the progression of AD through 18F-flortaucipir PET imaging?
PERTINENT FINDINGS: In a study comparing 106 cases from 2 open multicenter PET databases, significant differences in SUVR were found between certain clinical categories when the MUBADA/PERSI method was used, but not with the tau meta-VOI/CGM method. Specifically, MUBADA/PERSI demonstrated a better association with the clinical severity of the AD continuum and reduced variability.
IMPLICATIONS FOR PATIENT CARE: The findings suggest that MUBADA/PERSI might be a more effective quantitative measure for assessing the progression of AD in multicenter studies using 18F-flortaucipir PET imaging, potentially leading to better diagnostic precision and patient care strategies.
ACKNOWLEDGMENTS
The investigators within AMED-PRE and the ADNI contributed to the design and implementation of AMED-PRE or provided data but did not participate in analysis or writing of this report. A complete listing of the investigators can be found online (https://humandbs.biosciencedbc.jp/en/hum0235-clinical-sites and http://adni.loni.usc.edu/wp-content/uploads/how_to_apply/ADNI_Acknowledgment_List.pdf).
Footnotes
Published online Apr. 16, 2024.
REFERENCES
- Received for publication December 28, 2023.
- Revision received February 2, 2024.


