


Visual Abstract

Abstract
Dynamic antral contraction scintigraphy (DACS) has been used to evaluate for gastric dysmotility by measuring antral contraction frequency and ejection fraction (EF). Fourier phase image analysis has the potential to assess gastric antral contractions for dyssynchrony as has been used for analyzing nuclear cardiology ventriculography (multigated acquisition studies) for cardiac dyssynchrony. The aims of this study were to determine whether Fourier phase analysis helps to characterize antral motility physiology, whether Fourier phase analysis correlates with conventional gastric emptying scintigraphy (GES), and which DACS parameters may aid in diagnosing gastric dysmotility, particularly delayed gastric emptying (GE). Methods: DACS and GES of healthy volunteers (n = 22) were compared with patients (n = 99) with symptoms of gastroparesis. New DACS Fourier phase analysis software was developed. Results: GE was delayed (n = 53) or normal (n = 46) in patients. There was a linear correlation between the time for the stomach to empty 50% of the meal and the percentage total proximal and distal in-phase antral pixels at 30 min (r = 0.37, P = 0.0001) and 60 min (r = 0.26, P = 0.007). In healthy volunteers, the mean proximal-to-distal ratio of in-phase antral pixels increased from 1.67 (30 min) to 2.65 (120 min) (P = 0.035), and EF increased from 23% (30 min) to 32% (120 min) (P = 0.022). Multivariable regressions of percentage total proximal and distal in-phase antral pixels (30 min) and EF (60 min) were the best predictors of abnormal GE (adjusted odds ratio, 3.30 [95% CI, 1.21–9.00] and 2.97 [95% CI, 1.08–8.21], respectively). Conclusion: This study used Fourier phase analysis to analyze DACS in healthy volunteers and patients with symptoms of gastroparesis. In addition to establishing reference values, new physiologic information on antral motility was obtained. In healthy volunteers, there was an increasing proximal-to-distal ratio of in-phase antral pixels and antral EF over time after meal ingestion. The percentage total proximal and distal in-phase antral pixels at both 30 and 60 min correlated well with GE values for the time for the stomach to empty 50% of the meal. For symptomatic patients, the percentage total proximal and distal in-phase antral pixels at 30 min and the EF at 60 min after meal ingestion correlated with delayed GE on conventional GES. Thus, Fourier phase analysis of DACS appears to have potential to further aid in diagnosing gastric dysmotility in GES.
Although in widespread clinical use, conventional gastric emptying scintigraphy (GES), which measures only the percentage of total gastric emptying (GE) of a standardized meal, does not always correlate well with symptoms of gastroparesis. In some studies, GES is able to detect abnormal GE in only up to 40% of patients when there is a high clinical suspicion of gastroparesis (1). Because conventional GES fails to detect gastric dysmotility as a cause of symptoms in some patients when there is a high clinical suspicion of impaired GE, efforts have been made to augment GES using more advanced analysis of GES, particularly dynamic antral contraction scintigraphy (DACS), which permits assessment of antral contractility (2–4).
Antral hypomotility has been shown to be directly related to impaired GE using invasive manometric studies (5). In patients with dyspepsia and symptoms of gastroparesis, antroduodenal manometry has been associated with infrequent, low-amplitude pressure waves in the antrum (6). However, other investigations, even in patients with severe dyspepsia, have failed to identify a strong positive correlation between symptoms, GE, and postprandial manometric recordings of antral contractility (7).
Although DACS was introduced over 20 y ago, the methodology and technical aspects of performing DACS have not been standardized. Furthermore, prior DACS used research software available only at the small number of institutions performing those studies, limiting the more widespread use of DACS. Two variables from Fourier analysis of DACS, antral contraction frequency and amplitude, have typically been used to characterize antral contractility. The dominant antral contraction frequency has been calculated as the frequency with the highest Fourier amplitude. Antral contraction amplitude has been measured using either the amplitude of the Fourier analysis (4) or ejection fraction (EF) (2) derived from the percentage of radioactive content displaced by an average contraction from a region in the mid antrum.
These prior studies have shown the potential of DACS to characterize both the normal and the abnormal physiology of antral contractions. Urbain et al. demonstrated in longstanding diabetes that the lag phase of GE was prolonged and was associated with a reduction in the amplitude of antral contractions (4). Knight et al. showed that slower GE in women than in men directly related to a mid-antral decrease in the EF, which correlated with antral manometry (2). More recently, we demonstrated that DACS can be used to assist in partitioning the stomach into proximal and distal sections allowing measurement of fundic accommodation and to measure antropyloroduodenal contractions in healthy volunteers (3,8).
Fourier analysis of nuclear cardiac ventriculography (multigated acquisition studies) has been well established for cardiac dyssynchrony. Left ventricular dyssynchrony is present when there are temporal differences in the activation and contraction of various left ventricular myocardial segments. Impairment of left ventricular systolic function and reduced cardiac output can be the result of such left ventricular dyssynchrony (9). Nuclear medicine DACS of the stomach is performed in a similar manner to nuclear cardiac multigated acquisition studies. The software needed to analyze either cardiac or antral contractions assigns a phase angle to each pixel of the Fourier phase image, which is derived from the first Fourier harmonic. The phase angle reflects the similarity or difference in timing to the onset of contraction in each adjacent image pixel. Similar to its application in nuclear cardiology, this type of Fourier phase image analysis has the potential to assess gastric antral contractions for dyssynchrony.
The aims of this study were to investigate the potential of antral Fourier phase analysis to add physiologic information on antral motility, to investigate how Fourier phase analysis of DACS correlates with conventional GES, and to study which DACS parameters may contribute to diagnosing delayed GE. To accomplish these aims, we developed and validated a new DACS processing software package allowing performance of Fourier phase analysis and established reference DACS results in healthy volunteers.
MATERIALS AND METHODS
All healthy volunteers included in this study were the same as those included in our prior study using DACS to measure antropyloroduodenal contractions (3). Our institutional review board approved this study, and all healthy volunteers gave written informed consent. The retrospective symptomatic patient studies included 100 sequential patients referred for GES with DACS between September 26, 2018, and March 24, 2021, who had symptoms suggesting gastroparesis. An institutional review board waver was issued for review of the retrospective studies.
All healthy volunteers were questioned to ensure they had no prior history of gastrointestinal disease or prior gastrointestinal surgery and that they were not taking medications that might affect gastrointestinal function. All healthy volunteers and symptomatic patients came to the Nuclear Medicine Department on the morning after an overnight fast. GES was performed using the 4-h liquid egg white protocol described initially by Tougas et al. (10) and recommended in the current Society of Nuclear Medicine and Molecular Imaging guideline (11) and the consensus report of the Society of Nuclear Medicine and Molecular Imaging and the American Neurogastroenterology and Motility Society (12). The meal consists of 120 g (4 oz) of liquid egg white radiolabeled with 99mTc-sulfur colloid and served with 2 pieces of white bread and jelly. In addition, patients were given 120 mL of water immediately after ingestion of the solid portion of the meal. The dose of 99mTc-sulfur colloid given to the healthy volunteers for GES with DACS ranged from 74 to 370 MBq (2–10 mCi) as previously described (3). All patient studies were performed with a minimal dose of 74 MBq (2 mCi).
After meal ingestion, conventional static GES using a 128 × 128 matrix was performed at 0, 0.5, 1, 2, 3, and 4 h, with the subject upright in the anterior and then the posterior position for 30 s in each position. DACS was performed using continuous anterior list-mode 1-s images obtained for 10 min (total of 600 images) immediately after the static imaging and at 0.5, 1, and 2 h as previously described (2,8).
Total-stomach conventional GES results were analyzed from the static images as the percentage of radioactivity retained in the whole stomach using the geometric mean of the decay-corrected anterior and posterior counts for each time point. Because Fourier analysis of the DACS images does not require depth correction of counts using the geometric mean, the DACS images were acquired and processed using anterior images only. Delayed GE was defined as more than 60% gastric retention of the 99mTc-labeled solid meal at 2 h, more than 10% at 4 h, or a T½ (time for the stomach to empty 50% of the meal) of more than 132 min, computed by a power exponential curve fit (10,12).
All DACS images were analyzed using a β-version MIM Software workflow developed for this study. Before processing of the DACS images, the serial continuous dynamic images consisting of a total of 600 images of 1 s each were first reviewed and motion-corrected using standard motion correction software to help eliminate patient movement artifacts. A 2-cm region of interest was then placed over the mid antrum to record a time–activity curve for antral contractions from the serial DACS image set. To further minimize patient movement artifacts and to ensure analysis of consistent peristaltic contractions, the time–activity curve from the continuous dynamic set was visually reviewed and a minimum set of 4 consecutive antral peristaltic waves that demonstrated consistent frequency and amplitude of contractions was selected for analysis (Fig. 1).

User selection of set of antral contractions for DACS analysis. This example of time–activity curve from patient study shows that even after use of image motion correction software, patient motion can result in significant motion artifacts in time–activity curve. Software workflow allows user to select optimum subset of image peaks and valleys (as shown between start time and end time), where antral contractions are stable and will be used for DACS processing.
During visual review of the serial images used to create the final DACS composite image sequence, we observed, as others have reported (13), short intermittent periods of irregular antral contractions. Any such periods of antral dysrhythmia were excluded from the final DACS analysis. To establish how often these occurred in the healthy volunteers, both readers measured the percentage of time these were observed during the 10-min DACS recordings. The average percentage of the time these episodes of antral dysthymias were observed in healthy volunteers was calculated for the 2 readers.
The software workflow calculates the mean frequency of antral contractions by measuring the peak-to-peak time intervals from the time–activity curve. The mean EF is then calculated from the time–activity curve, with the EF for the time interval (i) for each individual contraction being given by…
where maximum and minimum refer to the number of counts derived from the antral time–activity curve for each time interval.
The software reformats a grouped image series using the set of selected antral contractions for Fourier analysis. This final composite cinematic image series provides a movie display of the temporal movement of the antral peristaltic wave, which typically starts in the area of the incisura and propagates distally toward the pylorus. The results of the Fourier analysis for all antral pixels are color-coded in a final display of the Fourier-derived phase angles and amplitude (Fig. 2).

Healthy volunteer. (A) Fourier phase image showing color-coded pixels of Fourier phase analysis. Two-centimeter-wide region of interest drawn over mid antrum is same as obtained from those pixels in mid antrum with highest amplitude as shown in B. Antral peristaltic wave originates at incisura (white arrows). Resulting phase image shows those pixels that have similar color-coded phase angles clustered in proximal and distal antrum to left and right of mid antral region of interest. Leading edge of in-phase pixels appears as band of pixels (shown here with white color scale or 0° phase angle [green arrow]) in proximal antrum. To left of mid antral region of interest, group of pixels appears (∼180° from leading edge, red/orange color scale) corresponding to retrograde contractions arising in distal antrum. (B) Amplitude image showing color-coded pixels of Fourier amplitude. Image demonstrates cluster of high-amplitude pixels in mid antral region of interest (arrow) and in adjacent proximal antrum. (C) Single frame of composite cine image, with colored pixels representing total counts of radiolabeled solid-food activity in stomach. When viewed as movie display, antral peristaltic wave can be seen to originate at incisura (white arrows) and propagate distally through antrum across mid antral region of interest, followed by retrograde bolus movement back into proximal antrum. (D) Time–activity curve from mid antral region-of-interest–derived gastric counts, which are used to calculate antral contraction frequency and EF. ROI = region of interest.
After visual display and review of the phase and amplitude maps, the software permits the operator to manually define regions of interest for the proximal, distal, and total area of the antrum. The software then applies an automated threshold (40% threshold of the antrum-derived phase angles) to calculate the number of pixels in the proximal and distal antral areas, which, as a group, are in phase and have similar timing in their onset of contraction, where…
The ratio of in-phase proximal pixels to distal pixels is also calculated to characterize the relative contribution of proximal versus distal antral pixels with in-phase contractions.
The DACS results of the patients with suspected gastroparesis were compared with the results of the normal volunteers and correlated with the results of conventional GES, including the percentage of total GE at 2 and 4 h and measurement of a power exponential fit to calculate the T½ of GE. For classification of the results of conventional GES, a patient was considered to have delayed GE if any one of the following criteria was met: abnormal 2-h retention (>60% retained), abnormal 4-h retention (>10% retained), or a T½ of more than 132 min (10).
The DACS data on healthy volunteers for percentage total, proximal-to-distal ratio, EF, and contraction frequency were tested for normality using the Kolmogorov–Smirnov test and found to depart from being normally distributed at almost all time points (30, 60, and 120 min). The reference results by DACS were therefore expressed using medians and 90% intervals for all time points for these 4 parameters based on the healthy volunteers’ data. Linear (mixed-effects) regression analysis was used to correlate the DACS data with the data of conventional GES on T½ and percentages of gastric retention at 2, 3, and 4 h, as well as to perform time trend analyses for the 4 DACS parameters among patients or healthy volunteers. The 90% DACS intervals based on the healthy volunteers were used to define abnormality by DACS and associated with or used to predict conventional GES results. Group comparisons of DACS abnormality between patients or healthy volunteers with normal results and patients with abnormal results by conventional GES were performed using the Fisher exact test. Univariable and multivariable logistic regression analyses were performed to determine which DACS parameters could be used to help predict abnormal GES results, and raw and adjusted odds ratios (95% CIs) were reported from such logistic regression models, with the multiple regression model selected using the stepwise variable selection method. P values of less than 0.05 were considered statistically significant. SAS, version 9.4 (SAS Institute Inc.), was used for all data analyses. There was no adjustment for multiple comparisons because this study was exploratory and observational and not meant to confirm any a priori hypothesis or to make a statement regarding 2 or more parameters combined at the same time.
RESULTS
Study Subjects
Conventional GES results were normal for all 22 healthy volunteers (13/22 [59.1%] male; median age, 34.5 y [range, 23.0–69.0 y]). Of the 100 patients studied, 99 had studies suitable for analysis. One patient’s DACS study could not be analyzed because of marked motion artifacts at all time points and was therefore excluded. Of the 99 patients, 53 had delayed GE (12/53 [22.6%] male; median age, 42.0 y [range, 19.0–82.0 y]) and 46 had normal GE (6/46 [13.0%] male; median age, 40.0 y [range, 19.0, 78.0 y]).
DACS in Healthy Volunteers
An example of a healthy volunteer’s DACS software analysis output is shown in Figure 2. The healthy volunteers’ DACS results consistently demonstrated 2 well-defined areas of in-phase, color-coded pixels that localized in the proximal and distal antrum. The pixels with similar phase angles were separated by a band of pixels with no in-phase pixels, which correlated with a mid-antral area showing the highest Fourier-derived amplitude. This mid-antral region corresponded on the cine images visually to the peaks of bolus food antegrade and retrograde movements through the mid antrum (Fig. 2B).
A summary of the healthy volunteers’ (n = 22) DACS results for percentage total in-phase antral pixels, proximal-to-distal ratio, EF, and contraction frequency for all time points is shown in Table 1. The proximal-to-distal ratio significantly increased over time from a median of 1.67 at 30 min to 2.65 at 120 min (P = 0.035). Figure 3 shows an example of how the Fourier phase images demonstrate this normal increase in the proximal-to-distal ratio for in-phase pixels from 30 to 120 min. Similarly, the EF significantly increased with time from a median of 23% at 30 min to 32% at 120 min (P = 0.022). In healthy volunteers, the percentage total in-phase antral pixels did not change significantly over time from a median of 45% at 30 min to 51% at 120 min (P = 0.11). The frequency of antral contractions also did not significantly change over time, ranging from a median of 3.08 cycle/min at 30 min to 2.91 cycle/min at 120 min (P = 0.11).
Descriptive Summary and 90% Percentile Intervals Based on Healthy Volunteers for Conventional GES Parameters

Patient with normal GE and normal phase analysis. Shown are Fourier phase results at 30, 60, and 120 min. Elliptic region of interest (white) shows total antral area used for analysis. Similarly colored clusters of pixels in proximal and distal antrum are those that have similar phase angles by Fourier analysis. Typically, ratio of proximal-to-distal ratio for in-phase pixels increases from 30 to 120 min.
The mean percentage irregular contractions recorded by the 2 readers were 9.9% (range, 0%–34.7%) at 30 min, 11.7% (range, 0%–35.4%) at 60 min, and 11.3%% (range, 0%–23.1%) at 120 min.
DACS in Healthy Volunteers and Patients
Linear regression of the percentage total versus the T½ of GE using the healthy volunteers and all patients (n = 121) revealed a significant linear correlation at the 30- and 60-min time points (Fig. 4). At 30 min, the percentage total was 0.4630–0.0008 × T½ (r = 0.37, P = 0.0001). At 60 min, the percentage total was 0.4415 + −0.0005 × T½ (R = 0.2559, P = 0.0065). A similar linear trend seemed to exist for percentage total at 120 min but did not achieve statistical significance (0.4024 + −0.0003 × T½ (R = 0.1456, P = 0.1680).

Linear regressions of percentage total compared with T½ of GE. (A) 30 min (percentage total = 0.4630 + −0.0008 × T½, R = 0.3746, P = 0.0001). (B) 60 min (percentage total = 0.4415 + −0.0005 × T½, R = 0.2559, P = 0.0065). (C) 120 min (percentage total = 0.4024 + −0.0003 × T½, R = 0.1456, P = 0.1680).
The proximal-to-distal ratios at 30 and 120 min did not significantly correlate linearly with T½. There was, however, a fair linear correlation for proximal-to-distal ratio at 60 min (1.3361 + 0.0072 × T½, r = 0.19, P = 0.049). Antral contraction frequency at 30 min had a good linear correlation with T½ (2.8237 + 0.0017 × T½, r = 0.30, P = 0.003). EF showed no significant linear relationship with T½.
DACS in Patients with Delayed GE
Table 2 summarizes performance using the DACS parameters one at a time for detection of abnormal results on conventional GES. Measurement of the percentage total at all times (30, 60, and 120 min) appeared to correlate with abnormal results on conventional GES, with the strength of this correlation decreasing over time and achieving statistical significance only at 30 min. Among all the DACS parameters, the percentage total at 30 min (P = 0.001), proximal-to-distal ratio at 60 min (P = 0.017), and EF at 60 min (P = 0.011) were the only three that had a statistically significant predictive capability for abnormal results compared with conventional GES (sensitivity ≥ 35%, specificity ≥ 75%). The raw odds ratios of having abnormal results on conventional GES were 4.49 (95% CI, 1.81–11.15), 2.72 (95% CI, 1.23–5.99), and 3.47 (95% CI, 1.33–9.06), when comparing the group that had abnormal DACS results with the group that had normal DACS results for the 3 DACS parameters, respectively. Figure 5 shows an example of how the Fourier phase images demonstrate the lack of a consistent increase in the proximal-to-distal ratio for in-phase pixels from 30 to 120 min.
Predictive Capability of DACS Parameters for Abnormal Results Compared with Conventional GES

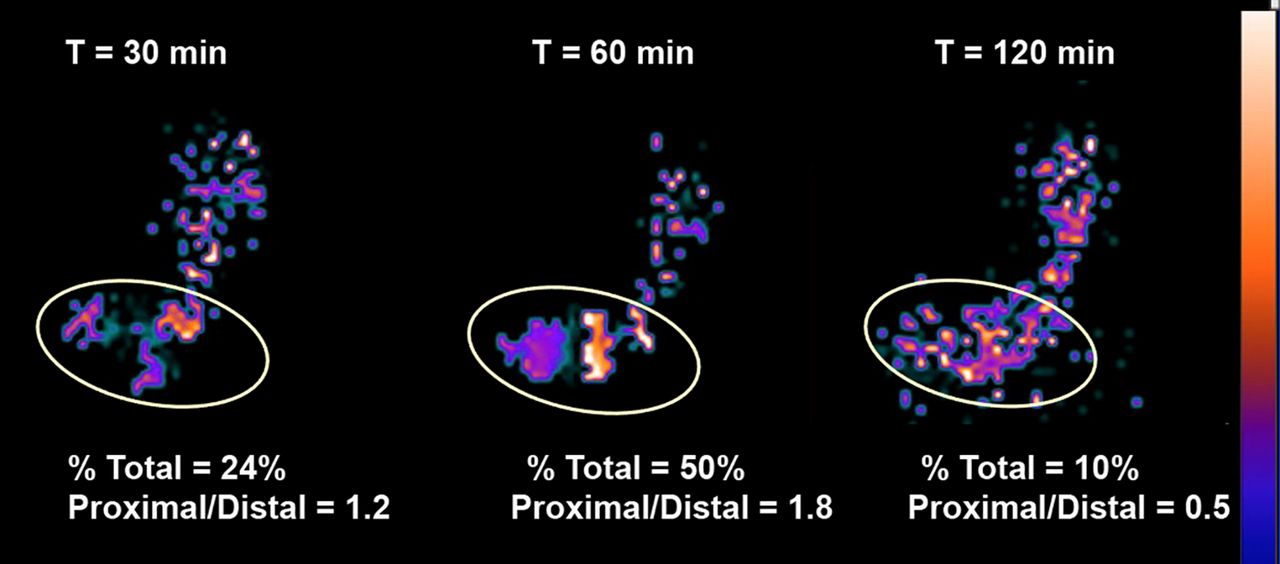
Patient with abnormal GE and abnormal phase analysis. Shown are Fourier phase angle images for patient with delayed GE (T½ = 188 min). Elliptic ROI as in Figure 4 again shows total antral area used for analysis. There is lack of synchronous in-phase proximal and distal antral pixels at 30 and 120 min compared with normal pattern (Fig. 4). At 60 min, there is cluster of proximal antral phasic activity but no coordinated distal phasic contractions.
On the basis of the multivariable logistic regression results, 2 abnormal values (the percentage total antral pixels at 30 min and the EF at 60 min) as defined using the healthy volunteers’ DACS data were the best subset of all DACS values for predicting abnormal results on conventional GES (Table 3; adjusted odds ratio, 3.30 (95% CI, 1.21–9.00) and 2.97 (95% CI, 1.08–8.21), respectively).
Multivariable Logistic Regression Identifying Best Subset of DACS Abnormality Parameters Associated with Standard Clinical Diagnosis Using Data from All Subjects (n = 121)*
DISCUSSION
There is increasing interest in the use of advanced imaging to more completely characterize the complex coordination of gastric motility within different functional areas of the stomach and how each contributes to overall GE and potential treatment of gastroparesis (14,15). Up to now, DACS has focused primarily on measuring the frequency and amplitude of antral contractions. We have previously shown that DACS can significantly enhance the information provided by GES not only by measuring antral contraction amplitude and frequency (8) but also by assessing antropyloric contractions that produce coordinated, antropyloroduodenal bolus propagation (3). Analogous to cardiac multigated acquisition studies assessing for ventricular dyssynchrony, DACS may provide information on the in-phase relationship of the timing to the onset of antral contractions. In this study, we have investigated the use of Fourier phase analysis to augment DACS analysis of the contractility of the proximal and distal antrum. We have also correlated how DACS measurements of antral contraction frequency, EF, and proximal and distal antral phase analysis correlate with conventional measurement of overall T½. This study showed that DACS percentage total in-phase antral pixels at 30 min and EF at 60 min are potential new measures of antral contractility that may have added value for predicting abnormal GE. Importantly, this study has led to development of a software package and associated reference values that can eventually be made available to others and offer the potential for more widespread clinical use.
Other imaging techniques have been used to assess for antral contractility, particularly most recently MRI, which can be used to measure gastric volumes and the phasic and amplitude components of gastric contractions (16). Although MRI has greater spatial and temporal resolution than scintigraphy, MRI for gastric motility currently has limitations, including use of nonphysiologic meals, limited scanner time for prolonged imaging, high costs, and current availability limited to only research centers.
This study showed that DACS in healthy volunteers demonstrates a consistent pattern of 2 in-phase areas of the antrum that show coordinated contractions. The first area is the proximal antrum, where antral contractions originate. This is separated from the distal antrum by a mid-antral segment, where the peristaltic wave propagates bolus movements of food through the antrum. The second area is in the distal antrum, where rhythmic contractions repel the incoming bolus in a retrograde fashion. The study also showed that the percentage of total proximal and distal antral pixels that are in phase by DACS analysis correlated well with the overall T½, suggesting that this quantitative measurement may serve as a new physiologic measurement of antral contractility. In addition, the study found that in healthy volunteers, the in-phase proximal-to-distal ratio for antral pixels significantly increased over time from 30 to 120 min after meal ingestion, a finding that agrees with early observations of Rees et al., who showed that the motility index of the distal antrum decreased in the postprandial period (17). This supports an important role of increasing proximal antrum contractions over time after meal ingestion as the fundus progressively moves solids into the antrum (Fig. 5). In a similar fashion, the antral EF in healthy volunteers increased with time. Finally, univariant and multivariant regressions showed that the percentage total in-phase antral pixels at 30 min and the antral EF at 60 min appeared to be predictors of delayed GE. We acknowledge that additional multiinstitutional clinical studies with more patients will be needed to see whether these findings can be confirmed and expanded to help explain symptoms in patients with suspected gastroparesis when conventional GES results are normal.
The final composite of dynamic images for the Fourier analysis used only a subset of the antral contractions (4 cycles) that occur during the 10 min of continuous list-mode DACS. We acknowledge that the quality of the Fourier analysis could improve using more gastric contraction cycles. We found, however, that the current β-software, which uses existing MIM cardiac phase-amplitude software, required typically a 10- to 15-min run time for 4 cycles. When we used more than 4 cycles, the processing time became greater than 20 min, which was not practical for the large number of patient studies and imaging time points needing analysis. The lengthy processing time of the current DACS MIM workflow is likely related to the need to reformat all the individual list-mode gastric images without the benefit of electrocardiography gating. Such gating, which is performed during cardiac multigated acquisition, helps create a single summed cardiac cycle for analysis.
The β-software used for DACS analysis in this study is still under development by MIM and not currently commercially available. We anticipate that as demand for processing DACS data grows, the current β-software processing time will be improved. It is our hope that based on the results of this study, a final commercial DACS software package with the potential for more widespread availability will make acquisition and processing of DACS available for routine clinical use.
Although processing of only 4 gastric contraction cycles could be considered a potential limitation of the analysis, this choice permitted us to select a set of the best reformatted, summed antral contraction cycles for measurement of phase, amplitude, frequency, and EF across multiple time points. Others have observed with DACS that although most antral contractions appear regular in frequency and amplitude within the time of observation, some antral contractions are irregular (13). We observed a low occurrence (average of 11%) of irregular antral contractions during DACS in healthy volunteers. Such short periods of spontaneous gastric arrythmias (which may be ≤35%) could affect the DACS analysis. Thus, we believe that visual review of the DACS imaging data and selection of an optimum set of gastric cycles before final analysis, as performed in this study, is desired and important to exclude not only irregular gastric contractions but also potential patient motion artifacts. Such selection of the regular antral contractions should be performed routinely as a part of DACS analysis. Further characterization of whether short periods of antral dysrhythmias affect overall GE in symptomatic patients will require additional study.
CONCLUSION
In this study, Fourier phase analysis of proximal and distal antral phasic contractions was added to DACS in addition to measurements of antral contraction frequency and EF. The study established new reference values and demonstrated new physiologic information on antral motility with a normal increasing proximal-to-distal ratio of in-phase pixels and EF with time after meal ingestion. The percentage total proximal and distal in-phase pixels correlated well with early T½ values. Further, for symptomatic patients, the percentage of in-phase proximal and distal antral pixels (at 30 min) and EF (at 60 min) after meal ingestion are potential new parameters to assess for abnormal antral contractility and delayed GE. Use of Fourier analysis of DACS has the potential to provide added understanding of the underlying pathophysiology of antral contractility.
KEY POINTS
QUESTION: Does Fourier phase analysis of DACS add physiologic information on antral motility that can augment conventional GES for diagnosing gastric dysmotility?
PERTINENT FINDINGS: In healthy volunteers, the proximal-to-distal ratio for in-phase antral pixels and antral EF increases with time after meal ingestion. The percentage total proximal and distal in-phase antral pixels at both 30 and 60 min correlated well with T½. For symptomatic patients, the percentage total proximal and distal in-phase antral pixels at 30 min and the antral EF at 60 min after meal ingestion have potential to further aid in diagnosing delayed GE.
IMPLICATIONS FOR PATIENT CARE: New software and associated reference values for antral contraction frequency, in-phase contractions, and EF have been developed and offer the potential for more widespread application of DACS to aid in the diagnosis of abnormal GE.
DISCLOSURE
A β-version of the MIM software was provided for these studies. Natalie Cole is a software engineer employed by MIM Software. As a salaried employee, she has no potential conflicts of interest in terms of any monetary gain for any potential sales of the software or patent ownership. No other potential conflict of interest relevant to this article was reported.
ACKNOWLEDGMENTS
We thank our nuclear medicine technologists (Danielle Powell, Mathew Mathai, Michael Gall, Theo Johnson, Jeanette Olson, Selina Kanowitz, and Supervisor Elizabeth Johnson) for their support and work performing these studies.
Footnotes
Published online Feb. 7, 2023.
REFERENCES
- Received for publication October 13, 2022.
- Revision received January 17, 2023.


